. 2025 Feb;301(2):108179.
doi: 10.1016/j.jbc.2025.108179. Epub 2025 Jan 10.

The steroid hormone 20-hydroxyecdysone induces lipophagy via the brain-adipose tissue axis by promoting the adipokinetic hormone pathway

Affiliations

The steroid hormone 20-hydroxyecdysone induces lipophagy via the brain-adipose tissue axis by promoting the adipokinetic hormone pathway

Yan-Xue Li et al. J Biol Chem. 2025 Feb.

Abstract

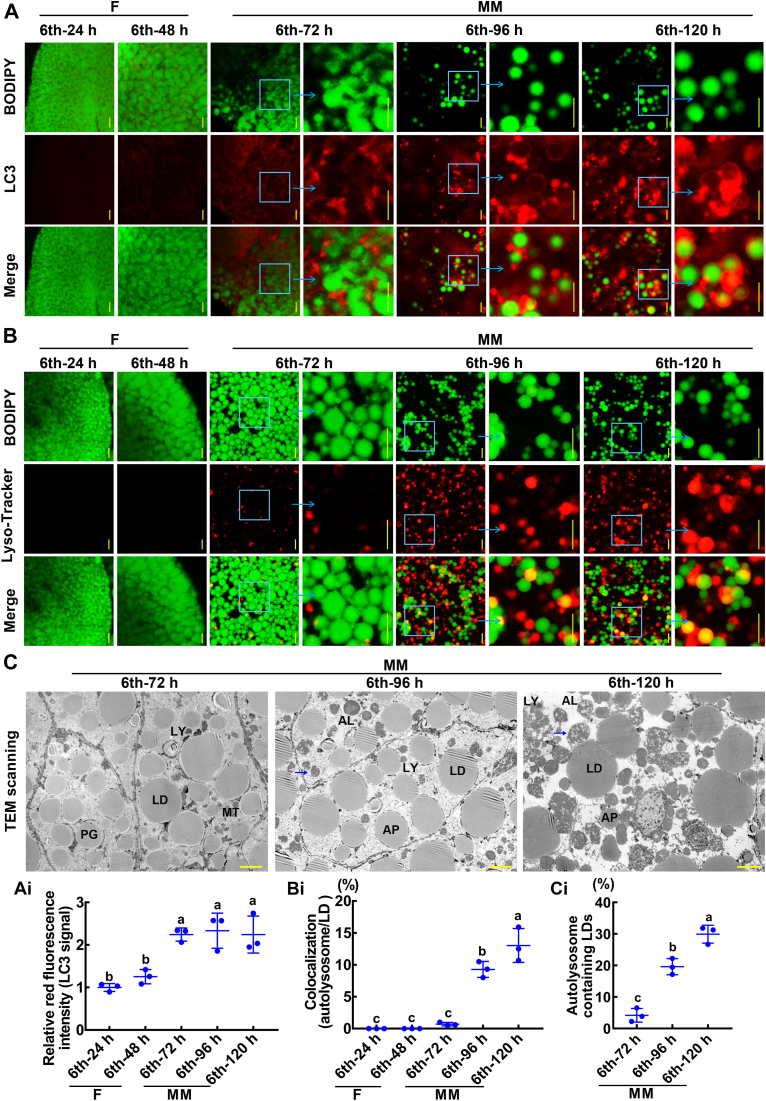
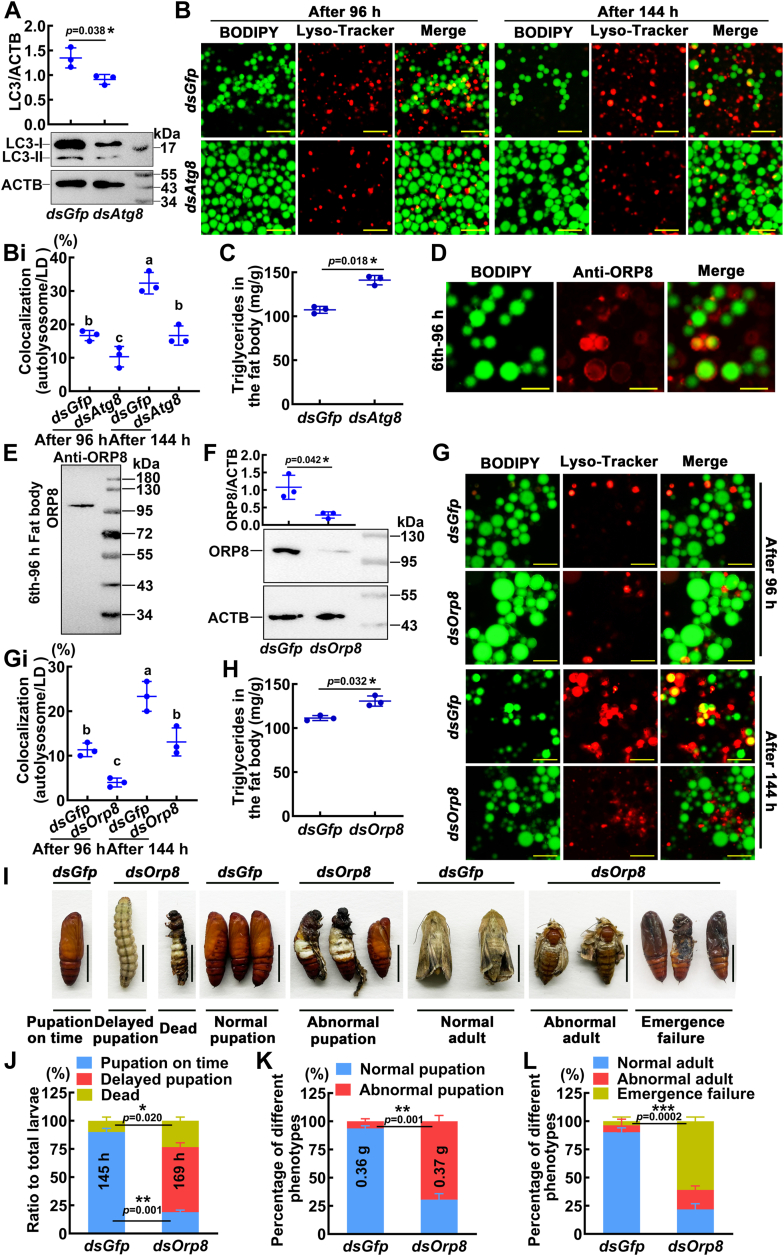
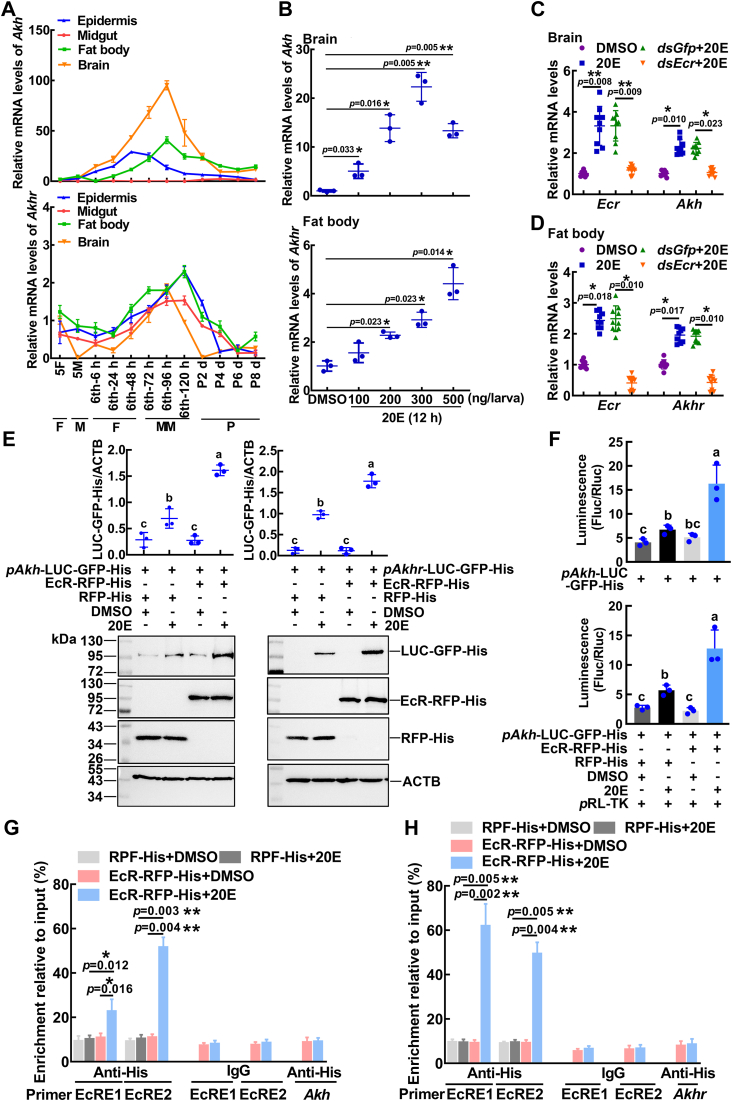
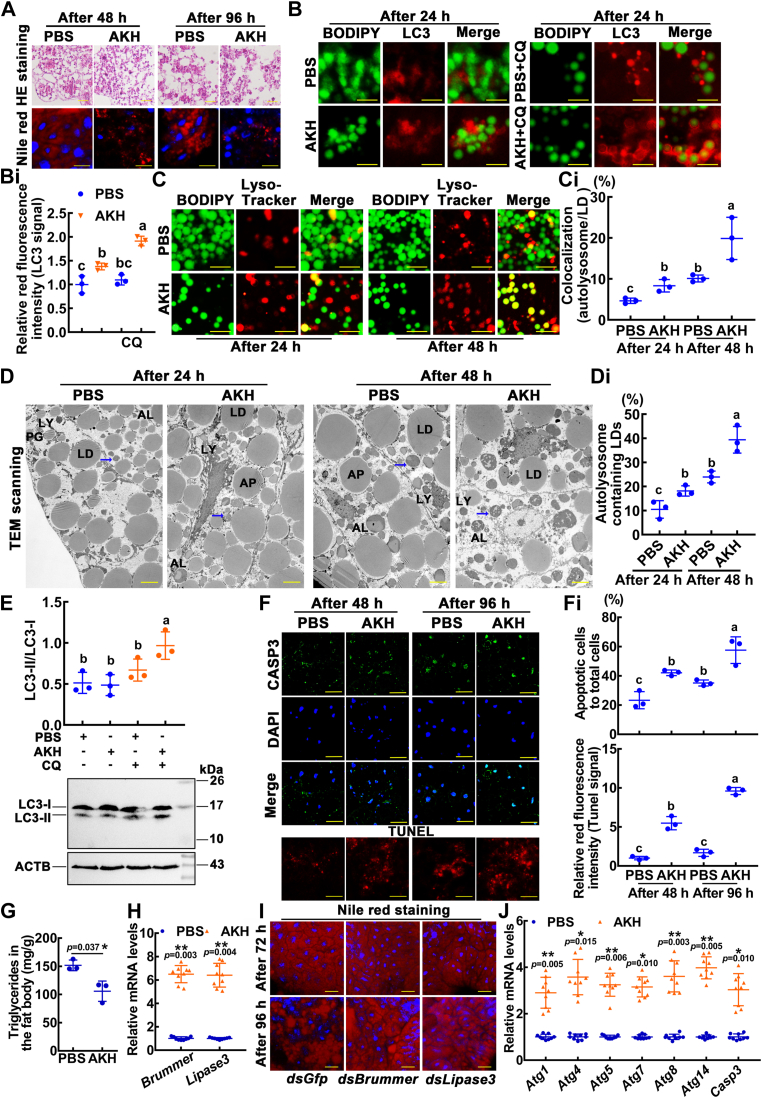
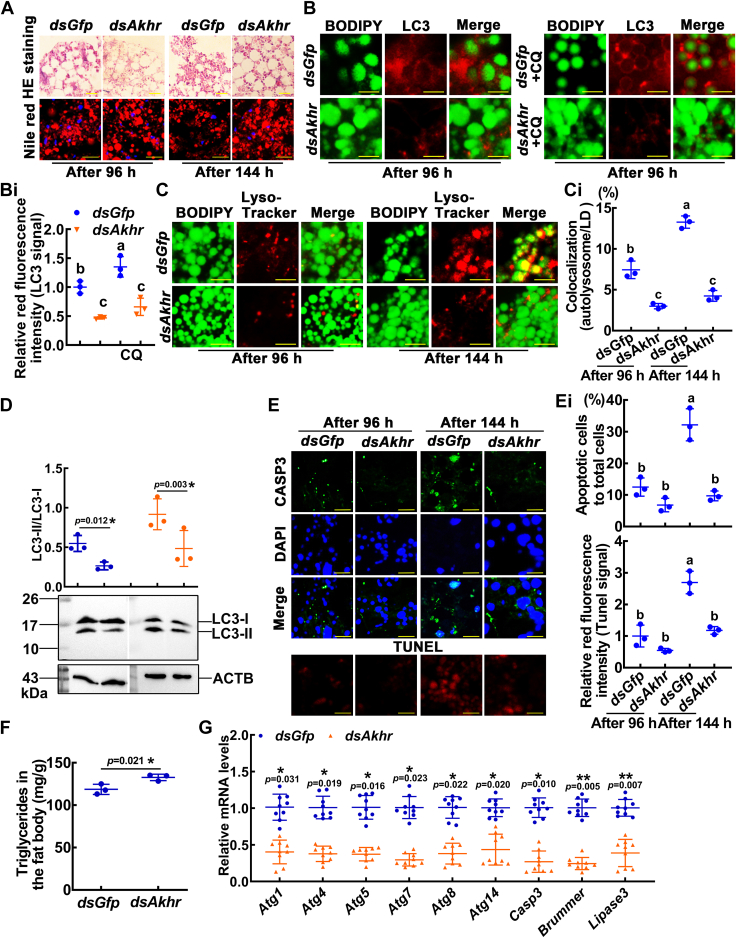
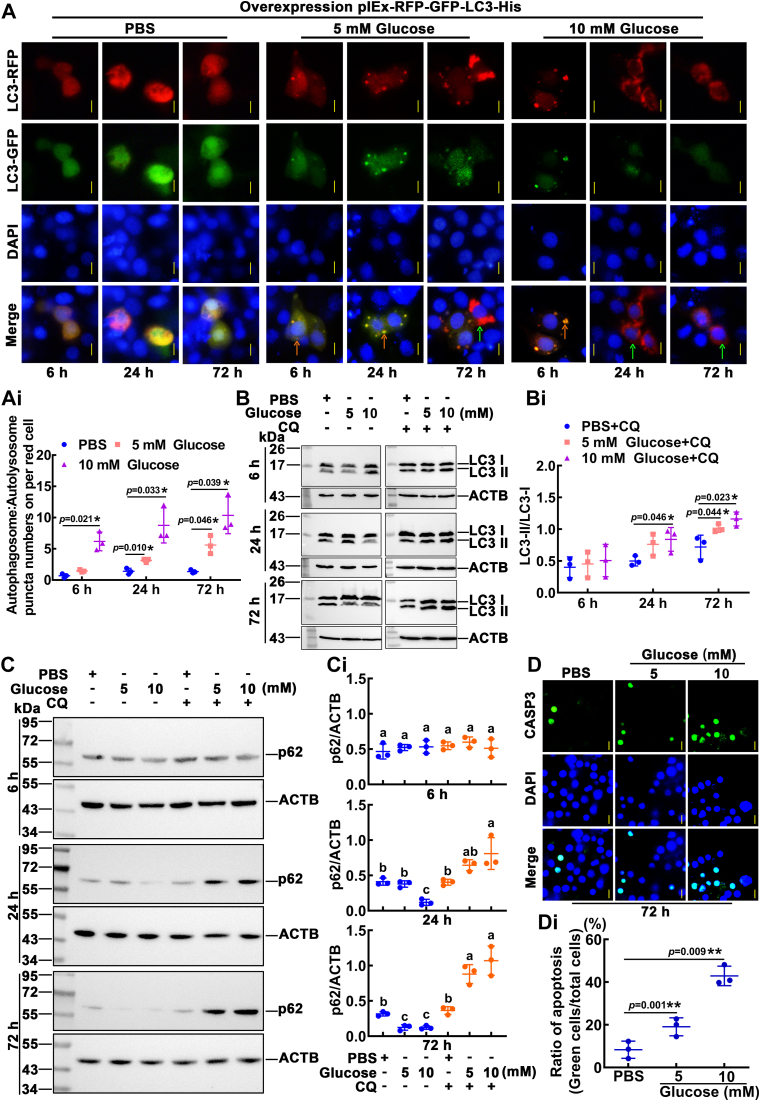
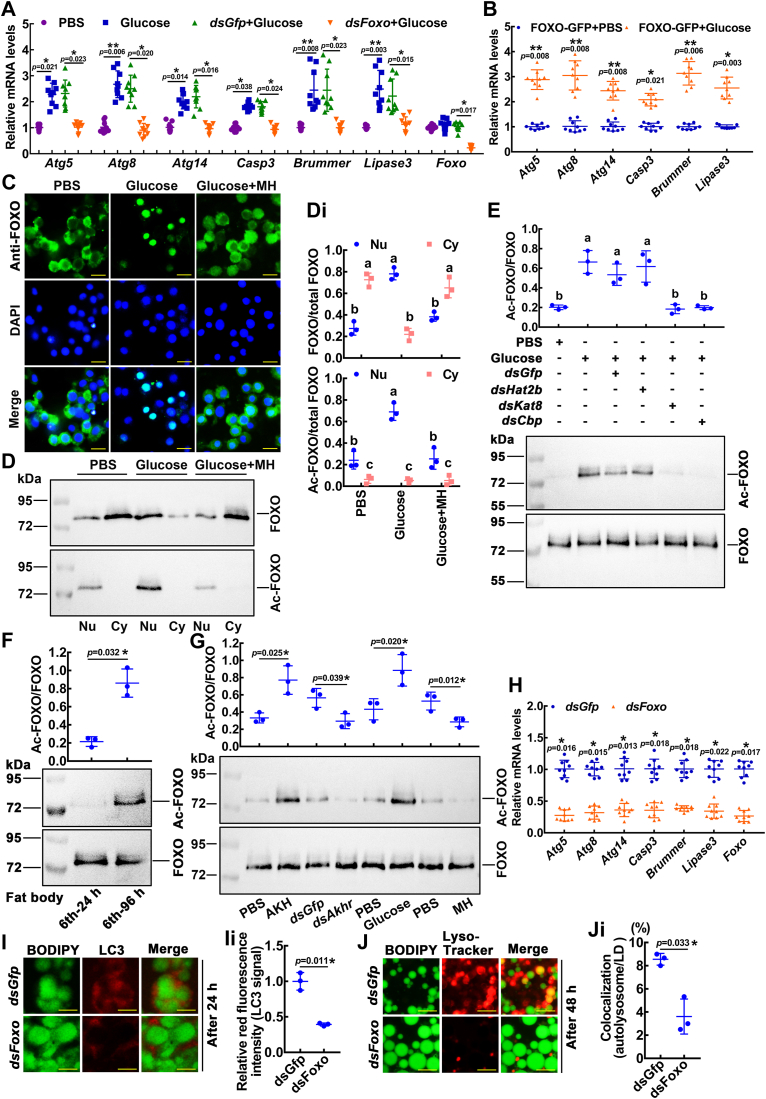
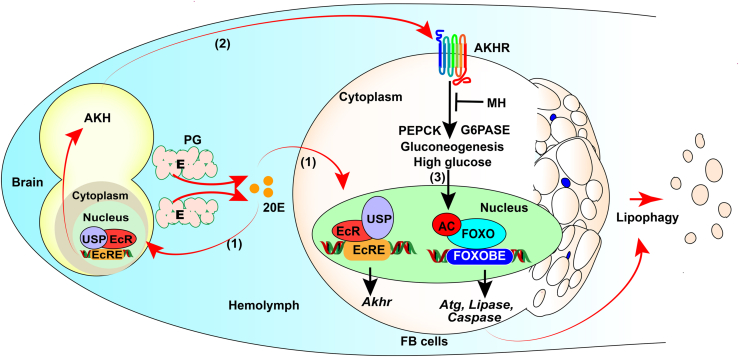
Lipophagy is a way to degrade lipids; however, the molecular mechanisms are not fully understood. Using the holometabolous lepidopteran insect Helicoverpa armigera, cotton bollworm, as a model, we revealed that the larval fat body undergoes lipophagy during metamorphosis, and lipophagy is essential for metamorphosis. The steroid hormone 20-hydroxyecdysone (20E) induced lipophagy by promoting the expression of the peptide hormone adipokinetic hormone (AKH, the insect analog of glucagon) and the adipokinetic hormone receptor (AKHR). Akh was highly expressed in the brain and Akhr was expressed in various tissues. The 20E upregulated the expression of Akh and Akhr by its nuclear receptor EcR during metamorphosis. AKH and AKHR increased glucose levels via gluconeogenesis and promoted lipophagy. The high glucose level induced acetylation of FOXO and nuclear localization to promote the expression of lipases and autophagy genes. Thus, the steroid hormone 20E induced lipophagy via the brain-adipose tissue axis by promoting the AKH pathway, which presented nutrients and energy to pupal and adult development during insect metamorphosis after feeding stops.

Keywords: 20-hydroxyecdysone; adipokinetic hormone; adipokinetic hormone receptor; glucose; lipophagy.


Conflict of interest statement

Conflict of interest The authors declare that they have no conflicts of interest with the contents of this article.

Figures

Figure 1
Figure 1
The lipophagy developmental profiles of the fat body.A, colocalization of LDs and LC3. BODIPY (5 μM for 30 min, green fluorescence) indicates LDs. LC3 (red fluorescence) indicates autophagosomes. Merge was the overlap of red and green fluorescence. F: feeding; MM: metamorphic molting. The bars represent 50 μm. Ai, statistical analysis of the LC3 signal intensity by ImageJ software. B, colocalization of LDs and lysosomes. BODIPY (5 μM for 30 min, green fluorescence). Lyso-Tracker (50 nM for 10 min, red fluorescence). Merge was the overlap of red and green fluorescence. The scale bars represent 50 μm. Bi, the ratio of lipophagy LDs (yellow) to total LDs (green). C, TEM images of fat body during metamorphosis. Blue arrows indicate that LD is entrapped in the lysosome. The bars represent 50 μm. LD: lipid droplet; PG: phagophore; AP: autophagosome; LY: lysosome; AL: autolysosome. Ci, the ratio of autolysosome containing LDs to total LDs. The statistical analysis was performed using three independent replicates by ANOVA. LC3, microtubule-associated protein 1 light chain 3; TEM, transmission electron microscopy.
Figure 2
Figure 2
Knockdown of Atg8 and Orp8 blocked lipophagy.A, interference efficiency was detected by Western blotting. B, the colocalization of lysosomes and LDs in fat body cells after dsAtg8 injection. Lysosomes were stained with Lyso-Tracker (red), and LDs were stained with BODIPY (green). Yellow indicates examples of Lyso-Tracker-positive structures containing LDs. The ruler represents 50 μm. Bi, statistical analysis of autolysosome numbers in (B). C, the levels of triglycerides in the fat body after Atg8 knockdown. D, the location of ORP8 in fat body cells. Red fluorescence represents ORP8; green fluorescence represents LDs. The scale bar is 50 μm. E, the specificity of the ORP8 antibody in the fat body was analyzed by Western blotting. F, the expression of ORP8 was analyzed by Western blotting. G and Gi, the colocalization of LDs and lysosomes was detected after Orp8 knockdown. The ruler represents 50 μm. H, the levels of triglycerides in the fat body after Orp8 knockdown. I, phenotypes after dsOrp8 injection. Bars represent 1 cm. dsGfp was used as a control. J, statistical analysis of the phenotypes in (I). The pupation time was sixth instar 0 h larvae to pupae. K, the average weight of pupae and pupal phenotypes. L, percentage of different phenotypes from pupae to adults. The bars indicate the mean ± SD. p values and asterisks indicate differences by two-tailed Student's t test (∗p < 0.05, ∗∗p < 0.01). The different lowercase letters indicate significant differences in ANOVA (p < 0.05). LD, lipid droplet; ORP8, oxysterol-binding protein-related protein 8.
Figure 3
Figure 3
20E promoted the expression of Akh and Akhr via EcR.A, the expression profiles of Akh and Akhr in the epidermis, midgut, fat body, and brain were detected using qRT-PCR. 5F: fifth instar feeding larvae; 5M: fifth instar molting larvae; sixth-6 h to 120 h: sixth instar larvae at different stages; P2 d to P8 d: 2 to 8-day-old pupae. F: feeding; M: molting; MM: metamorphic molting; P: pupae. B, the expression of Akh and Akhr under stimulation with different concentrations of 20E for 12 h. C and D, knockdown of Ecr by dsEcr (2 μg/larva) followed by stimulation with 20E (500 ng/larva) for 12 h to detect the expression of Akh and Akhr. E, Western blotting showed the expression of the pAkh/pAkhr-LUC-GFP-His reporter plasmid (LUC-GFP-His) under overexpression of EcR or RFP with 20E or DMSO treatment. F, the fluorescence of the firefly (Fluc) represents reporting activity, and the fluorescence of renilla (Rluc) was used as an internal reference to eliminate background. G, ChIP assay showed that 20E promotes Akh expression via EcR binding to EcRE1 and EcRE2. The primers for EcRE are the sequences containing EcRE in the Akh promoter region, respectively. Primer Akh targeting the Akh coding DNA sequence (CDS) was used as a control. H, ChIP assays confirmed that 20E increases the binding of EcR to EcRE1 and EcRE2. The primers EcRE are the sequences containing EcRE in the Akhr promoter region. Primer Akhr targeting the Akhr coding DNA sequence (CDS) was used as a control. Data are the mean ± SD of three replicates. ∗p < 0.05, ∗∗p < 0.01 (two-tailed Student's t test). The comparison among multiple sets of data was performed by analysis of variance (ANOVA). The different lowercase letters show significant differences. 20E, 20-hydroxyecdysone; ChIP, chromatin immunoprecipitation; qRT-PCR, quantitative real-time reverse transcription PCR; DMSO, dimethyl sulfoxide.
Figure 4
Figure 4
AKH injection promoted fat body cell lipophagy and apoptosis.A, H&E staining showed fat body morphology. Nile red staining showed LDs. Samples were observed after the first injection (at sixth-72 h) of AKH (24 ng/larva = 100 nM) for 48 h and 96 h. PBS was used as a control. The rulers represent 20 μm in the H&E staining and 50 μm in Nile red. B, the colocalization of LC3 and LDs in fat body cells. BODIPY (5 μM for 30 min, green fluorescence) indicates LDs. LC3 indicates autophagosomes. CQ: chloroquine, 10 μM for 24 h. The ruler represents 50 μm. Bi, the relative red fluorescence intensity showed LC3 protein by immunofluorescence staining. C, the colocalization of lysosomes and LDs in fat body cells. Costaining with 50 nM Lyso-Tracker and 5 μM BODIPY (green) indicate the induction of lipophagy (yellow). The ruler represents 50 μm. Ci, statistical analysis of fat body cell lipophagy. D, TEM observation after injection with AKH in the fat body. The blue arrow shows that LD is entrapped in the lysosome. The bars represent 50 μm. LD: lipid droplet; PG: phagophore; AP: autophagosome; LY: lysosome; AL: autolysosome. Di, The ratio of autolysosome containing LDs to total LDs. E, Western blotting and statistical analysis showing LC3-II protein levels. CQ: chloroquine, 10 μM for 24 h. The samples were obtained 48 h after the first injection. F, CASP3 location in the fat body after AKH injection. Antibodies against CASP3 were used as the primary antibody, and antibodies against rabbit IgG Alexa Fluor 488 were used as the secondary antibody. Green fluorescence indicates CASP3, and blue fluorescence indicates nuclei are stained with DAPI. TUNEL staining shows apoptosis. The rulers represent 50 μm. Fi, the ratio of apoptotic cells (green) to total cells (blue). The red fluorescence intensity (tunnel signal) was counted by ImageJ. G, measurement of triglyceride levels in the fat body. The samples were obtained 48 h after the first injection. H, qRT-PCR showing the mRNA levels of lipase genes. I, Nile red staining showed fat body LDs after knockdown of Brummer or Lipase3. Images were observed after the first injection of dsRNA (sixth-6 h) for 72 h and 96 h. The scale bar represents 50 μm. J, qRT-PCR analysis of the mRNA levels of autophagy and apoptosis (PCD-related) genes. Statistical analysis was conducted using ANOVA or Student's t test. The different lowercase letters show significant differences. Asterisks denote significant differences (∗p < 0.05, ∗∗p < 0.01). AKH, adipokinetic hormone; LD, lipid droplet; LC3, microtubule-associated protein 1 light chain 3; PCD, programmed cell death; TEM, transmission electron microscopy; qRT-PCR, quantitative real-time reverse transcription PCR; DAPI, 4′,6-diamidino-2-phenylindole.
Figure 5
Figure 5
AKHR promoted lipophagy in fat body cells.A, H&E- and Nile red-stained fat body after the knockdown of Akhr. dsGfp was used as a control. Samples were taken 96 h or 144 h after the first injection (at sixth-6 h) of dsRNA (500 ng/larva, a total of four injections, 24 h apart). Red fluorescence indicates LDs, and blue fluorescence indicates nuclei. The rulers represent 20 μm in the H&E staining and 50 μm in the Nile red staining. B, the colocalization of LC3 (red) and LDs (green). The ruler represents 50 μm. Bi, quantification of the red fluorescence intensity of the LC3 protein. C, the colocalization of lysosomes (red fluorescence, 50 nM LysoTracker for 10 min) and LDs (green, 5 μM BODIPY for 30 min). The yellow color represents the colocalization of autolysosomes and LDs. The bars represent 50 μm. Ci, the ratio of autolysosomes in lipophagy. D, LC3-II levels were visualized by Western blotting with antibodies against LC3. CQ: chloroquine, 10 μM for 24 h. Samples were taken 96 h after the first injection of dsRNA. E, the CASP3 and TUNEL signals in the fat body after Akhr knockdown. Green fluorescence indicates CASP3 is detected by an antibody against CASP3. Blue fluorescence indicates nuclei are stained with DAPI. Red fluorescence indicates the TUNEL signal. Scale bar represents 25 μm. Ei, the ratio of apoptotic cells (green) to total cells (blue). The red fluorescence intensity (tunnel signal) was counted by ImageJ. F, measurement of triglyceride levels after Akhr knockdown in the fat body. G, qRT-PCR showed the mRNA levels of lipase and PCD-related genes. Error bars show the mean ± SD. The significant difference was calculated by Student's t test (∗p < 0.05; ∗∗p < 0.01) or one-way analysis of variance (ANOVA, p < 0.05). AKHR, adipokinetic hormone receptor; LD, lipid droplet; LC3, microtubule-associated protein 1 light chain 3; PCD, programmed cell death; qRT-PCR, quantitative real-time reverse transcription PCR; DAPI, 4′,6-diamidino-2-phenylindole.
Figure 6
Figure 6
Glucose promoted autophagy and apoptosis, as detected by autophagic flux and CASP3 activity.A, after glucose treatment, autophagic flux was detected in HaEpi cells, and PBS was used as the control. Green and red fluorescence indicate the autophagic flux from autophagosomes (red and green fluorescence) to autolysosomes (red fluorescence only). DAPI: nuclei stained as blue fluorescence. The yellow bars represent 20 μm. The orange arrows represent autophagosome puncta. The green arrows represent autolysosome puncta. Ai, the number of autophagosome puncta and autolysosome puncta in cells successfully transfected with pIEx-GFP-RFP-LC3 was counted. B, Western blotting showed the changes in LC3-II after treatment with different concentrations and times of glucose. CQ: chloroquine, 10 μM for 24 h. Bi, quantification of the data in (B). C, Western blotting showed the changes in p62 after treatment with different concentrations and times of glucose. CQ: chloroquine, 10 μM for 24 h. Ci, quantification of the data in (C). D, detection of cell apoptosis by CASP3 activity. Green fluorescence represents CASP3 activity, assessed using a CASP3 activity detection kit. Blue fluorescence indicates DAPI-stained nuclei. Merge: the superimposed images of the green and blue fluorescence. The scale bar represents 20 μm. Di, quantification of apoptotic cells in total cells in panel (D). All experiments were performed in triplicate, and statistical analysis was conducted using Student's t test (∗p < 0.05, ∗∗p < 0.01) or ANOVA (p < 0.05). The bars indicate the mean ± SD. DAPI, 4′,6-diamidino-2-phenylindole.
Figure 7
Figure 7
High glucose promoted the acetylation of FOXO for gene expression.A, qRT-PCR showed the mRNA levels of lipase and PCD-related genes after Foxo knockdown in HaEpi cells. Subsequently, 48 h after dsRNA (2 μg/well-six well plates) transfection, the cells were treated with glucose. Samples were taken 12 h after glucose treatment. B, the mRNA levels of lipase and PCD-related genes after overexpression of FOXO-GFP in HaEpi cells were analyzed by qRT-PCR. Forty-eight hours after FOXO-GFP plasmid (5 μg/well-six well plate) transfection, the cells were treated with glucose. Samples were taken 12 h after glucose treatment. C, localization of FOXO in HaEpi cells. Green shows that the FOXO protein is stained with an anti-FOXO antibody and a secondary antibody labeled with Alexa Fluor 488. Blue shows nuclei stained with DAPI. The ruler represents 20 μm. D, Western blotting showed the subcellular distribution and acetylation of FOXO. The gel concentration of SDS‒PAGE was 7.5%. Nu: nucleus, Cy: cytoplasm. Di, quantification of FOXO or Ac-FOXO in the nucleus or cytoplasm in total FOXO protein according to three independent replicates using ImageJ software. E, Western blotting showed the acetylation of FOXO after Hat knockdown. The protein band density was quantified by ImageJ. F, the acetylation intensity of FOXO in the fat body at sixth-24 h and sixth-96 h. Western blotting was quantified by ImageJ. G, the acetylation intensity of FOXO in the fat body treated with different concentrations of AKH (24 ng/larva), dsAkhr (500 ng/larva), glucose (200 μg/larva), and MH (40 μg/larva). Western blotting was quantified by ImageJ. H, qRT-PCR showed the mRNA levels of lipase and PCD-related genes after Foxo knockdown. Samples were taken 12 h after the third injection. Then, 500 ng dsRNA per sixth-72 h larva was administered three times at a 24 h interval. I, the association of LDs with LC3 demonstrated lipophagy processes. Images were collected 24 h after the first injection of dsRNA. The ruler represents 50 μm. Ii, statistical analysis of LC3 fluorescence intensity in (I). J, the association of LDs with lysosomes demonstrated lipophagy processes. Images were collected 48 h after the first injection of dsRNA. The ruler represents 50 μm. Ji, statistical analysis of autolysosome numbers in (J). The statistical analysis was performed using three independent replicates by Student's t test or ANOVA (p < 0.05). Asterisks denote significant differences (∗p < 0.05, ∗∗p < 0.01). The bars indicate the mean ± SD. LD, lipid droplet; LC3, microtubule-associated protein 1 light chain 3; FOXO, forkhead box O; MH, metformin hydrochloride; PCD, programmed cell death; qRT-PCR, quantitative real-time reverse transcription PCR; DAPI, 4′,6-diamidino-2-phenylindole.
Figure 8
Figure 8
Chart illustrating the mechanisms by which the steroid hormone 20E promotes lipophagy by elevating glucose levels. 20E promotes the transcription of Akh and Akhr via EcR (1). AKH via AKHR to increase the expression of gluconeogenesis-related genes to increase glucose levels (2). High glucose induces FOXO acetylation and nuclear localization, promotes gene expression, and then promotes lipophagy and apoptosis (3). 20E, 20-hydroxyecdysone; AKH, adipokinetic hormone; AKHR, AKH receptor; FOXO, forkhead box O.

Similar articles

References

    1. Janah L., Kjeldsen S., Galsgaard K.D., Winther-Sorensen M., Stojanovska E., Pedersen J., et al. Glucagon receptor signaling and glucagon resistance. Int. J. Mol. Sci. 2019;20:3314. - PMC - PubMed
    1. Rui L. Energy metabolism in the liver. Compr. Physiol. 2014;4:177–197. - PMC - PubMed
    1. Han H.S., Kang G., Kim J.S., Choi B.H., Koo S.H. Regulation of glucose metabolism from a liver-centric perspective. Exp. Mol. Med. 2016;48:e218. - PMC - PubMed
    1. Raju B., Cryer P.E. Maintenance of the postabsorptive plasma glucose concentration: insulin or insulin plus glucagon? Am. J. Physiol. Endocrinol. Metab. 2005;289:E181–E186. - PubMed
    1. Perry R.J., Zhang D., Guerra M.T., Brill A.L., Goedeke L., Nasiri A.R., et al. Glucagon stimulates gluconeogenesis by INSP3R1-mediated hepatic lipolysis. Nature. 2020;579:279–283. - PMC - PubMed

MeSH terms

LinkOut - more resources