. 2025 Jan 11;16(1):598.
doi: 10.1038/s41467-025-55939-2.

Inhibited peroxidase activity of peroxiredoxin 1 by palmitic acid exacerbates nonalcoholic steatohepatitis in male mice

Affiliations

Inhibited peroxidase activity of peroxiredoxin 1 by palmitic acid exacerbates nonalcoholic steatohepatitis in male mice

Wen Yin et al. Nat Commun. .

Abstract

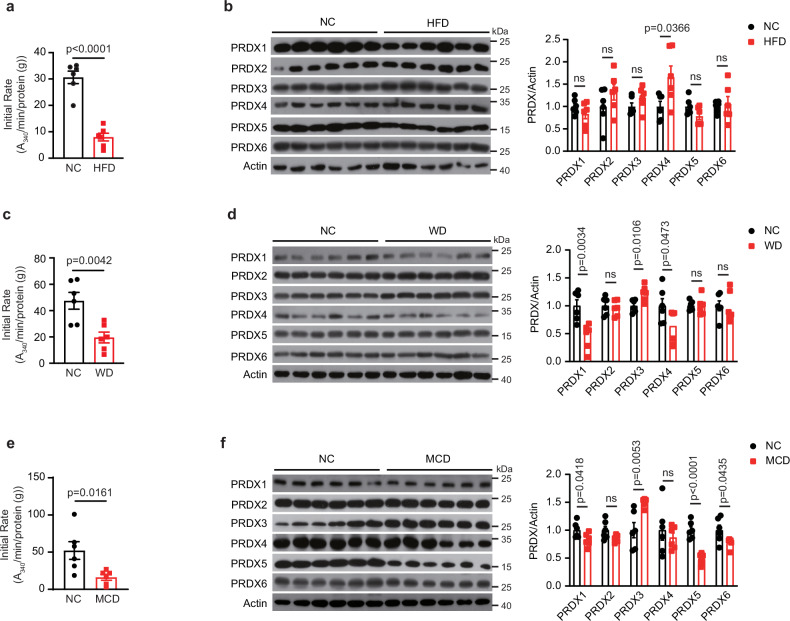
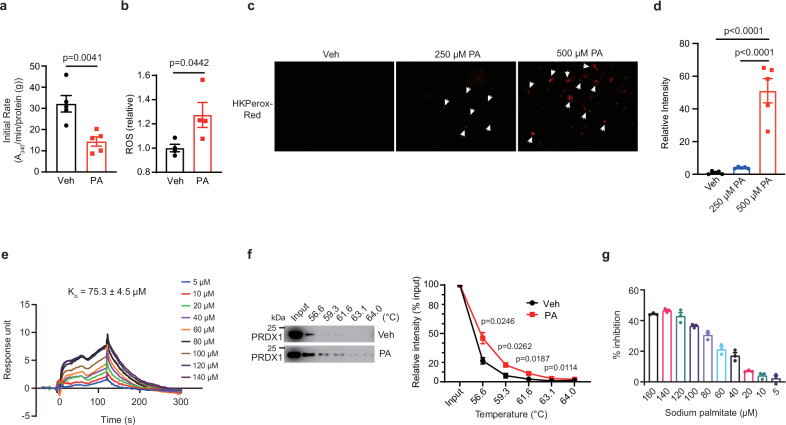
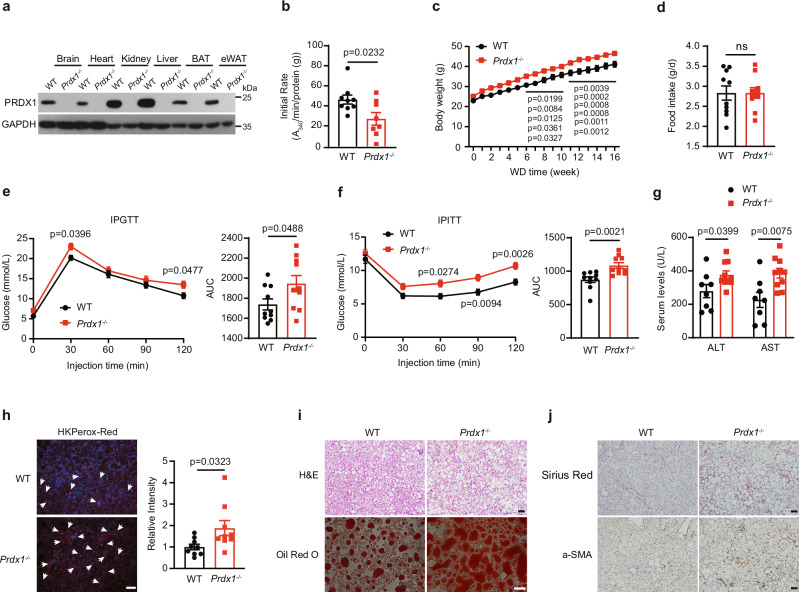
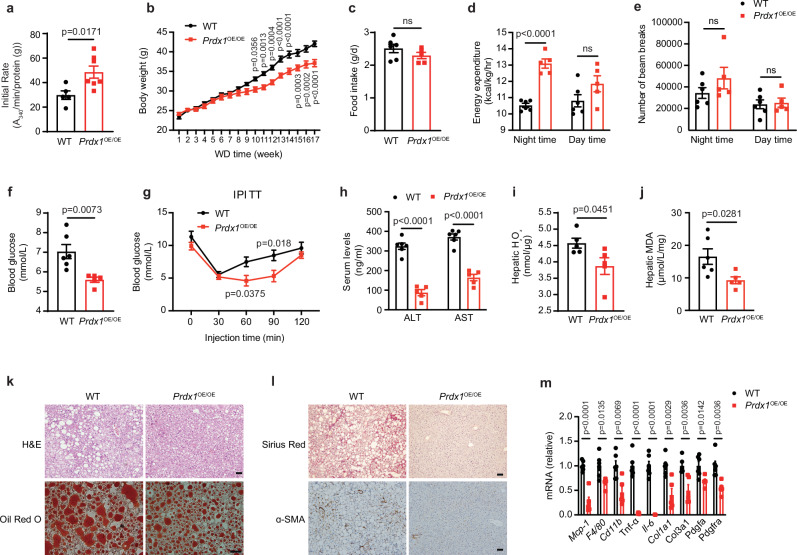
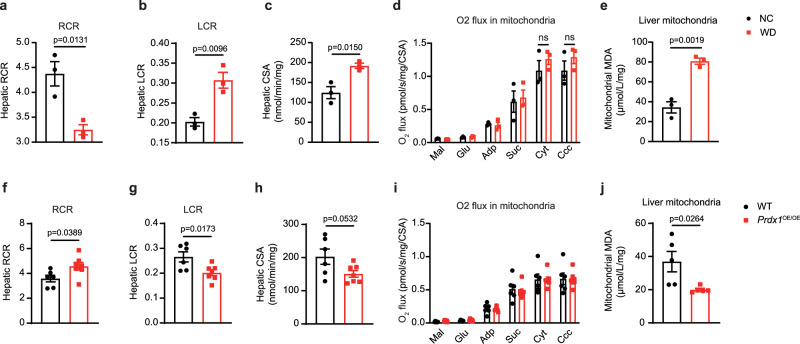
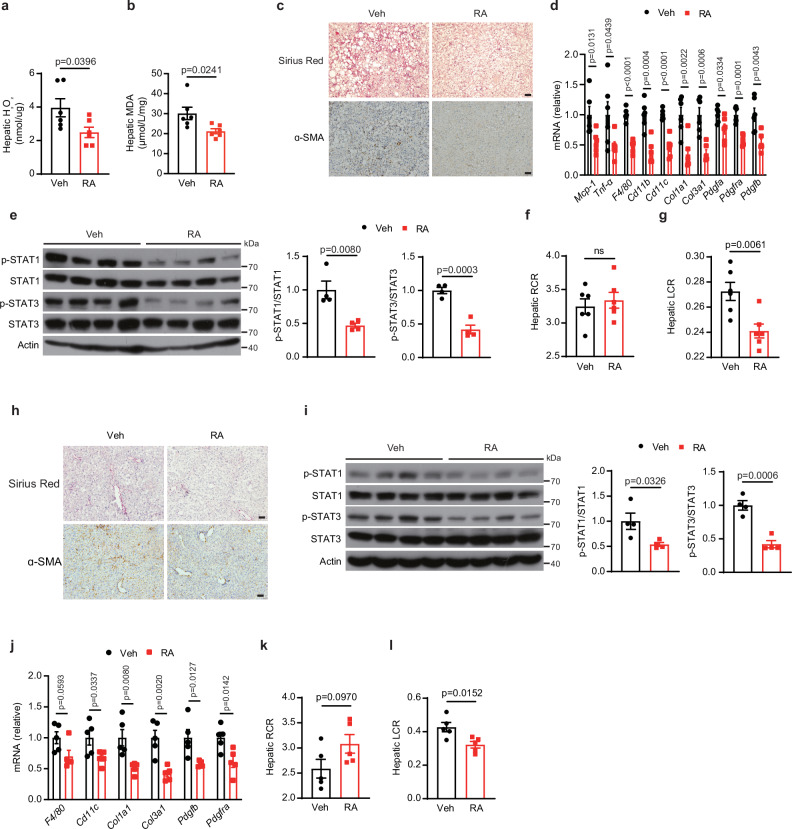
Reactive oxygen species exacerbate nonalcoholic steatohepatitis (NASH) by oxidizing macromolecules; yet how they promote NASH remains poorly understood. Here, we show that peroxidase activity of global hepatic peroxiredoxin (PRDX) is significantly decreased in NASH, and palmitic acid (PA) binds to PRDX1 and inhibits its peroxidase activity. Using three genetic models, we demonstrate that hepatic PRDX1 protects against NASH in male mice. Mechanistically, PRDX1 suppresses STAT signaling and protects mitochondrial function by scavenging hydrogen peroxide, and mitigating the oxidation of protein tyrosine phosphatases and lipid peroxidation. We further identify rosmarinic acid (RA) as a potent agonist of PRDX1. As revealed by the complex crystal structure, RA binds to PRDX1 and stabilizes its peroxidatic cysteine. RA alleviates NASH through specifically activating PRDX1's peroxidase activity. Thus, beyond revealing the molecular mechanism underlying PA promoting oxidative stress and NASH, our study suggests that boosting PRDX1's peroxidase activity is a promising intervention for treating NASH.


Conflict of interest statement

Competing interests: The authors declare no competing interests.

Figures

Fig. 1
Fig. 1. Decreased peroxidase activity of global hepatic PRDX in NASH.
a Peroxidase activity of global hepatic PRDX after normal chow (NC) or high-fat diet (HFD) feeding. 8-week-old male C57BL/6 mice were fed a NC or HFD for 18 weeks and liver samples were collected for biochemical analyses. Global hepatic PRDX peroxidase activity was measured using a classic Trx-TrxR-NADPH coupled assay. NADPH consumption was monitored via absorbance at 340 nm (A340) in 15 min assay duration. Meanwhile, the background activity was assessed without Trx and TrxR, but only with H2O2 and NADPH. To calculate the initial NADPH consumption rate (initial rate) (A340/min/protein (g)) in the first 5 min, a smooth curve was drawn through A340 readings, and the initial rate was calculated by performing a simple linear regression. Global PRDX peroxidase activity was calculated by subtracting the background activity (initial rate) from total activity (initial rate). n = 6 mice per group. b Protein levels of hepatic PRDX family enzymes after HFD (as in a) and quantitation. n = 6 mice per group; ns, no significance. c Peroxidase activity of global hepatic PRDX after NC or western diet (WD). 8-week-old male C57BL/6 mice were fed a NC or WD for 20 weeks and global hepatic PRDX peroxidase activity was measured using a classic Trx-TrxR-NADPH coupled assay. n = 6 mice per group. d Protein levels of hepatic PRDX family enzymes after NC or WD feeding (as in c) and quantitation. n = 6 mice per group; ns, no significance. e Peroxidase activity of global hepatic PRDX after NC or methionine and choline deficient diet (MCD). 8-week-old male C57BL/6 mice were fed a NC or MCD for 5 weeks and global hepatic PRDX peroxidase activity was measured using a classic Trx-TrxR-NADPH coupled assay. n = 6 mice per group. f Protein levels of hepatic PRDX family enzymes after NC or MCD feeding (as in e) and quantitation. n = 6 mice per group; ns, no significance. All data are presented as means ± SEM. Unpaired and two-tailed Student’s t test was performed for af.
Fig. 2
Fig. 2. PA binds to PRDX1 and inhibits its peroxidase activity.
a Global PRDX peroxidase activity in HepG2 cells after PA (250 μM) treatment for 1 hr. Veh, vehicle. PA, palmitic acid. n = 5 biologically independent samples. b ROS levels in HepG2 cells after PA treatment for 1 hr. Intracellular ROS were monitored by measuring the fluorescent intensity of dichlorofluorescin (DCF) using a fluorometer. n = 4 independent experiments. c Representative images of HKPerox-Red staining in HepG2 cells after treatment with Veh or PA at different concentrations for 1 hr. Arrows denote the signals of HKPerox-Red staining. n = 5 independent experiments. Scale bar, 50 μm. d Quantification of fluorescence intensity of images from c. n = 5 independent experiments. e Binding affinity of sodium palmitate on recombinant PRDX1 determined by SPR assay. Data were calculated from three independent experiments. f Representative images showing the increased thermal stabilization of PRDX1 after binding to PA and quantification. n = 3 independent experiments. HepG2 cells were treated with PA (250 μM) for 1 hr and then the cell lysate was collected for the thermal shift assay. In brief, the cell lysate was divided into six aliquots. One aliquot was used for input control and the other five aliquots were heated at different temperatures as indicated for 3 min. Finally, western blotting was carried out to detect PRDX1 stability. g Inhibition of recombinant WT PRDX1’s peroxidase activity by sodium palmitate at different concentrations as indicated. For more details, please see methods section. Data were calculated from three independent experiments. All the data are presented as means ± SEM. Unpaired and two-tailed Student’s t test was performed for a, b, d, and f.
Fig. 3
Fig. 3. PRDX1 knockout increases NASH and liver fibrosis.
a Representative images validating the efficiency of PRDX1 knockout in Prdx1-/- mice. This experiment was repeated for three times independently. b Peroxidase activity of global hepatic PRDX in WT and Prdx1-/- mice. WT mice (n = 9); Prdx1-/- mice (n = 8). c Body weight of WT and Prdx1-/- mice on WD. 8-week-old male mice were fed a WD for 20 weeks and their weekly body weights were monitored. n = 10 mice per group. d Daily food intake of mice on WD (as in c). n = 10 mice per group; ns, no significance. e Intraperitoneal glucose tolerance test (IPGTT) in mice on WD (as in c) and area under the curve (AUC). n = 10 mice per group. f Intraperitoneal insulin tolerance test (IPITT) in mice on WD (as in c) and AUC. n = 10 mice per group. g Circulating ALT and AST levels (as in c). WT mice (n = 8); Prdx1-/- mice (n = 10). h Representative images of HKperox-Red staining in the liver and quantitative analysis (as in c). Arrows denote the signals of HKPerox-Red staining. Scale bar, 50 μm. n = 9 images from three mice per group. i Representative images showing H&E and Oil Red O staining in the liver after WD (as in c). n = 3 biologically independent mice. Scale bars, 50 μm. j Representative images showing Sirius Red and α-SMA staining in the liver (as in c). n = 3 biologically independent mice. Scale bars, 50 μm. All data are presented as means ± SEM. Unpaired and two-tailed Student’s t test was performed for b, d, AUC of e, AUC of f, g, and h. Two-way ANOVA followed by Bonferroni’s test for multiple comparisons was performed for c, e, and f.
Fig. 4
Fig. 4. PRDX1 overexpression ameliorates NASH and liver fibrosis.
a Peroxidase activity of global hepatic PRDX in WT and Prdx1OE/OE mice. WT mice (n = 5); Prdx1OE/OE mice (n = 7). b Body weight of WT and Prdx1OE/OE mice on WD. 8-week-old male mice were fed a WD and their body weights were monitored weekly. WT mice (n = 6); Prdx1OE/OE mice (n = 5). c Daily food intake of mice on WD (as in b). WT mice (n = 6); Prdx1OE/OE mice (n = 5). ns, no significance. d Energy expenditure (kcal) of mice on WD (as in b). WT mice (n = 6); Prdx1OE/OE mice (n = 5). e Locomotion activity of mice on WD (as in b). WT mice (n = 6); Prdx1OE/OE mice (n = 5). ns, no significance. f Fasting blood glucose levels of mice on WD (as in b). WT mice (n = 6); Prdx1OE/OE mice (n = 5). g IPITT in mice on WD (as in b). WT mice (n = 6); Prdx1OE/OE mice (n = 5). h Serum ALT and AST levels in mice on WD (as in b). WT mice (n = 6); Prdx1OE/OE mice (n = 5). i Hepatic H2O2 levels in WD-fed mice (as in b). n = 5 mice per group. j Hepatic MDA levels in WD-fed WT and Prdx1OE/OE mice (as in b). WT mice (n = 6); Prdx1OE/OE mice (n = 5). k Representative images showing H&E and Oil Red O staining of liver after WD (as in b). n = 3 biologically independent mice. Scale bars, 50 μm. l Representative images from three mice per group showing Sirius Red and α-SMA staining of liver after WD (as in b). n = 3 biologically independent mice. Scale bars, 50 μm. m mRNA expression of hepatic genes after WD (as in b). WT mice (n = 6); Prdx1OE/OE mice (n = 5). All the data are presented as means ± SEM. Unpaired and two-tailed Student’s t test was performed for a, c, d, e, f, h, i, j, and m. Two-way ANOVA followed by Bonferroni’s test for multiple comparisons was performed for b and g.
Fig. 5
Fig. 5. PRDX1 suppresses hepatic STAT1 and STAT3 phosphorylation.
a Western blotting of the oxidation of hepatic protein tyrosine phosphatases (PTPs) in WT mice after NC or WD for 20 weeks. n = 4 mice per group. b Western blotting of the oxidation of hepatic PTPs in WT mice after NC or MCD for 2 weeks. n = 4 mice per group. c Western blotting and quantitation of hepatic STAT1 and STAT3 phosphorylation (as in a). n = 4 mice per group. d Western blotting and quantitation of hepatic STAT1 and STAT3 phosphorylation (as in b). n = 4 mice per group. e Western blotting and quantitation of hepatic STAT1 and STAT3 phosphorylation in MCD-fed WT and Prdx1-/- mice. n = 4 mice per group. f Western blotting and quantitation of hepatic STAT1 and STAT3 phosphorylation in WD-fed WT and Alb-Cre;Prdx1fl/fl mice. n = 3 mice per group. g Western blotting and quantitation of hepatic STAT1 and STAT3 phosphorylation in WD-fed WT and Prdx1OE/OE mice. n = 4 mice per group. All the data are presented as means ± SEM. Unpaired and two-tailed Student’s t test was performed for cg.
Fig. 6
Fig. 6. PRDX1 protects liver mitochondrial function.
a Hepatic respiratory control ratio (RCR) of mice on NC or WD. 8-week-old male C57BL/6 mice were fed a NC or WD for 20 weeks before their liver mitochondria were isolated for O2k analyses. n = 3 mice per group. b Hepatic leaking control ratio (LCR) (as in a). n = 3 mice per group. c Hepatic citrate synthase activity (CSA) (as in a). n = 3 mice per group. d O2 flux in isolated liver mitochondria (as in a). n = 3 mice per group; ns, no significance. Mal, malate; Glu, glutamate; Suc, succinate; Cyt, cytochrome c; Ccc, cccp. ns, no significance by unpaired Student’s t test. e MDA concentration in the liver mitochondria isolated from mice after NC or WD (as in a). n = 3 mice per group. f Hepatic RCR of WT and Prdx1OE/OE mice. 8-week-old male WT and Prdx1OE/OE mice were fed a WD for 20 weeks before their liver mitochondria were isolated for O2k analyses. WT mice (n = 6); Prdx1OE/OE mice (n = 7). g Hepatic LCR (as in f). WT mice (n = 6); Prdx1OE/OE mice (n = 7). h Hepatic CSA (as in f). WT mice (n = 6); Prdx1OE/OE mice (n = 7). i O2 flux in isolated liver mitochondria (as in f). WT mice (n = 6); Prdx1OE/OE mice (n = 7). j MDA concentration in the liver mitochondria isolated from WT and Prdx1OE/OE mice after WD. n = 5 mice per group. All the data are presented as means ± SEM. Unpaired and two-tailed Student’s t test was performed for aj.
Fig. 7
Fig. 7. Identification of rosmarinic acid as an agonist of PRDX1.
a Identification of rosmarinic acid (RA) as a potential agonist of PRDX1. Protein thermal shift assay (PTS) was used to identify 6 hits and RA shows the highest efficacy in activating PRDX1’s peroxidase activity as reflected by in vitro peroxidase activity assay. For more details, please see the Methods section. Hits are marked as red dots, while others are shown as black dots. Blue dashed lines represent the same positive values of ΔTmD and ΔTmB. ΔTmD, derivative delta melting temperature; ΔTmB, Boltzmann delta melting temperature; LA, lawsone; MO, morine; SB, Salvianolic acid B; EG, Epigallocatechin Gallate; PH, Phloracetophenone. b Half maximal concentration of RA for activating WT PRDX1’s peroxidase activity. For a and b, data are presented as means ± SEM from three independent experiments. c Binding affinity of RA with WT PRDX1 by SPR assay. The dissociation constant (KD) is shown as means ± SEM from duplicate experiments. d Unbiased FO-FC density map contoured at 2.5σ of RA in RA-PRDX1C52SC83S (aa1-175) complex structure. RA is shown in yellow stick. Maps are shown in blue nets. e 2FO-FC density map of RA and neighboring residues of PRDX1 in RA- PRDX1C52SC83S (aa 1-175) complex structure. RA is shown in yellow stick. Maps are shown in gray nets. Waters are shown in red spheres. Chain A and chain B are shown in green and navy cartoon, respectively. Residues near RA are also shown as sticks. f Complex crystal structure showing that RA binds at the peroxidatic site of PRDX1C52SC83S (aa 1-175). The peroxidatic site is highlighted in salmon stick. RA, Chain A and Chain B are shown as in (e). g Electrostatic potential of RA-PRDX1 C52SC83S (aa 1-175) complex crystal structure and RA binding site. The interior of RA’s binding site is electronegative (colored in blue), while the exterior is electropositive (colored in red). h Hydrogen bond network formed between RA and residues in the binding pocket. Residues around 5 Å of RA are shown in stick. Waters are shown in red spheres. Hydrogen bonds are shown in magenta dashed lines.
Fig. 8
Fig. 8. RA treatment alleviates NASH and liver fibrosis.
a Hepatic H2O2 levels in WT mice treated with WD and RA or vehicle. 8-week-old male WT mice were fed a WD and concurrently received a daily intraperitoneal injection of either vehicle or RA (30 mg/kg) for 20 weeks. n = 6 mice per group. b Hepatic lipid peroxidation (as in a). MDA levels were measured using a lipid peroxidation MDA assay kit. n = 6 mice per group. c Representative images from three mice per group showing Sirius Red and α-SMA staining of liver (as in a). n = 3 biologically independent mice. Scale bars, 50 μm. d mRNA expression of hepatic genes (as in a). n = 6 mice per group. e Western blotting and quantitation of hepatic STAT1 and STAT3 phosphorylation (as in a). n = 4 mice per group. f Hepatic RCR. 8-week-old male WT mice were fed a WD and concurrently received a daily intraperitoneal injection of either vehicle or RA (30 mg/kg) for 20 weeks before liver mitochondria were isolated for O2k analyses. n = 6 mice per group. ns, no significance. g Hepatic LCR (as in f). n = 6 mice per group. h Representative images showing Sirius Red and α-SMA staining in the liver. 8-week-old male WT mice were fed a MCD and concurrently received a daily intraperitoneal injection of vehicle or RA (30 mg/kg) for two weeks. n = 3 biologically independent mice. Scale bars, 50 μm. i Western blotting and quantitation of hepatic STAT1 and STAT3 phosphorylation (as in h). n = 4 mice per group. j mRNA expression of hepatic genes (as in h). n = 5 mice per group. k Hepatic RCR. 8-week-old male WT mice were fed a MCD and concurrently received a daily intraperitoneal injection of vehicle or RA for two weeks before their liver mitochondria were isolated for O2k analyses. n = 5 mice per group. l Hepatic LCR (as in k). n = 5 mice per group. All the data are presented as means ± SEM. Unpaired and two-tailed Student’s t test was performed for al, except c and h.

References

    1. Birkenfeld, A. L. & Shulman, G. I. Nonalcoholic fatty liver disease, hepatic insulin resistance, and type 2 diabetes. Hepatology59, 713–723 (2014). - DOI - PMC - PubMed
    1. Younossi, Z. M. et al. Global epidemiology of nonalcoholic fatty liver disease-Meta-analytic assessment of prevalence, incidence, and outcomes. Hepatology64, 73–84 (2016). - DOI - PubMed
    1. Loomba, R., Friedman, S. L. & Shulman, G. I. Mechanisms and disease consequences of nonalcoholic fatty liver disease. Cell184, 2537–2564 (2021). - DOI - PMC - PubMed
    1. Ferguson, D. & Finck, B. N. Emerging therapeutic approaches for the treatment of NAFLD and type 2 diabetes mellitus. Nat. Rev. Endocrinol.17, 484–495 (2021). - DOI - PMC - PubMed
    1. Targher, G., Corey, K. E., Byrne, C. D. & Roden, M. The complex link between NAFLD and type 2 diabetes mellitus - mechanisms and treatments. Nat. Rev. Gastroenterol. Hepatol.18, 599–612 (2021). - DOI - PubMed

MeSH terms