. 2025 Jan 11;16(1):600.
doi: 10.1038/s41467-025-55882-2.

A membrane-targeted photoswitch restores physiological ON/OFF responses to light in the degenerate retina

Affiliations

A membrane-targeted photoswitch restores physiological ON/OFF responses to light in the degenerate retina

Gaia Ziraldo et al. Nat Commun. .

Abstract

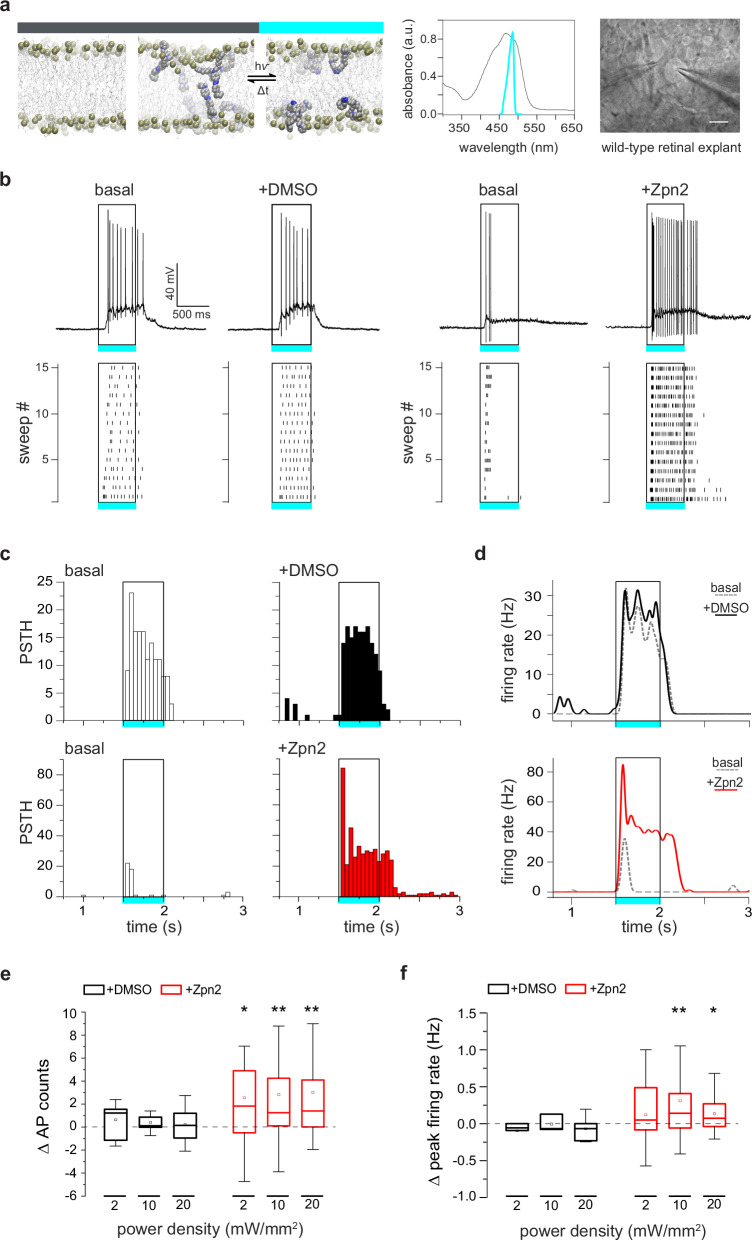
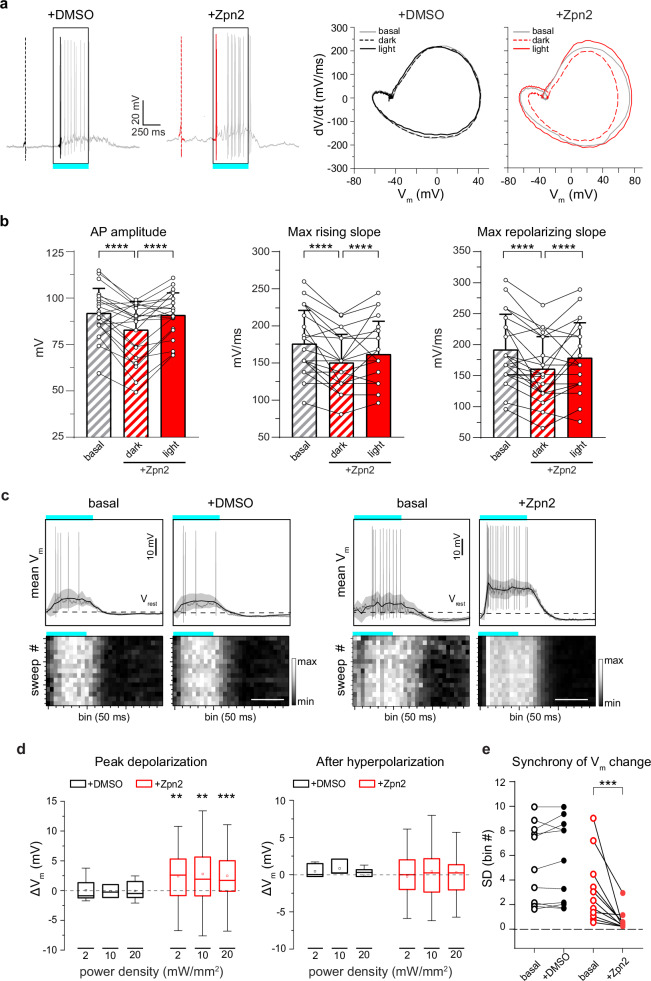
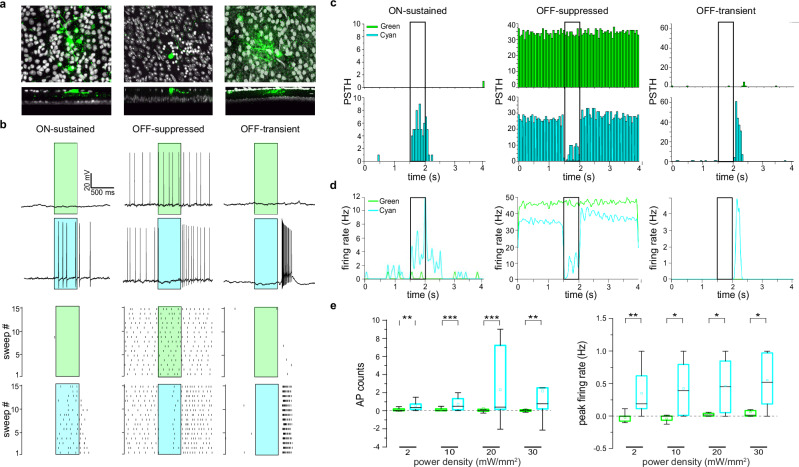
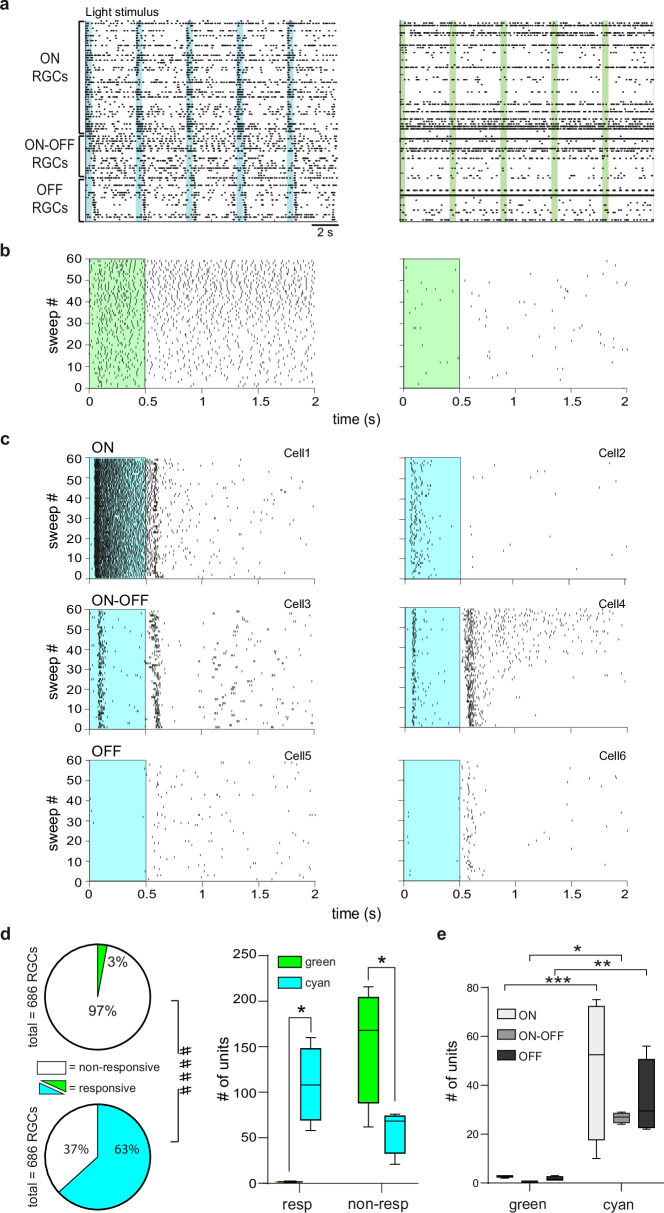
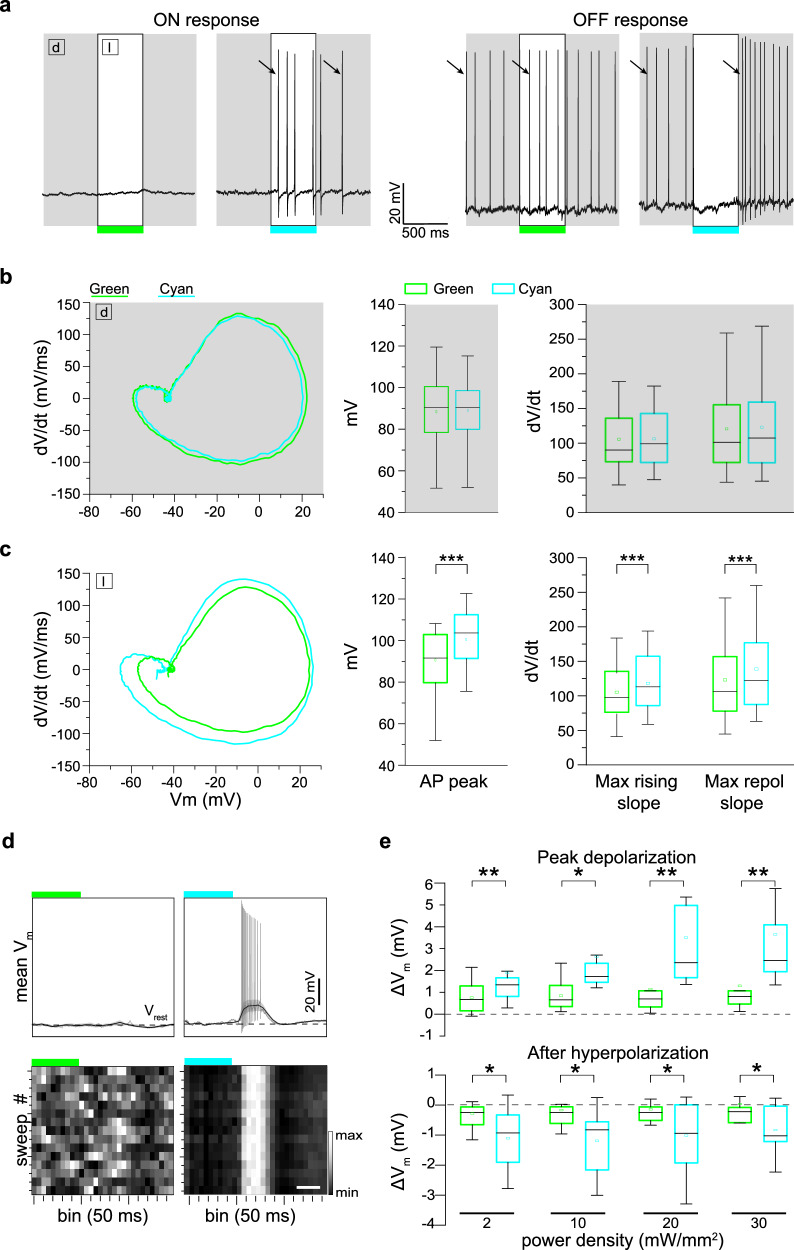
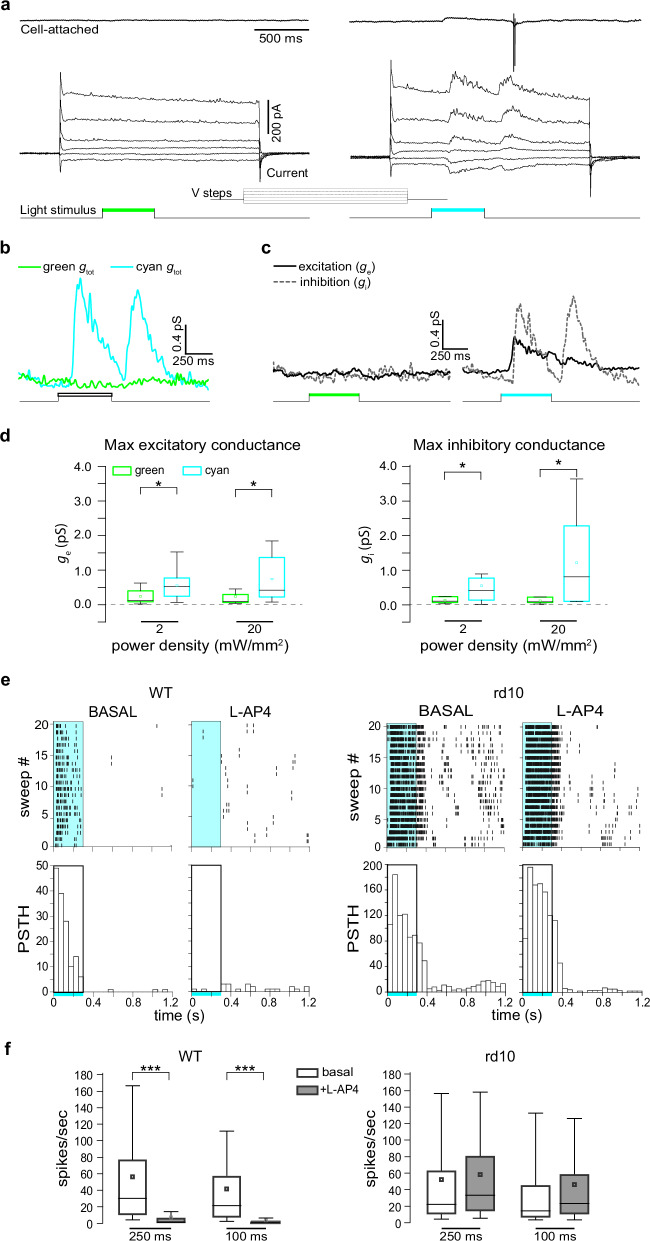
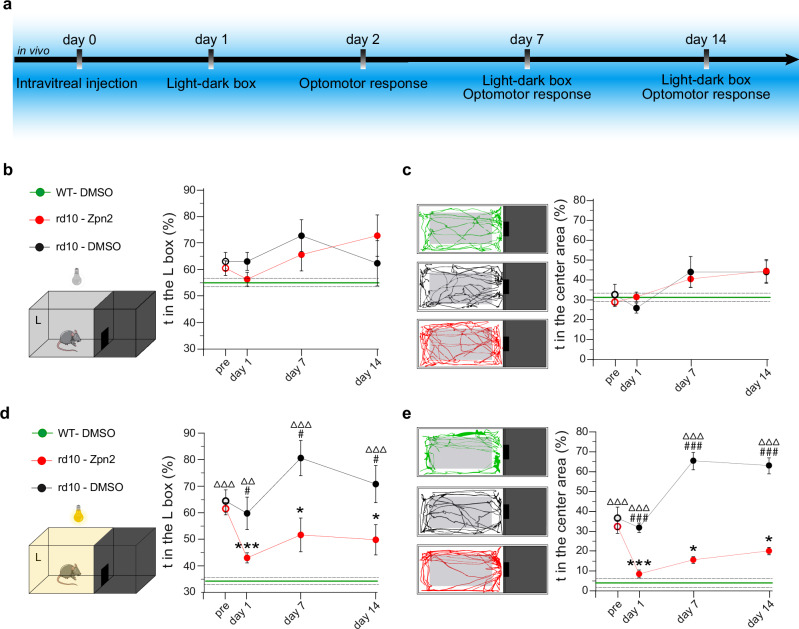
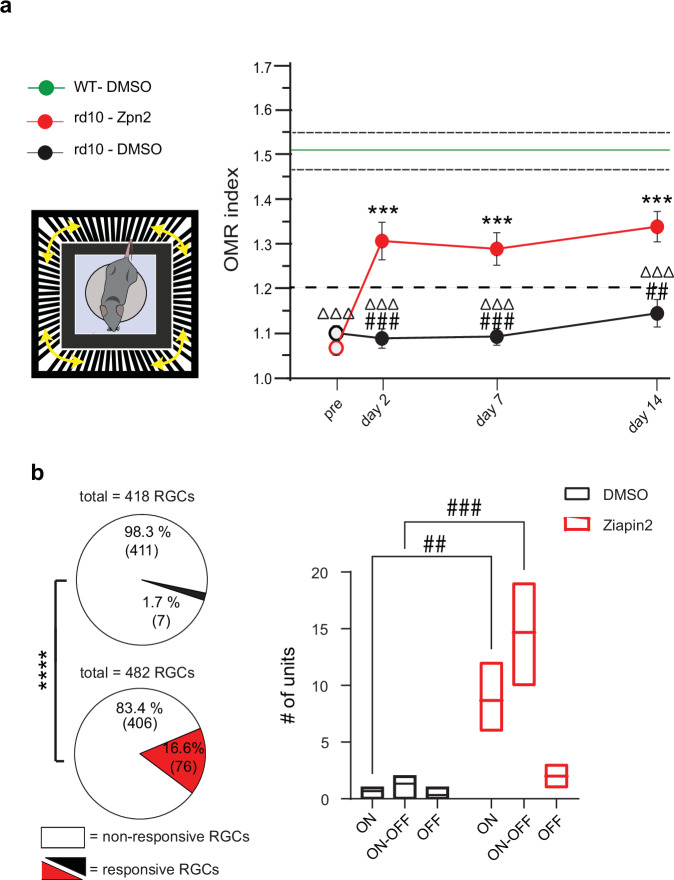
The lack of effective therapies for visual restoration in Retinitis pigmentosa and macular degeneration has led to the development of new strategies, such as optogenetics and retinal prostheses. However, visual restoration is poor due to the massive light-evoked activation of retinal neurons, regardless of the segregation of visual information in ON and OFF channels, which is essential for contrast sensitivity and spatial resolution. Here, we show that Ziapin2, a membrane photoswitch that modulates neuronal capacitance and excitability in a light-dependent manner, is capable of reinstating, in mouse and rat genetic models of photoreceptor degeneration, brisk and sluggish ON, OFF, and ON-OFF responses in retinal ganglion cells evoked by full-field stimuli, with reactivation of their excitatory and inhibitory conductances. Intravitreally injected Ziapin2 in fully blind rd10 mice restores light-driven behavior and optomotor reflexes. The results indicate that Ziapin2 is a promising molecule for reinstating physiological visual responses in the late stages of retinal degeneration.


Conflict of interest statement

Competing interests: C.B., V.S., G.L., and F.B. are among the inventors of the patent application “Photochromic compounds” (PCT/IB2019/054530). The remaining authors declare no competing interests. Inclusion and Ethics: The Authors followed the recommendations of the “Global Code of Conduct” when designing, executing, and reporting their research.

Figures

Fig. 1
Fig. 1. Ziapin2 enhances light-evoked RGC firing activity in the WT retina.
a Left: Molecular structure of Ziapin2 and its topology after spontaneous membrane insertion: Ziapin2 incorporates into a phospholipid bilayer (left) in the dark and self-associates as trans-isomers on opposite leaflets (middle), causing membrane shrinking, which is reversed by cyan light-induced conversion to the cis conformation (right). Modified from. Middle: Ziapin2 UV–vis absorption spectrum in DMSO (black trace; absorption peak, 470 nm), superimposed to the spectral output of the cyan LED used in the study. Right: Image of an RGC with a puff pipette (left) for the application of Ziapin2 and a patch pipette(right). Scale bar, 20 µm. b Representative current-clamp traces (top) and corresponding raster plots (bottom; 15 sweeps) recorded in two distinct RGCs from WT mouse retinal explants before (basal) and after the administration of either vehicle (10% v/v DMSO) or Ziapin2 (200 µM), showing an enhancement of light-evoked AP firing upon stimulation with cyan light (500 ms, 20 mW/mm2; open rectangle) of the Ziapin2-treated neuron. c Representative peristimulus time histograms (PSTHs) of the two RGCs as in (b), showing AP counts (50-ms bins) in response to cyan-light stimulation before (basal, open columns) and after the administration of either DMSO (top row, black columns) or Ziapin2 (bottom row, red columns). Rectangles frame the responses during the cyan light stimulus (500 ms, 20 mW/mm2). d Changes in the firing rate of the two RGCs shown in (b) under basal conditions (dashed gray lines) and after the subsequent application of either DMSO (top, black line) or Ziapin2 (bottom, red line). The timing of the cyan-light stimulus (500 ms, 20 mW/mm2) is represented by the open rectangle. e, f Box plots representing the cyan light-evoked changes in AP counts (e) and peak firing rates (f) with respect to the basal condition at increasing power densities (2, 10, and 20 mW/mm2) after the application of either DMSO (black boxes) or Ziapin2 (red boxes). Changes are expressed as the difference (Δ) between Ziapin2/DMSO puff application and the basal condition. The box plot center line represents the mean, the square inside indicates the median, box boundaries show the first and third quartiles, and whiskers display the minimum and maximum values. *p < 0.05, **p < 0.01; two-tailed paired Wilcoxon’s signed-rank test versus basal (n = 12 and 34 RGCs for DMSO and Ziapin2, respectively). Exact p-values and source data are provided as a Source Data file.
Fig. 2
Fig. 2. The light-evoked capacitance change by Ziapin2 induces faster AP dynamics and membrane depolarization in the WT retina.
a Left: Representative whole-cell current-clamp traces recorded in two RGCs in the presence of either vehicle (10% v/v DMSO; left, black) or Ziapin2 (200 µM; right, red) showing the first spike in the dark (dashed line) and the first light-evoked spike (solid line). Right: Phase-plane plot analysis of the waveform of the first APs in the dark (dashed lines) and during cyan light stimulation (solid line; 20 mW/mm2, 500 ms) after puff application of either DMSO (black) or Ziapin2 (red), compared to the AP waveform in the dark under basal conditions (gray lines). b Changes in AP amplitude (left), maximal rising slope (middle), and maximal repolarizing slope (right) deduced from the phase-plane plot analysis of each recorded RGC before (basal) and after Ziapin2 application in the dark and under cyan light stimulation. Bars represent means ± SEM with superimposed individual points (n = 22 RGCs). c Top: Representative lowpass-filtered voltage traces recorded from RGCs before (basal) and after treatment with either vehicle (10% v/v DMSO; left), or Ziapin2 (200 µM; right) in a time window of 1.5 s, starting from the onset of the light stimulation (500 ms, cyan horizontal bar). The plots display the mean (± SD, gray area) Vm calculated within the same time window over 15 sweeps. Vrest (dashed line), membrane potential in the dark. APs are superimposed on the voltage traces. Bottom: Grayscale representation of Vm changes during the 15 sweeps (50-ms bins). Scale bars, 500 ms. d Box plots of peak depolarization (left) and peak after-hyperpolarization (right) calculated as the difference with respect to Vrest (see c) in RGCs treated with either vehicle (10% v/v DMSO; black) or Ziapin2 (200 µM; red) and stimulated with cyan light at increasing power densities (2, 10, and 20 mW/mm2; n = 12 and 34 for DMSO and Ziapin2 puffs, respectively). The box plot center line represents the mean, the square in the box is the median, box boundaries show the first and third quartiles, and whiskers display the minimum and maximum values. e Evaluation of the synchrony of voltage changes in response to cyan light before (basal) and after Ziapin2 or DMSO puff application (n = 10 and 11 RGCs for DMSO and Ziapin2 puffs, respectively). **p < 0.01, ***p < 0.001, ****p < 0.0001; two-tailed paired Wilcoxon’s signed-rank versus basal. Exact p-values and source data are provided as a Source Data file.
Fig. 3
Fig. 3. Ziapin2 restores physiological responses to light in RGCs from degenerate rd10 retinas.
a Top: Morphological reconstructions of the RGCs recorded in (b) filled with Alexa Fluor 633 (green). Bottom: Transversal sections of the same Z-projections, showing the dendritic tree of the recorded RGCs in distinct IPL sublaminae. The morphology and dendritic stratification of the three RGCs correspond to their ON-sustained (left), OFF-suppressed (middle), and OFF-transient (right) physiological responses to light. b Top: Representative responses of the RGCs shown in (a) to full-field illumination with either green or cyan light (500 ms; 20 mW/mm2) after incubation of the blind retinal explants in the presence of Ziapin2 (10 µM). No light-dependent firing activity was detected upon illumination with green light, while cyan light stimulation induced various responses resembling those of sighted animals. Bottom: Raster plots show firing activity of the same RGCs recorded over 15 consecutive sweeps. Light stimuli are shown as cyan- or green-shaded areas. c, d Representative PSTHs (c) and instantaneous firing rate (d) of the RGCs recorded in (b). Bars represent AP counts (50-ms bins) recorded in response to either green (top panels) or cyan (bottom panels) stimulation. Light stimuli (500 ms) are shown as open rectangles. No modulation of firing activity is evoked in response to green light. e Box plots of the light-evoked AP counts (left) and peak firing rate (right) in response to 500-ms stimulation with either green or cyan light (colored boxes) in a time window starting from the onset to 1 s after the end of the light stimulus and normalized to the spontaneous activity recorded in the dark. Light stimulation was applied at increasing power densities (2, 10, 20, and 30 mW/mm2). The box plot center line represents the mean, the square in the box is the median, box boundaries show the first and third quartiles, and whiskers display the minimum and maximum values. *p < 0.05, **p < 0.01, ***p < 0.001; two-tailed paired-sample Wilcoxon’s signed-rank test (n = 14). Exact p-values and source data are provided as a Source Data file.
Fig. 4
Fig. 4. Ziapin2 restores the ability of degenerate rd10 retinas to analyze visual information in segregated channels.
a Representative AP raster plots obtained from HD-MEA recordings of the same rd10 blind retinal explant after incubation with Ziapin2 (10 µM) stimulated with either cyan (left) or green (right) light (500 ms; 2 mW/mm2). Each row represents the firing activity of single RGCs that were sorted for polarity. Light-dependent firing activity was only restored with full-field cyan, but not green, light stimulation. Light pulses are indicated with vertical color-coded bars. b Representative raster plots of APs generated by two RGCs with very different spontaneous activity over 60 sweeps. In both cells, green light stimulation (green rectangle) could not modulate firing activity. c Representative raster plots of AP firing of different classes of RGCs in response to full-field stimulation with cyan light (cyan rectangle). Cyan stimuli evoked ON-sustained (Cell1), ON transient (Cell2), ON-OFF (Cell3, Cell4), OFF-suppressed (Cell5) and OFF-transient (Cell6) responses. d Left: Pie charts represent the percentage of RGCs responsive to light stimulation with green (top) and cyan (bottom) light with respect to the total number of RGCs recorded by HD-MEA (numbers reported in parenthesis). ***p < 0.001, two-sided Fisher’s exact test; responsive/non-responsive RGCs to green versus cyan light. Right: Box plots showing the number of responsive and non-responsive RGCs to either cyan or green light stimuli in the retinas from n = 4 rd10 mice. The box plot center line represents the mean, the square in the box is the median, the box boundaries are the first and third quartile, and the whiskers are the minimum and maximum of data. e Box plots showing the number of ON, ON-OFF, and OFF RGCs responsive to either cyan or green light stimuli in the retinas from n = 4 rd10 mice. The box plot center line represents the mean, the square in the box is the median, the box boundaries are the first and third quartile, and the whiskers are the minimum and maximum of data. ####p < 0.0001, Fisher’s exact test; responsive/non-responsive RGCs to green versus cyan light; *p < 0.05, **p < 0.01, ***p < 0.001, two-way ANOVA/Holm–Šídák tests (n = 4). Exact p-values and source data are provided as a Source Data file.
Fig. 5
Fig. 5. The light-evoked capacitance change by Ziapin2 induces faster AP dynamics and membrane in degenerate rd10 retinas.
a Representative current-clamp traces of two RGCs from blind rd10 retinas incubated with Ziapin2 (10 µM), showing ON (left) and OFF (right) responses to cyan (right traces) but not to green light (left traces). The open rectangles represent the timing of the light stimuli (500 ms, 20 mW/mm2). Arrows indicate the first AP in the dark (d) and in response to light (l) used to perform the waveform analysis shown in (b). b Left: Representative phase-plane plot analysis of the first AP generated in the same RGCs shown in (a) in the dark (d), before light stimulation. Right: Box plots showing AP peak, maximal rising slope, and maximal repolarizing slope in the dark calculated from the phase plot analysis of all recorded RGCs (n = 28 RGCs). c Left: Representative phase-plane plot analysis of the first AP generated in the same RGCs shown in (a), during green or cyan light stimulation (l). Right: Box plots of AP peak, maximal rising slope, and maximal repolarizing slope after stimulation with either green or cyan light. ***p < 0.001; 2-tailed paired Wilcoxon’s signed-rank test (n = 28 RGCs). d Top: Representative lowpass-filtered voltage traces recorded from RGCs incubated with Ziapin2 (10 µM) in a time window of 1.5 s, starting from the onset of either green (left) or cyan (right) light stimulation (500 ms, 20 mW/mm2). The plots display the mean (± SD, gray area) Vm calculated within the same time window over 15 sweeps. Vrest (dashed line), membrane potential in the dark. APs evoked with cyan light are superimposed on the voltage traces. Bottom: Grayscale representation of Vm changes during the 15 sweeps (50-ms bins). Scale bar, 250 ms. e Box plots of peak depolarization (top) and peak after-hyperpolarization (bottom) calculated as the difference with respect to Vrest (see d) in RGCs treated with Ziapin2 and stimulated with either green or cyan light (colored boxes) at increasing power densities (2, 10, 20, and 30 mW/mm2) (n = 14 RGCs). The box plot center line represents the mean, the square in the box is the median, box boundaries show the first and third quartiles, and whiskers display the minimum and maximum values. *p < 0.05; **p < 0.01; two-tailed paired Wilcoxon’s signed-rank test cyan- versus green-light stimulation Exact p-values and source data are provided as a Source Data file.
Fig. 6
Fig. 6. Ziapin2 restores the light-evoked excitatory and inhibitory synaptic inputs to RGCs in degenerate rd10 retinas.
a Top: Representative voltage-clamp recordings in the cell-attached configuration of an OFF-RGC from a blind rd10 retina after 30 min incubation with Ziapin2 (10 µM) and subjected to full-field stimulation with either green (left) or cyan (right) light (500 ms, 20 mW/mm2). Bottom: Light-induced currents were recorded in the same RGC after reaching the whole-cell configuration and applying voltage steps from −86 to 34 mV. The light stimuli are shown as color-coded bars in the bottom traces. b Total conductances in the same Ziapin2-incubated RGC shown in (a) in response to either green or cyan light stimulation calculated from the current traces. c The excitatory (ge) and inhibitory (gi) conductances evoked, in the same RGC shown in (a), by either green (left) or cyan (right) light stimuli were extrapolated from the voltage-clamp recordings. d Box plots of the maximum values of excitatory (ge; left) and inhibitory (gi; right) conductances calculated from all RGCs stimulated with green (green boxes) and cyan (cyan boxes) light at 2 and 20 mW/mm2 power densities (n = 12 RGCs). *p < 0.05; 2-tailed paired Wilcoxon’s signed-rank test, cyan- versus green-light stimulation. e Left: Representative HD-MEA recordings (raster plots of 20 sweeps and respective PSTHs shown below) of an ON-RGC from a healthy WT retina stimulated with cyan light (2 mW/mm2; 250 ms; rectangle) under basal conditions and after the application of the mGluR6 agonist L-AP4, which abolishes the light-evoked activation of rod and cone-ON BCs. Right: The same protocol was applied to a representative RGC from blind rd10 retinas incubated with Ziapin2 (10 µM) and stimulated with cyan light before (basal) and after the application of L-AP4. f Box plots of the RGC firing activity in healthy WT retinas (left) and Ziapin2-treated blind rd10 retinas (right) stimulated with cyan light (2 mW/mm2) for 100 and 250 ms in the absence or presence of L-AP4 (n = 322 and 266 RGCs for WT and rd10 retinas, respectively from n = 2 WT and n = 2 rd10 mice). The box plot center line represents the mean, the square in the box is the median, box boundaries show the first and third quartiles, and whiskers display the minimum and maximum values. ***p < 0.001, two-tailed paired Wilcoxon’s signed-rank test, basal versus L-AP4. Exact p-values and source data are provided as a Source Data file.
Fig. 7
Fig. 7. Light sensitivity is restored in blind rd10 mice after in vivo administration of Ziapin2.
a Experimental timeline indicating the in vivo procedures performed in 6-month-old blind rd10 mice and aged-matched WT mice subjected to the bilateral intravitreal injection of either vehicle or Ziapin2 in saline. b Schematic representation of the Light-Dark box apparatus kept entirely in the dark. The time-course on the right shows the mean (± SEM) percent time spent in the left compartment (L) over the total duration of the test by blind rd10 mice injected with either vehicle (DMSO; black) or Ziapin2 (red). Vehicle-injected WT mice (green; mean ± SEM) are shown for comparison (mean: solid horizontal line; SEM, broken lines). c Representative animal tracks in the left compartment for the three experimental groups described in (b). The time-course on the right shows the mean (± SEM) percent time spent in the center area of the left compartment (gray rectangle) over the 3-min of observation. Vehicle-injected WT mice (green; mean ± SEM) are shown for comparison. d Schematic of the apparatus during the light condition (5-lux white light in the left compartment). The time-course on the right shows the mean (± SEM) percent time spent in the lighted compartment over the 3-min test by the three experimental groups. Vehicle-injected WT mice (green; mean ± SEM) are shown for comparison. e Representative animal tracks in the lighted left compartment for the three experimental groups described in (d). The time-course on the right shows the mean (± SEM) percent time spent in the center area of the left compartment. Vehicle-injected WT mice (green; mean ± SEM) are shown for comparison. *p < 0.05, ***p < 0.001, one-way ANOVA/Dunnett’s tests versus “pre” within group; #p < 0.05, ##p < 0.01, ###p < 0.001, one-way ANOVA/Tukey’s tests versus rd10/Ziapin2; ΔΔp < 0.01, ΔΔΔp < 0.001, one-way ANOVA/Tukey’s tests versus WT/DMSO (WT/DMSO, n = 7; rd10/DMSO, n = 14; rd10/Ziapin2, n = 18). g ****p < 0.0001, two-sided Fisher’s exact test; ##p < 0.01, ###p < 0.001, two-way ANOVA/Holm–Šídák tests (n = 3 for both rd10 mice/DMSO and rd10 mice/Ziapin2). Exact p-values and source data are provided as a Source Data file. Created in BioRender. Benfenati, F. (2024) https://BioRender.com/o06m024.
Fig. 8
Fig. 8. Optomotor responses and physiological RGC discharges are restored in blind rd10 mice after in vivo administration of Ziapin2.
a Left: Schematic representation of the Optomotor Response (OMR) apparatus. Right: The time course on the right shows the mean (± SEM) peak OMR index scored by the three experimental groups before (pre) and after the injection. OMR index discriminates between perceived (>1.2) and non-perceived (<1.2) patterns. Vehicle-injected WT mice (green; mean ± SEM) are shown for comparison. b Extracellular recordings of RGCs were performed with HD-MEA on retinal explants from rd10 mice 2 days after the intravitreal injection of either DMSO or Ziapin2. Pie charts show the percentage of RGCs responsive to full-field cyan stimulation (2 mW/mm2, 500 ms; DMSO top, black sector; Ziapin2 bottom, red sector) for the total number of recorded RGCs. The absolute number of cells is reported in parenthesis. The box plots on the right show the number of responsive ON, ON-OFF, and OFF RGCs classified based on their response to light. The box plot center line represents the mean, the square in the box is the median, box boundaries show the first and third quartiles, and whiskers display the minimum and maximum values. a *p < 0.05, ***p < 0.001, one-way ANOVA/Dunnett’s tests versus “pre” within groups; #p < 0.05, ##p < 0.01, ###p < 0.001, one-way ANOVA/Tukey’s tests versus rd10/Ziapin2; ΔΔp < 0.01, ΔΔΔp < 0.001, one-way ANOVA/Tukey’s tests versus WT/DMSO (WT/DMSO, n = 7; rd10/DMSO, n = 14; rd10/Ziapin2, n = 18). b ****p < 0.0001, two-sided Fisher’s exact test; ##p < 0.01, ###p < 0.001, two-way ANOVA/Holm–Šídák tests (n = 3 for both rd10 mice/DMSO and rd10 mice/Ziapin2). Exact p-values and source data are provided as a Source Data file. Created in BioRender. Benfenati, F. (2024) https://BioRender.com/i45t231.

References

    1. Goetz, J. et al. Unified classification of mouse retinal ganglion cells using function, morphology, and gene expression. Cell Rep.40, 111040 (2022). - PMC - PubMed
    1. Masland, R. H. Cell populations of the retina: the proctor lecture. Invest. Opthalmol.Vis. Sci.52, 4581 (2011). - PMC - PubMed
    1. Baden, T. et al. The functional diversity of retinal ganglion cells in the mouse. Nature529, 345–350 (2016). - PMC - PubMed
    1. Masland, R. H. The neuronal organization of the retina. Neuron76, 266–280 (2012). - PMC - PubMed
    1. Rossi, E. A. & Roorda, A. The relationship between visual resolution and cone spacing in the human fovea. Nat. Neurosci.13, 156–157 (2009). - PMC - PubMed

MeSH terms

LinkOut - more resources