. 2025 Jan 11;10(1):1.
doi: 10.1038/s41536-025-00389-z.

Pharmacological or genetic inhibition of LTCC promotes cardiomyocyte proliferation through inhibition of calcineurin activity

Affiliations

Pharmacological or genetic inhibition of LTCC promotes cardiomyocyte proliferation through inhibition of calcineurin activity

Lynn A C Devilée et al. NPJ Regen Med. .

Abstract

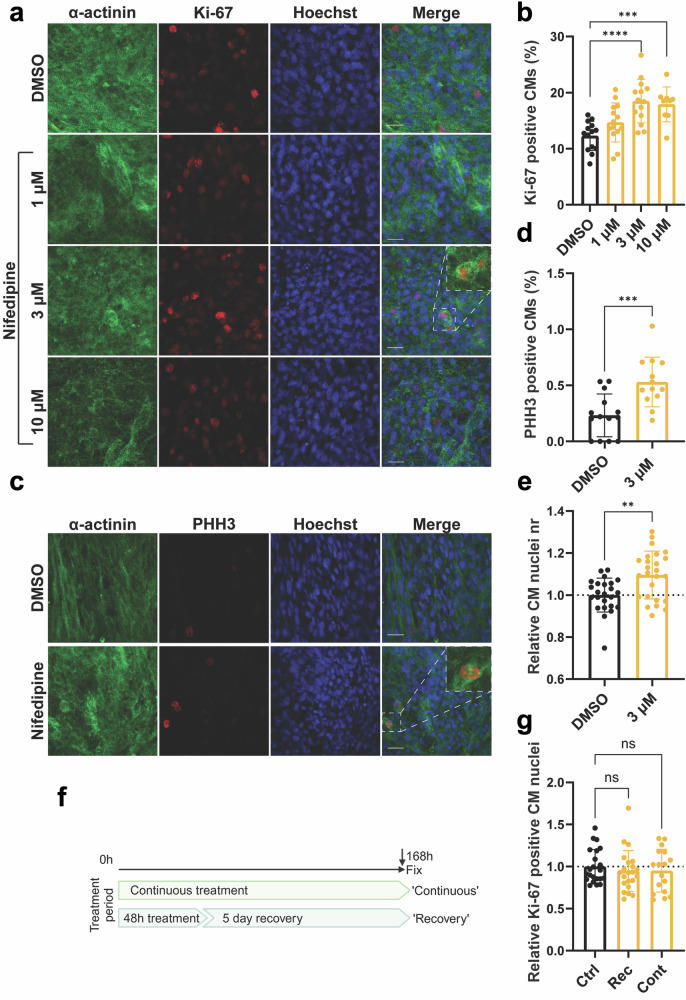
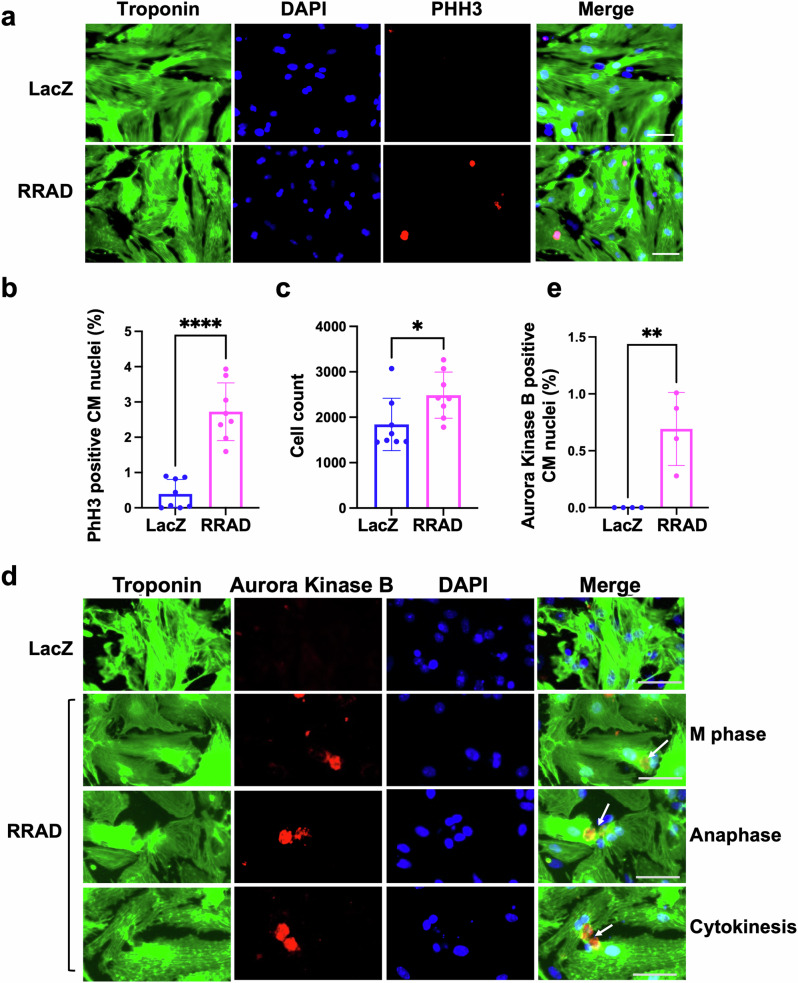
Cardiomyocytes (CMs) lost during ischemic cardiac injury cannot be replaced due to their limited proliferative capacity. Calcium is an important signal transducer that regulates key cellular processes, but its role in regulating CM proliferation is incompletely understood. Here we show a robust pathway for new calcium signaling-based cardiac regenerative strategies. A drug screen targeting proteins involved in CM calcium cycling in human embryonic stem cell-derived cardiac organoids (hCOs) revealed that only the inhibition of L-Type Calcium Channel (LTCC) induced the CM cell cycle. Furthermore, overexpression of Ras-related associated with Diabetes (RRAD), an endogenous inhibitor of LTCC, induced CM cell cycle activity in vitro, in human cardiac slices, and in vivo. Mechanistically, LTCC inhibition by RRAD or nifedipine induced CM cell cycle by modulating calcineurin activity. Moreover, ectopic expression of RRAD/CDK4/CCND in combination induced CM proliferation in vitro and in vivo, improved cardiac function and reduced scar size post-myocardial infarction.


Conflict of interest statement

Competing interests: T.M.A.M holds equities in Tenaya Therapeutics. T.M.A.M. is a co-inventor on pending patents that relate to heart slice culture. J.E.H. is listed as a co-inventor on pending patents that relate to cardiac organoid maturation and cardiac regeneration therapeutics. J.E.H. is a co-inventor on licensed patents relating to engineered heart muscle. J.E.H. is a co-founder, scientific advisor, and stockholder in Dynamics. The other authors report no disclosures.

Figures

Fig. 1
Fig. 1. Drug screen targeting proteins involved in CM Ca2+ cycling revealed that inhibition of LTCC enhances CM cell cycle activity in hCOs.
a Representative images of hCOs treated with DMSO (vehicle) or nifedipine (1, 3 or 10 µM) for 48 h and stained against α-actinin (green), Hoechst (blue), and Ki-67 (red) (Scale bar 20 µm). b Bar graphs representing the percentage of CMs positive for Ki-67 (n = 9–14 hCOs from 2-3 experiments). c Representative images of hCOs treated with DMSO (vehicle) or nifedipine (3 µM) for 48 h and stained against α-actinin (green), Hoechst (blue), and Ki-67 (red) (Scale bar 20 µm). d Bar graphs representing the percentage of CMs positive for PHH3 (n = 13–14 hCOs from 4 experiments e Relative CM nuclei count based on NKX2.5 positive immunostaining (n = 24–25 hCOs from 3 experiments). f Schematic of the 7-day experiment with continuous (7-day) or 48 H (recovery) treatment with 3 µM nifedipine. g Overall cell cycle activity after continuous treatment or recovery. (Ctrl, DMSO; Rec, recovery; Cont, continuous) (n = 17–22 hCOs from 3 to 4 experiments). The relative data is normalized to DMSO-treated hCOs. Data are presented as mean ± SD with individual data points representing individual hCOs. *P < 0.05, **P < 0.01, ***P < 0.001, ****P < 0.0001.
Fig. 2
Fig. 2. Single Cell RNAseq from P1 NMCM demonstrated RRAD is highly expressed in spontaneously proliferating CMs and CMs that respond to cell cycle induction.
a UMAP plots displaying global gene expression for all single CMs sequenced 24 h post LacZ (control) or 4 F transduction (n = 11482, 10301 respectively). b All cells show high expression of the cardiac markers Tnnt2, Tnnc1, and Myh6, indicating a pure CM population. c P1 NMCM that showed high expression of mitotic/cytokinesis genes (Ki-67, Aurora Kinase B and A, Top2, Ccna2, Pcna, E2f1, Cdc20, Plk1, and Anln). d P1 NMCM showed high expression of Cd36, a marker for CMs that are more likely to respond to cell cycle stimulation. e Re-clustering based on the expression of the mitotic genes and the expression of Cd36 generated 3 clusters - the spontaneously proliferating CMs, primed CMs, and non-cell cycle active CMs f RRAD expression colocalized within the spontaneous proliferating CMs and the primed CMs.
Fig. 3
Fig. 3. RRAD overexpression in NMCM P7 promotes cell cycle induction.
a Representative images of NMCM P7 transduced with LacZ or RRAD adenovirus and stained against troponin-T (green), PHH3 (red), and Dapi (blue) (Scale bar 100 µm). b Quantification of the percentage PHH3 positive CM nuclei (n = 8). c Quantification of CM counts (n = 8). d Representative images of NMCM P7 transduced with LacZ or RRAD adenovirus and stained against troponin-T (green), Aurora Kinase B (red), and Dapi (blue) (Scale bar 50 µm) arrows referes to the nucleous at different stage of cell cycle. e Quantification of the percentage Aurora Kinase B positive CM nuclei (n = 4). Data are presented as mean ± SD, *p < 0.05, **p < 0.01, ****p < 0.0001.
Fig. 4
Fig. 4. RRAD overexpression in human heart slices promotes cell cycle induction and induces more CMs to enter the cell cycle in response to cell cycle stimuli.
a Representative images of human heart slices transfected with LacZ or RRAD adenovirus for 24 h, then transfected with CDK4 and CCND (2 F) for 48 h and stained against troponin-T (green), PHH3 (red) and Dapi (blue) (Scale bar 20 µm). bc Quantification of the percentage PHH3 positive CM nuclei (n = 4–6 individual slices). d Representative images of human heart slices transduced with LacZ or RRAD adenovirus for 24 h, then transduced with CDK4 and CCND (2 F) for 48 h and stained against troponin-T (green), Aurora Kinase B (red), and Dapi (blue) (Scale bar 20 µm). e, f Quantification of the percentage of Aurora Kinase B positive CM nuclei (n = 8). Data are presented as mean ± SD, *p < 0.05, **p < 0.01, ***p < 0.001, ****p < 0.0001.
Fig. 5
Fig. 5. Complete CM division occurs in MADM mice following RRAD overexpression.
a Schematic diagram of the experimental design for MADM mice injection with LacZ, RRAD, CDK4/CCND (2 F), or RRAD/2 F. b Representative images show single-colored CMs of MADM mice hearts treated with LacZ, RRAD, CDK4/CCND (2 F), or RRAD/2 F (Scale bar= 20 μm). c Quantification of the percentage of the single-colored CMs to the total labeled CMs in LacZ or RRAD treated mice (n = 8), d 2 F or 2 F + RRAD treated mice (n = 8). Data are presented as mean ± SD. *p < 0.05.
Fig. 6
Fig. 6. Inhibition of LTCC activity modulates the calcineurin activity.
NMCM P7 transduced with LacZ or RRAD adenovirus for 72 h. a Quantification of the calcineurin phosphatase activity (n = 3). b Fold change analysis of the mRNA expression of (Rcan1) (n = 4). c Fold change analysis of the mRNA expression of (Rcan1) in NMCM P7 transduced with ShRNA-control-IL (Ctrl) or ShRNA-RRAD-IL (RRAD KD) for 24 h and then treated with vehicle or 0.5 mM nifedipine for 72 h (n = 3). d Fold change analysis of the mRNA expression of (Rcan1) in MADM mice transduced with LacZ or RRAD Adenovirus (n = 8). e Immunostaining against troponin-T (Green), DAPI (Blue), Hoxb13 (Red) in NMCM P7 transduced with LacZ or RRAD adenovirus for 72 h. (scale bar 100 μm). f Bar graph represents the percentage of Hoxb13 positive CM nuclei (n = 4). g NMCM P7 transduced with ShRNA-control-IL (Ctrl) or ShRNA-RRAD-IL (RRAD KD) for 24 h and then treated with vehicle or 0.5 mM nifedipine for 72 h and stained against troponin-T (Green), DAPI (Blue), Hoxb13 (Red) (scale bar 100 μm). h Bar graph represents the percentage of Hoxb13 positive CM nuclei (n = 3).
Fig. 7
Fig. 7. RRAD/2 F combination improves cardiac function and reduces scar size post MI.
a schematic diagram of the experimental design. Echocardiography assessment of b, c EF%, d, e FS%, f, g delta EF, h, i delta FS (4 weeks post virus injection- 1 week post MI). (n = 5–6 mice per group, *p < 0.05, **p < 0.01, ***p < 0.001, ****p < 0.0001, error bars indicate S.D.). j Representative images of mice hearts were stained with Masson’s trichrome stain (healthy myocardium stains red and fibrotic tissue stains blue) at the end of the experiment (scale bar= 2 mm). k, l The scar size quantification as a percentage of total heart tissue (n = 6 mice per group, 12–13 heart sections per animal, *p < 0.05, error bars indicate S.D.). (delta function = cardiac function 4 weeks post virus injection- cardiac function before virus injection (1 week Post MI)).
Fig. 8
Fig. 8. LTCC inhibition by RRAD or nifedipine induced CM cell cycle by modulating calcineurin activity.
Schematic diagram of the mechanism by which LTCC inhibition by RRAD or nifedipine promotes CM proliferation.

Update of

References

    1. Li, V. C. & Kirschner, M. W. Molecular ties between the cell cycle and differentiation in embryonic stem cells. Proc. Natl Acad. Sci. USA111, 9503–9508 (2014). - PMC - PubMed
    1. Eisner, D. A., Caldwell, J. L., Kistamas, K. & Trafford, A. W. Calcium and excitation-contraction coupling in the heart. Circ. Res.121, 181–195 (2017). - PMC - PubMed
    1. Sutanto, H. et al. Cardiomyocyte calcium handling in health and disease: Insights from in vitro and in silico studies. Prog. Biophys. Mol. Biol.157, 54–75 (2020). - PubMed
    1. Fearnley, C. J., Roderick, H. L. & Bootman, M. D. Calcium signaling in cardiac myocytes. Cold Spring Harb. Perspect. Biol.3, a004242 (2011). - PMC - PubMed
    1. Dewenter, M., von der Lieth, A., Katus, H. A. & Backs, J. Calcium signaling and transcriptional regulation in cardiomyocytes. Circ. Res.121, 1000–1020 (2017). - PubMed