

Projected increase in droughts over the Arabian Peninsula and associated uncertainties
- PMID: 39799215
- PMCID: PMC11724952
- DOI: 10.1038/s41598-025-85863-w
Projected increase in droughts over the Arabian Peninsula and associated uncertainties
Abstract
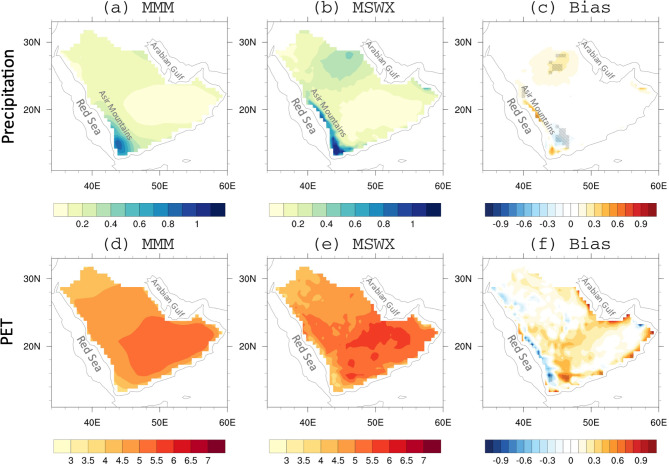
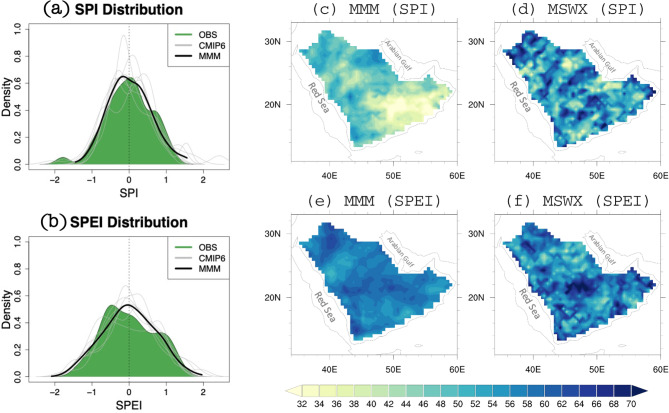
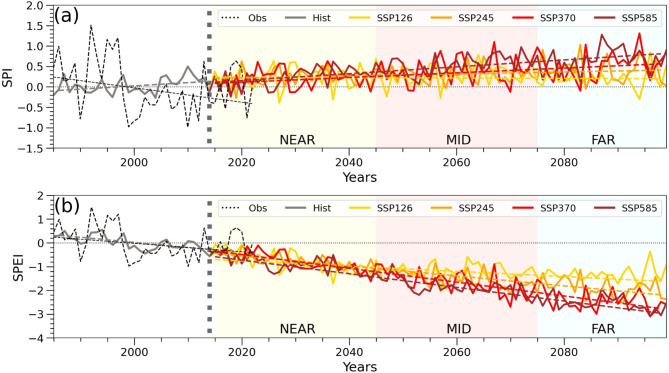
The Arabian Peninsula (AP) has been reported to experience increasing drought in recent decades. With this background, this study evaluates best performing Climate Model Intercomparison Project 6 (CMIP6) Global Climate Models (GCMs) for historical (1985-2014) simulations and future drought projections across the AP until 2100, using the standardized precipitation index (SPI) and standardized precipitation-evapotranspiration index (SPEI). We assess uncertainties from model differences, scenarios, timescales, and methods. Our findings reveal the limitations of most models in reproducing precipitation, leading to uncertainties in SPI projections. Nonetheless, CMIP6-GCMs better capture the increase in the current-day potential evapotranspiration (PET) and therefore the SPEI, which is dominated by PET. The Hargreaves based PET is identified as the most suitable method for SPEI projections. The rate of increase in PET surpasses that of precipitation in all scenarios by fivefold. Consequently, SPEI indicates projected increase in future droughts with greater changes in SSP585 and SSP370 scenario compared to SSP245 and SSP126. In general, drought will exacerbate in the AP despite uncertainties from indices selection, scenarios, and inter-model variability, followed by methods and timescales which predominantly impacts drought magnitude. Over findings emphasize the need for more reliable representation of the AP precipitation in climate models for improved drought projection over the AP to enhance planning and adaptation strategies.
© 2025. The Author(s).
Conflict of interest statement
Declarations. Competing interests: The authors declare no competing interests. Supplementary Information: There is another separate file for supplementary information.
Figures


Similar articles
-
Projections of drought characteristics in China based on a standardized precipitation and evapotranspiration index and multiple GCMs.Sci Total Environ. 2020 Feb 20;704:135245. doi: 10.1016/j.scitotenv.2019.135245. Epub 2019 Nov 22. Sci Total Environ. 2020. PMID: 31818549
-
Future projection of droughts in Morocco and potential impact on agriculture.J Environ Manage. 2024 Sep;367:122019. doi: 10.1016/j.jenvman.2024.122019. Epub 2024 Aug 5. J Environ Manage. 2024. PMID: 39106801
-
A framework for assessing uncertainties in drought projections under climate change: Insights from CMIP6 models.Sci Total Environ. 2025 Jun 20;982:179679. doi: 10.1016/j.scitotenv.2025.179679. Epub 2025 May 17. Sci Total Environ. 2025. PMID: 40382958
-
Global Future Drought Layers Based on Downscaled CMIP6 Models and Multiple Socioeconomic Pathways.Sci Data. 2025 Feb 19;12(1):295. doi: 10.1038/s41597-025-04612-w. Sci Data. 2025. PMID: 39971936 Free PMC article.
-
Projected changes to drought characteristics in Tehran under CMIP6 SSP-RCP climate change scenarios.Heliyon. 2025 Jan 9;11(2):e41811. doi: 10.1016/j.heliyon.2025.e41811. eCollection 2025 Jan 30. Heliyon. 2025. PMID: 39882481 Free PMC article.
References
-
- IPCC, Summary for Policymakers. : The Physical Science Basis. Contribution of Working Group I to the Sixth Assessment Report of the Intergovernmental Panel on Climate Change [Masson-Delmotte, V., P. Zhai, A. Pirani, et al., (eds.)]. Cambridge University Press, Cambridge, United Kingdom and New York, NY, USA, pp. 3 – 32. (2021).In: Climate Change (2021).
-
- Seneviratne, S. I. et al. Weather and Climate Extreme events in a changing climate. In Climate Change the1: The Physical Science Basis. Contribution of Working Group I to the Sixth Assessment Report of the Intergovernmental Panel on Climate Change [Masson-Delmotte, (eds Zhai, V. P. & Pirani, A.) ]. Cambridge University Press, Cambridge, United Kingdom and New York, NY, USA, 1513–1766. (2021).
-
- Perkins-Kirkpatrick, S. E. et al. On the attribution of the impacts of extreme weather events to anthropogenic climate change. Environ. Res. Lett.17, 024009 (2022).
-
- Trenberth, K. E. et al. Global warming and changes in drought. Nat. Clim. Chang.4, 17–22 (2014).
-
- Lewis, S. C. & King, A. D. Evolution of mean, variance and extremes in 21st century temperatures. Weather Clim. Extrem. 15, 1–10 (2017).
Grants and funding
- RGC/03/4829-01-01/National Center for Meteorology, Jeddah, Saudi Arabia
- RGC/03/4829-01-01/National Center for Meteorology, Jeddah, Saudi Arabia
- RGC/03/4829-01-01/National Center for Meteorology, Jeddah, Saudi Arabia
- RGC/03/4829-01-01/National Center for Meteorology, Jeddah, Saudi Arabia
- RGC/03/4829-01-01/National Center for Meteorology, Jeddah, Saudi Arabia
LinkOut - more resources
Full Text Sources
