

Unsupervised deep learning of electrocardiograms enables scalable human disease profiling
- PMID: 39799251
- PMCID: PMC11724961
- DOI: 10.1038/s41746-024-01418-9
Unsupervised deep learning of electrocardiograms enables scalable human disease profiling
Abstract
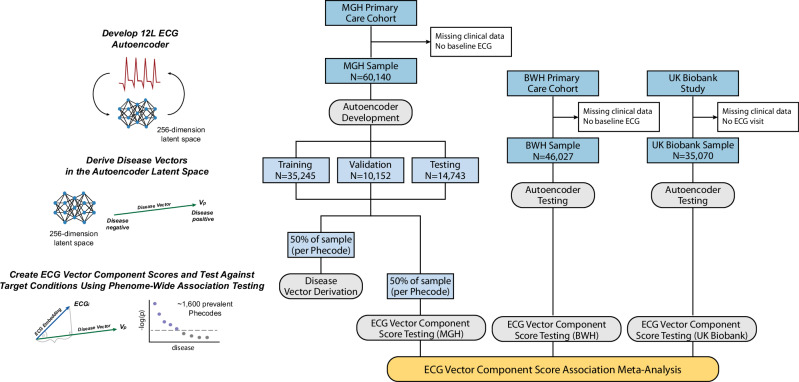
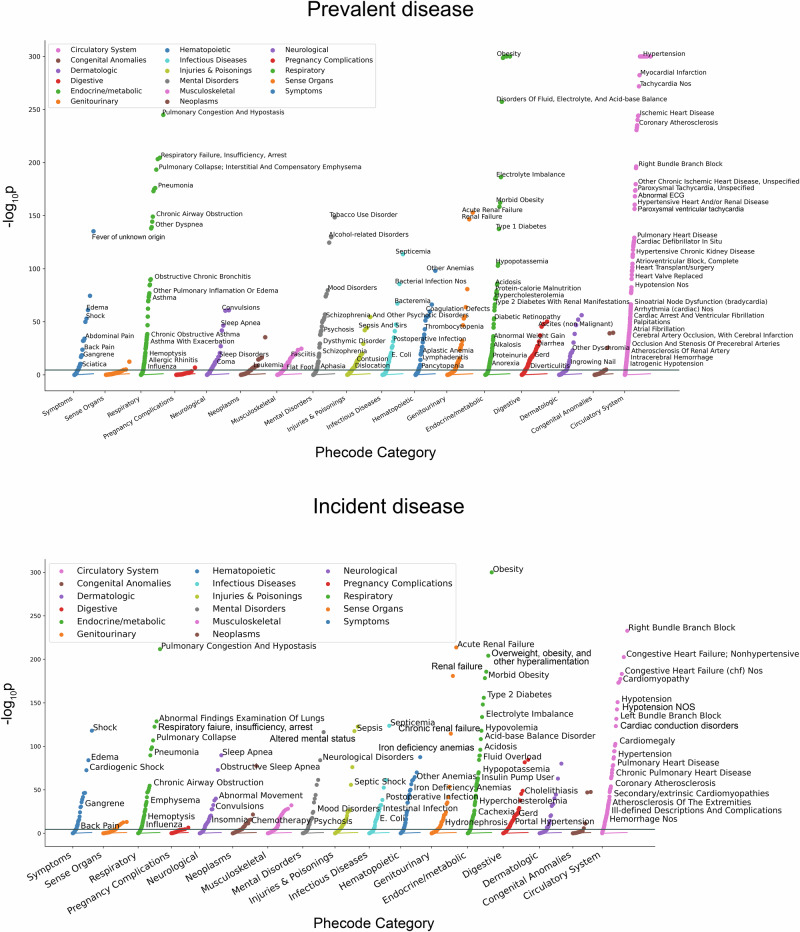
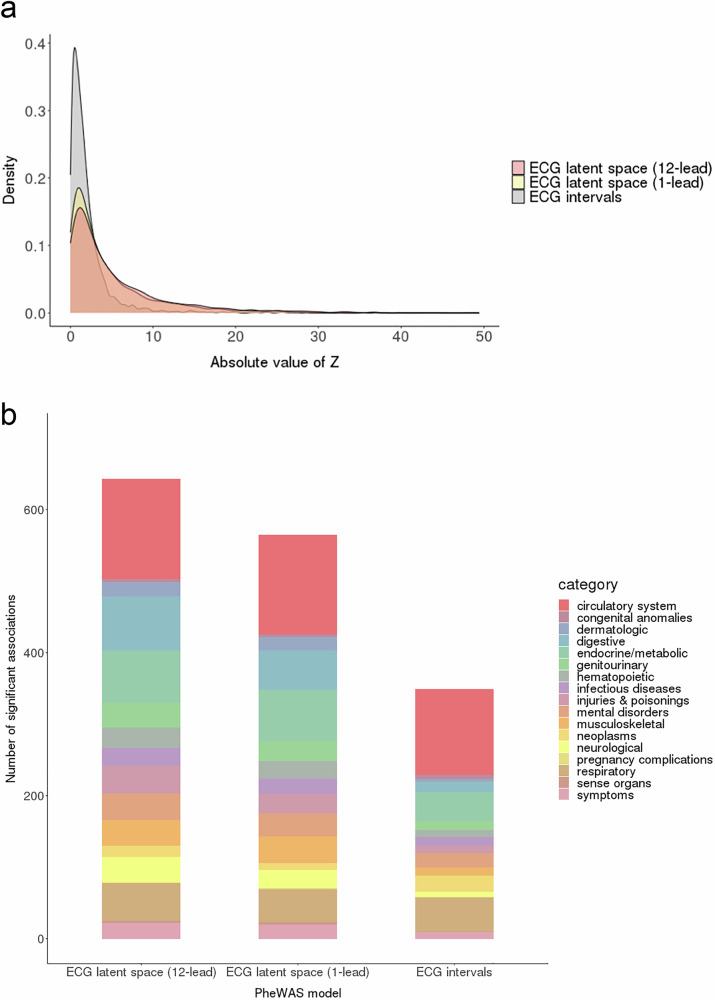
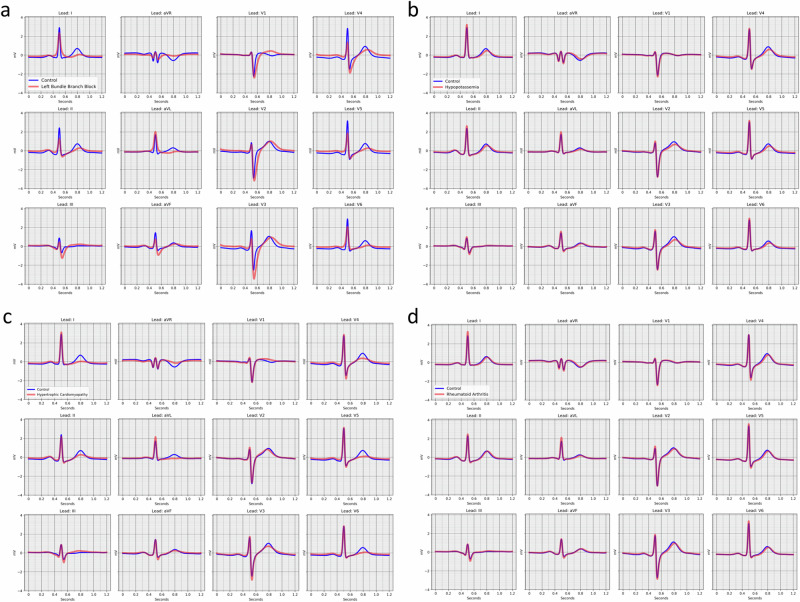
The 12-lead electrocardiogram (ECG) is inexpensive and widely available. Whether conditions across the human disease landscape can be detected using the ECG is unclear. We developed a deep learning denoising autoencoder and systematically evaluated associations between ECG encodings and ~1,600 Phecode-based diseases in three datasets separate from model development, and meta-analyzed the results. The latent space ECG model identified associations with 645 prevalent and 606 incident Phecodes. Associations were most enriched in the circulatory (n = 140, 82% of category-specific Phecodes), respiratory (n = 53, 62%) and endocrine/metabolic (n = 73, 45%) categories, with additional associations across the phenome. The strongest ECG association was with hypertension (p < 2.2×10-308). The ECG latent space model demonstrated more associations than models using standard ECG intervals, and offered favorable discrimination of prevalent disease compared to models comprising age, sex, and race. We further demonstrate how latent space models can be used to generate disease-specific ECG waveforms and facilitate individual disease profiling.
© 2025. The Author(s).
Conflict of interest statement
Competing interests: Dr. Lubitz is a full-time employee of Novartis Institutes for Biomedical Research as of July 18, 2022. Dr. Lubitz has received sponsored research support from Bristol Myers Squibb, Pfizer, Boehringer Ingelheim, Fitbit, Medtronic, Premier, and IBM, and has consulted for Bristol Myers Squibb, Pfizer, Blackstone Life Sciences, and Invitae. Dr. Anderson receives sponsored research support from Bayer AG and Massachusetts General Hospital and has consulted for ApoPharma. Dr. Weng receives sponsored research support from IBM to the Broad Institute. Dr. Ellinor has received sponsored research support from Bayer AG and IBM Health, and he has consulted for Bayer AG, Novartis and MyoKardia. Dr. Batra, Dr. Reeder and Dr. Friedman have received sponsored research support from Bayer AG and IBM Health. Dr. Ho and Dr. Khurshid have received sponsored research support from Bayer AG. The remaining authors declare no competing interests.
Figures
Similar articles
-
A New Measure of Quantified Social Health Is Associated With Levels of Discomfort, Capability, and Mental and General Health Among Patients Seeking Musculoskeletal Specialty Care.Clin Orthop Relat Res. 2025 Apr 1;483(4):647-663. doi: 10.1097/CORR.0000000000003394. Epub 2025 Feb 5. Clin Orthop Relat Res. 2025. PMID: 39915110
-
Immunogenicity and seroefficacy of pneumococcal conjugate vaccines: a systematic review and network meta-analysis.Health Technol Assess. 2024 Jul;28(34):1-109. doi: 10.3310/YWHA3079. Health Technol Assess. 2024. PMID: 39046101 Free PMC article.
-
Comorbidity Profiles of Posttraumatic Stress Disorder Across the Medical Phenome.Biol Psychiatry Glob Open Sci. 2024 May 29;4(5):100337. doi: 10.1016/j.bpsgos.2024.100337. eCollection 2024 Sep. Biol Psychiatry Glob Open Sci. 2024. PMID: 39050781 Free PMC article.
-
Comparison of Two Modern Survival Prediction Tools, SORG-MLA and METSSS, in Patients With Symptomatic Long-bone Metastases Who Underwent Local Treatment With Surgery Followed by Radiotherapy and With Radiotherapy Alone.Clin Orthop Relat Res. 2024 Dec 1;482(12):2193-2208. doi: 10.1097/CORR.0000000000003185. Epub 2024 Jul 23. Clin Orthop Relat Res. 2024. PMID: 39051924
-
Signs and symptoms to determine if a patient presenting in primary care or hospital outpatient settings has COVID-19.Cochrane Database Syst Rev. 2022 May 20;5(5):CD013665. doi: 10.1002/14651858.CD013665.pub3. Cochrane Database Syst Rev. 2022. PMID: 35593186 Free PMC article.
References
-
- Trobec, R. & Tomašić, I. Synthesis of the 12-lead electrocardiogram from differential leads. IEEE Trans. Inf. Technol. Biomed.15, 615–621 (2011). - PubMed
-
- Barold, S. S. Willem Einthoven and the birth of clinical electrocardiography a hundred years ago. Card. Electrophysiol. Rev.7, 99–104 (2003). - PubMed
-
- Salvati, M. et al. Electrocardiographic changes in subarachnoid hemorrhage secondary to cerebral aneurysm. Report of 70 cases. Ital. J. Neurol. Sci.13, 409–413 (1992). - PubMed
-
- Surawicz, B. Relationship between electrocardiogram and electrolytes. Am. Heart J.73, 814–834 (1967). - PubMed
Grants and funding
- U01NS069763/U.S. Department of Health & Human Services | NIH | National Heart, Lung, and Blood Institute (NHLBI)
- K24HL105780/U.S. Department of Health & Human Services | NIH | National Heart, Lung, and Blood Institute (NHLBI)
- 21SFRN812095/American Heart Association (American Heart Association, Inc.)
- 18SFRN34250007/American Heart Association (American Heart Association, Inc.)
- 23CDA1050571/American Heart Association (American Heart Association, Inc.)
- 18SFRN34110082/American Heart Association (American Heart Association, Inc.)
- R01HL140224/U.S. Department of Health & Human Services | NIH | National Heart, Lung, and Blood Institute (NHLBI)
- R01HL139731/U.S. Department of Health & Human Services | NIH | National Heart, Lung, and Blood Institute (NHLBI)
- K23 HL159243/HL/NHLBI NIH HHS/United States
- K23 HL169839/HL/NHLBI NIH HHS/United States
- K23HL159243/U.S. Department of Health & Human Services | NIH | National Heart, Lung, and Blood Institute (NHLBI)
- K08HL159346/U.S. Department of Health & Human Services | NIH | National Heart, Lung, and Blood Institute (NHLBI)
- R01HL160003/U.S. Department of Health & Human Services | NIH | National Heart, Lung, and Blood Institute (NHLBI)
- 1R01HL092577/U.S. Department of Health & Human Services | NIH | National Heart, Lung, and Blood Institute (NHLBI)
- K23HL169839/U.S. Department of Health & Human Services | NIH | National Heart, Lung, and Blood Institute (NHLBI)
- R01NS103924/U.S. Department of Health & Human Services | NIH | National Heart, Lung, and Blood Institute (NHLBI)
- K24HL153669/U.S. Department of Health & Human Services | NIH | National Heart, Lung, and Blood Institute (NHLBI)
- 1R01HL139731/U.S. Department of Health & Human Services | NIH | National Heart, Lung, and Blood Institute (NHLBI)
- R01HL134893/U.S. Department of Health & Human Services | NIH | National Heart, Lung, and Blood Institute (NHLBI)
- 853922/American Heart Association (American Heart Association, Inc.)
