. 2025 Mar 5;33(3):1031-1047.
doi: 10.1016/j.ymthe.2025.01.009. Epub 2025 Jan 11.

Depletion of alloreactive B cells by drug-resistant chimeric alloantigen receptor T cells to prevent transplant rejection

Affiliations

Depletion of alloreactive B cells by drug-resistant chimeric alloantigen receptor T cells to prevent transplant rejection

Anna Christina Dragon et al. Mol Ther. .

Abstract

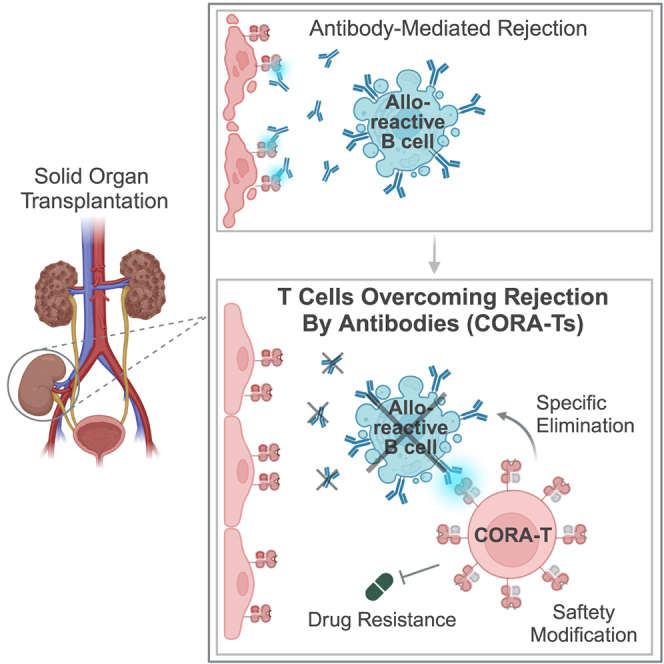
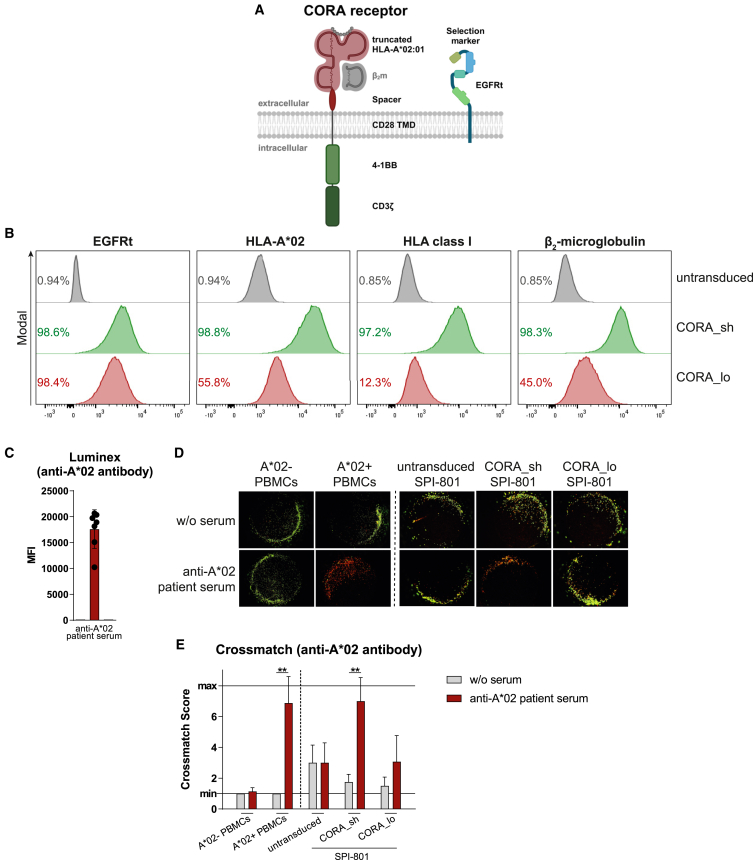
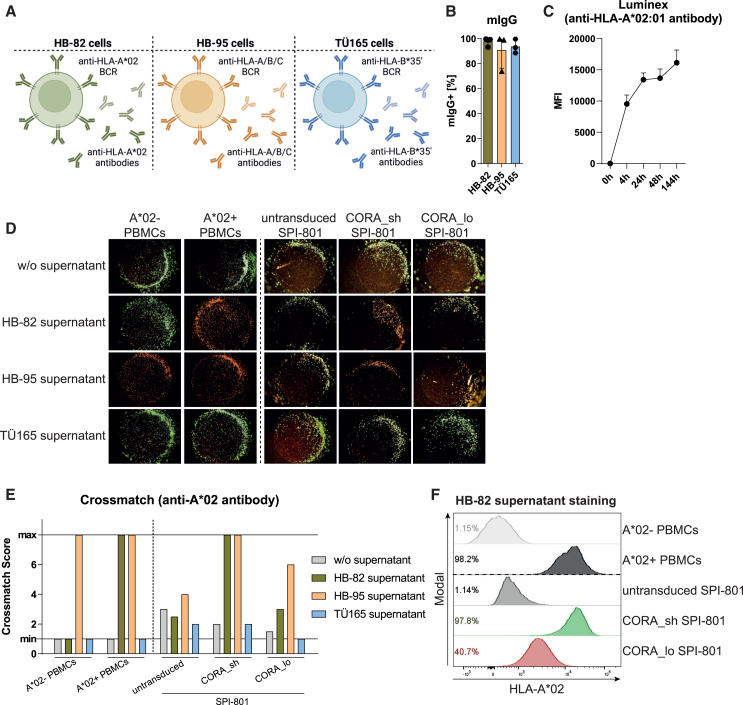
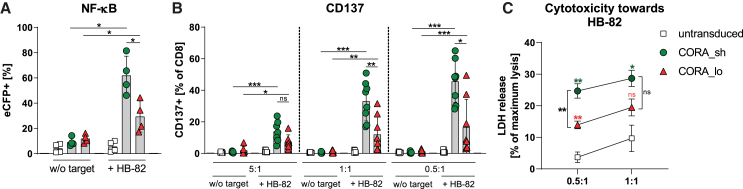
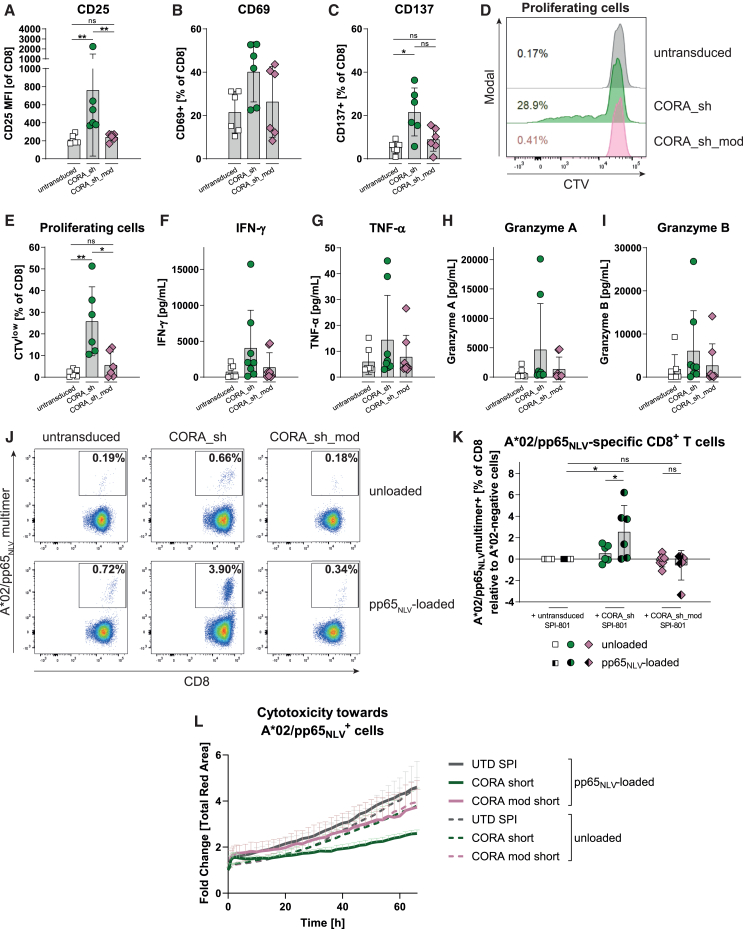
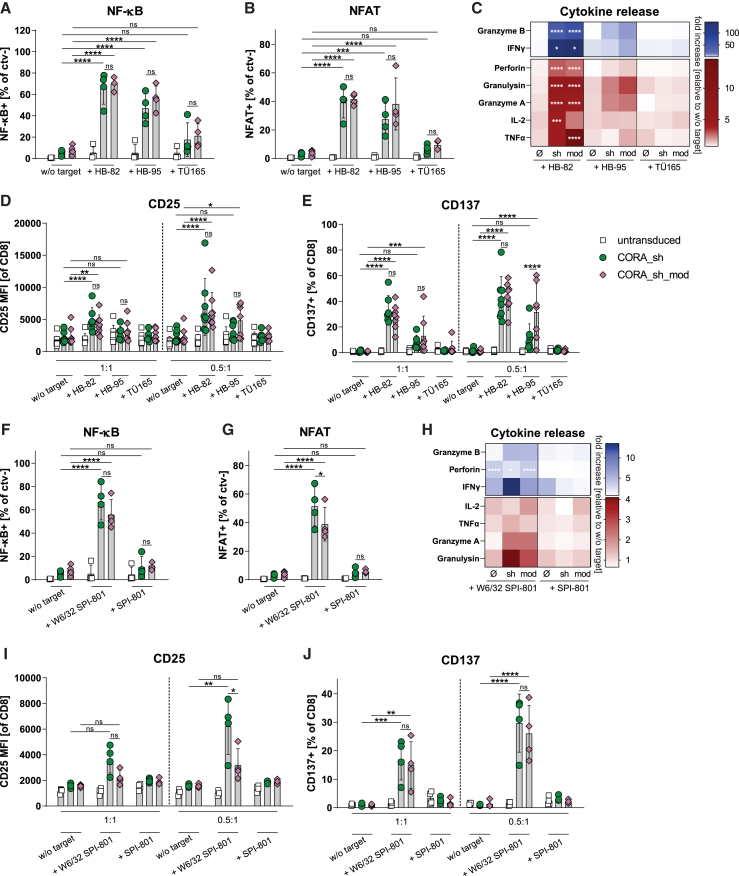
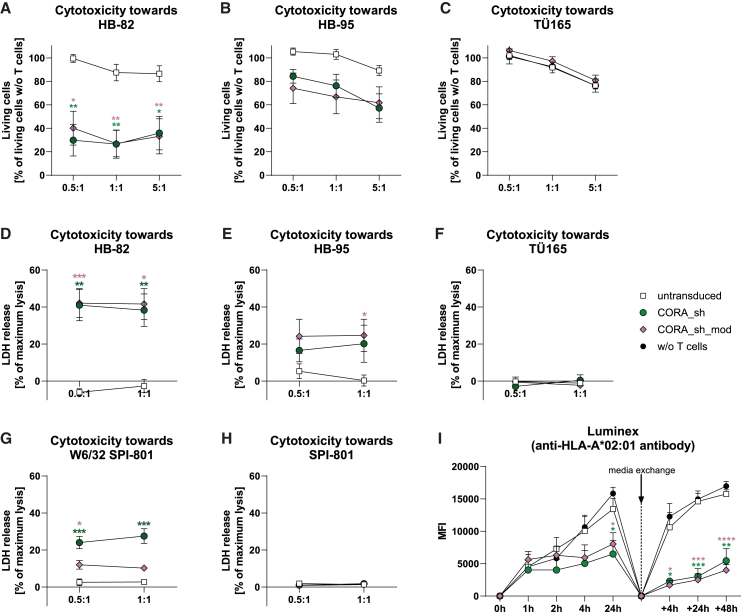
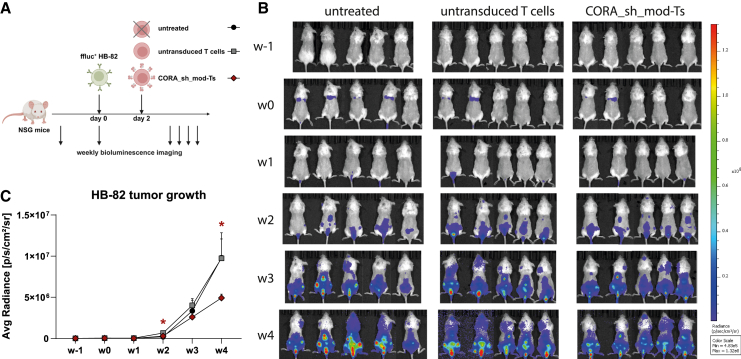
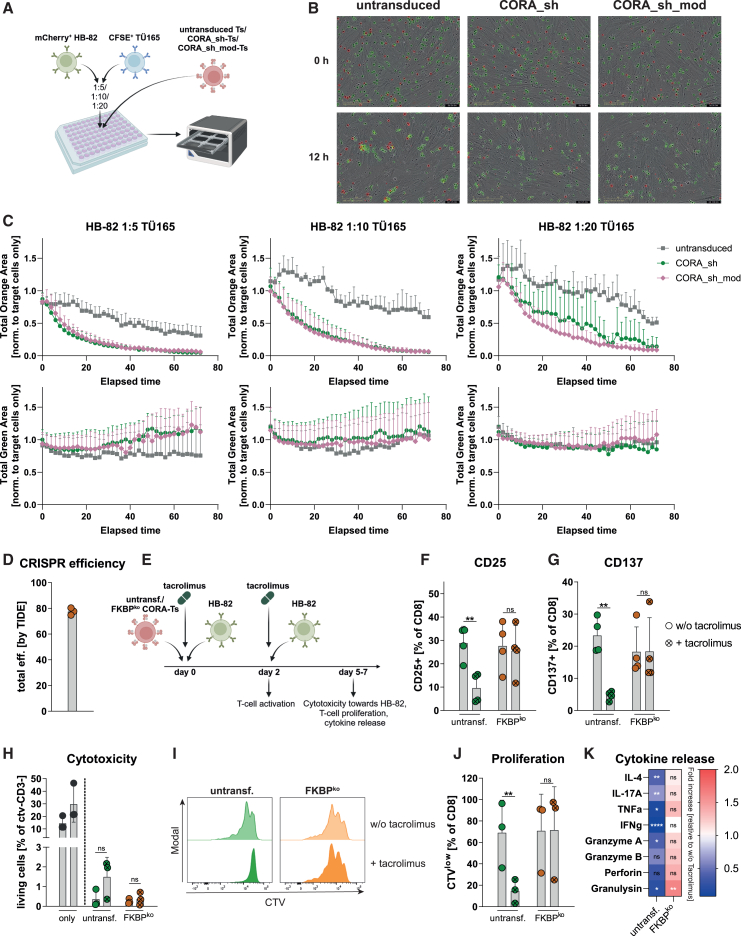
Antibody-mediated rejection (AMR) remains a major complication after solid organ transplantation (SOT). Current treatment options are inefficient and result in drastic impairment of the general immunity. To selectively eliminate responsible alloreactive B cells characterized by anti-donor-HLA B cell receptors (BCRs), we generated T cells overcoming rejection by antibodies (CORA-Ts) engineered with a novel chimeric receptor comprising a truncated donor-HLA molecule as antigen recognition domain. As proof-of-concept, CORA receptors based on HLA-A∗02 were developed. In co-cultures with anti-HLA-A∗02 B cell lines, CORA-Ts were specifically activated, released pro-inflammatory mediators, and exhibited strong cytotoxicity resulting in an effective reduction of anti-HLA-A∗02 antibody release. Significant reduction of growth of an anti-HLA-A∗02 B cell line could be confirmed using an in vivo mouse model. Modification of the CORA receptor effectively abrogated T cell binding, thereby avoiding T cell sensitization. Additionally, using CRISPR-Cas9-mediated knockout of the FKBP12 gene, CORA-Ts were able to resist immunosuppressive treatment with tacrolimus, thereby allowing high efficiency in transplant patients. Our results demonstrate that CORA-Ts are able to specifically eliminate alloreactive, anti-HLA B cells, thus selectively preventing anti-HLA antibody release even under immunosuppressive conditions. This suggests CORA-Ts as potent approach to combat AMR and improve long-term graft survival in SOT patients while preserving their overall B cell immunity.

Keywords: CAR-T cells; HLA; alloreactive B cells; alloreactivity; antibody-mediated rejection; chimeric alloantigen receptor; engineered T cells; mismatch; solid organ transplantation; transplant rejection.


Conflict of interest statement

Declaration of interests The authors declare no competing interests, except that authors A.C.D., C.F., R.B., and B.E.-V. are inventors of a patent describing the CORA-T approach (EP 3733697, WO 2020/221902: Artificial signaling molecule).

Figures

None
Graphical abstract
Figure 1
Figure 1
CORA receptors comprising a truncated HLA-A∗02 complex mediate recognition of patient-derived anti-HLA-A∗02 DSAs (A) CORA receptors comprise HLA-A∗02:01 chains α13, either a short (sh) or a long (lo) spacer domain, a transmembrane domain (TMD) of CD28 and the intracellular signaling domains of 4-1BB and CD3ζ. β2-microglobulin (β2m) is not encoded in the vector. A co-expressed truncated epidermal growth factor receptor (EGFRt) serves as transduction and selection marker. (B) CORA_sh and CORA_lo receptors were expressed in SPI-801 cells and detected by flow cytometry as shown in representative histograms. Untransduced SPI-801 cells served as control. (C) Presence of anti-HLA-A∗02 antibody in the serum of kidney transplant recipients was detected by Luminex. Data are shown as scattered dot plot with mean ± SD, whereby each symbol represents an individual patient (n = 7). (D and E) Sera of the same patients were used in crossmatch assays with HLA-A∗02-negative or -positive PBMCs from healthy donors, as well as SPI-801 cells transduced with CORA receptors. (D) Representative pictures and (E) crossmatch scores indicate CDC based on evaluation of viable cells (green) vs. dead cells (red) after complement addition. (E) Data are shown as mean + SD (n = 4–7). Statistical analysis was performed by using Mann-Whitney test. ∗∗p ≤ 0.01, ∗∗∗p ≤ 0.001.
Figure 2
Figure 2
Hybridoma cells serve as surrogates for anti-HLA B cells releasing anti-HLA DSAs (A) HB-82 (anti-HLA-A∗02), HB-95 (anti-HLA-A/B/C), and TÜ165 (anti-HLA-B∗35ʹ loaded with LPPHDITPY) cells were used as a model for anti-HLA-antibody-releasing B cells. Created with BioRender.com. (B) Surface expression of BCRs was determined by flow cytometry and usage of anti-mouse immunoglobulin G (mIgG) antibody. Data are shown as scattered dot plot with mean ± SD, whereby each symbol represents an independent experiment (n = 3). (C) Release of anti-HLA-A∗02 antibody by HB-82 cells was detected by Luminex (n = 3–10). (D and E) Binding of anti-HLA antibodies present in the supernatant of hybridoma cells to HLA-A∗02-negative or -positive PBMCs from healthy donors (all HLA-B∗35-negative), as well as to SPI-801 cells transduced with CORA receptors was assessed by their ability to mediate CDC in crossmatch assays. (D) Representative pictures and (E) crossmatch scores indicate CDC based on evaluation of viable cells (green) vs. dead cells (red) after complement addition. Respective cells incubated without (w/o) supernatant served as viable controls (n = 1). (F) Cell culture supernatant of HB-82 cells containing anti-HLA-A∗02 antibody was used to stain HLA-A∗02-negative or -positive PBMCs from healthy donors, as well as CORA_sh+ or CORA_lo+ SPI-801 cells. MFI: mean fluorescence intensity.
Figure 3
Figure 3
CORA_sh-Ts mediate effective and target-specific T cell signaling, activation and cytotoxicity CORA receptors with either a short (CORA_sh) or long (CORA_lo) spacer domain were transduced into (A) Jurkat-based reporter cells or (B and C) primary CD8+ T cells. Respective untransduced cells served as controls. (A) After cultivation of transduced reporter cells without (w/o) target cells or with HB-82 cells (anti-HLA-A∗02) in an E:T ratio of 1:1 for 24 h, transcription factor activity was determined by evaluation of NF-κB-induced enhanced cyan fluorescent protein (eCFP) reporter expression by flow cytometry (n = 4). (B) After co-cultivation of transduced CD8+ T cells with HB-82 cells in the indicated E:T ratios for 48 h, expression of CD137 as activation marker was assessed by flow cytometry (n = 6–8). (C) Cytotoxicity by CORA-Ts was assessed by LDH assay. Data are shown as mean ± SD (n = 5). Green and red asterisks indicate comparisons of CORA_sh- and CORA_lo-Ts, respectively, with untransduced T cells. (A–C) Data are shown as scattered dot plot with mean ± SD, whereby each symbol represents an independent donor. Statistical analysis was performed by using Mann-Whitney test. ns: not significant, ∗p ≤ 0.05, ∗∗p ≤ 0.01, ∗∗∗p ≤ 0.001.
Figure 4
Figure 4
Modification of the CORA_sh receptor prevents activation and proliferation of CD8+ T cells CORA_sh receptors comprising either a truncated wild-type or a modified (D227K, T228A; CORA_sh_mod) HLA-A∗02 molecule were transduced into SPI-801 cells, whereby respective HLA-A∗02 domains are expected to dimerize with β2m and to be loaded with SPI-801-derived peptides. (A–K) CD8+ T cells were isolated from HLA-A∗02+ donors and co-cultured with untransduced or transduced SPI-801 cells in an E:T ratio of 1:1 for 7 days. (A–C) Expression of activation markers and (D and E) proliferation of CD8+ T cells as (D) representative histograms or (E) mean ± SD was assessed by flow cytometry. (F–I) Release of soluble mediators into the supernatant was assessed by LEGENDplex. (J–L) Before co-culture with CD8+ T cells, transduced SPI-801 cells were exogenously loaded with the HLA-A∗02-restricted, and CMVpp65-derived peptide NLVPMVATV. (F and G) After co-culture, the frequency of expanded HLA-A∗02/pp65NLV-specific T cells was assessed by multimer staining using flow cytometry and is shown as (F) representative dot plots or (G) relative values, whereby respective frequencies of HLA-A∗02/pp65NLV-specific T cells present in co-cultures with untransduced SPI-801 cells were subtracted from all values. (L) For evaluation of cytotoxicity toward transduced and pp65NLV-loaded SPI-801 cells, they were transduced to express mCherry before and co-cultured with HLA-A∗02/pp65NLV-specific T cells enriched from CD8+ of HLA-A∗02-positive donors using multimer. Live-cell imaging using the Incucyte Live-Cell Analysis System (Sartorius) was performed to evaluate elimination of mCherry-labeled cells. Total red object areas were analyzed by using the Incucyte software (Sartorius) and normalized to the time point of T cell addition, respectively. Data are shown as mean + SEM (n = 3). (A–C, E–I, K) Data are shown as scattered dot plot with mean ± SD, whereby each symbol represents an independent donor (n = 6). Statistical analysis was performed by using (A–C and E) Mann-Whitney test and (K) Wilcoxon matched-pairs signed rank test. ns: not significant, ∗p ≤ 0.05, ∗∗p ≤ 0.01.
Figure 5
Figure 5
CORA_sh- and CORA_sh_mod-Ts exhibit effective and target-specific T cell signaling, activation, and cytokine release CORA_sh and CORA_sh_mod receptors were transduced into (A, B, F, G) Jurkat-based reporter cells or (C–E and H–J) primary CD8+ T cells. Respective untransduced cells served as controls. (A, B, F, and G) After cultivation of transduced reporter cells without (w/o) target cells or with the indicated target cells in an E:T ratio of 1:1 for 24h (A and F) NF-κB-induced eCFP or (B and G) NFAT-induced eGFP reporter expression was evaluated by flow cytometry (n = 4). (C and H) Transduced and untransduced (ø) T cells were co-cultured with the indicated target cells in an E:T ratio of 1:1 for 48 h. Release of soluble mediators into the supernatant was assessed by LEGENDplex. Fold increase to respective T cell cultures w/o target is shown as mean (n = 4–8). (D, E, I, and J) CORA-Ts were co-cultured with target cells in the indicated E:T ratios for 48 h. Expression of activation markers was evaluated by flow cytometry. Data are shown as scattered dot plot with mean ± SD, whereby each symbol represents an independent donor (n = 4–10). (A–J) Statistical analysis was performed by using two-way ANOVA with Tukey’s multiple comparisons test. ns: not significant, ∗p ≤ 0.05, ∗∗p ≤ 0.01, ∗∗∗p ≤ 0.001, ∗∗∗∗p ≤ 0.0001.
Figure 6
Figure 6
CORA_sh- and CORA_sh_mod-Ts mediate target-specific cytotoxicity resulting in effective reduction of anti-HLA antibody release (A–H) CORA_sh- and CORA_sh_mod-Ts were co-cultured with indicated target cells in the indicated E:T ratios for 48 h. Respective co-cultures with untransduced T cells served as controls. (A–C) Prior to the co-culture, target cells were labeled with CTV to determine the frequency of living target cells (CTV+7-AAD) after co-culture (n = 6–7). Frequencies of living target cells in co-cultures with indicated T cells were then normalized to corresponding frequencies of viable target cells in cultures without (w/o) T cells. (D–H) Co-culture supernatants were evaluated for LDH levels as indicator for T cell-mediated cytotoxicity (n = 4–7). (I) Generated CORA-Ts were co-cultured with HB-82 cells in an E:T ratio of 5:1. At the indicated time points, supernatants were analyzed for released anti-HLA-A∗02 antibody by Luminex. After 24 h, co-culture media were replaced by fresh medium, after which further measurements were performed at indicated time points (“+”). Data are shown as mean + SEM (n = 5). Significances are shown in comparison with HB-82 cultured without (w/o) T cells and evaluated at the respective same time points. (A–H) Data are shown as mean ± SEM. Statistical analysis was performed by using two-way ANOVA with Dunnett’s multiple comparisons test. Significances are shown in comparison with respective untransduced T cells cultured in the same E:T ratio. ∗p ≤ 0.05, ∗∗p ≤ 0.01, ∗∗∗p ≤ 0.001, ∗∗∗∗p ≤ 0.0001.
Figure 7
Figure 7
CORA_sh_mod-Ts significantly reduce anti-HLA B-cell growth in vivo (A) Female NSG mice were injected 5 × 105 ffluc+ HB-82 cells followed by injection of 5 × 105 CORA_sh_mod-Ts or untransduced T cells 2 days later. Respective mice injected with ffluc+ HB-82 cells but not treated with T cells (untreated) served as controls. CORA_sh_mod-Ts were generated by transduction of CD4+ and CD8+ T cells and expansion using a protocol similar to manufacturing of CAR-Ts on the CliniMACS Prodigy. (B and C) Bioluminescence imaging was performed every week (w) to assess growth of HB-82 cells. Images in w0 were taken 15–20 min after injection of ffluc+ HB-82 cells. (C) Quantification of bioluminescence was performed by setting a defined square area set on each animal to obtain average (Avg) radiance values. Data are shown as mean + SEM (n = 5). Statistical analysis was performed by using Mann-Whitney test. Significances are shown in comparison with respective mice treated with untransduced T cells at the same time points. ∗p ≤ 0.05.
Figure 8
Figure 8
CORA-Ts mediate specific elimination of HLA-specific B cells in target-cell mixtures and can be modified to resist tacrolimus treatment (A) CORA_sh- and CORA_sh_mod-Ts were co-cultured in a 1:1 ratio with target-cell mixtures composed of mCherry+ HB-82 with CFSE+ TÜ165 cells in the indicated ratios. Respective co-cultures with untransduced T cells served as controls. Live-cell imaging using the Incucyte Live-Cell Analysis System (Sartorius) was performed to evaluate specific target-cell elimination. (B) Representative pictures of selected time points of co-cultures with target-cell mixtures in a 1:5 ratio. (C) Total orange or green object areas were analyzed by using the Incucyte software (Sartorius) and normalized to respective values of target-cell mixtures cultured without T cells (target cells only) for every time point. Data are shown as mean ± SD of two independent experiments with two donors each. In one experiment, HFF cells were seeded on all wells as scaffold 1 day before setting the triple co-cultures. (D–K) CORA_sh receptors were transduced into CD8+ T cells, followed by transfection with FKBP12-targeting RNP complex (FKBPko). Respective untransfected CORA_sh-Ts served as controls (untransf.). (D) CRISPR efficiency was assessed by analysis of sequencing results by TIDE. (E–G) CORA-Ts were co-cultured with HB-82 cells for in an E:T ratio of 1:1 for 48 h in presence or absence (w/o) of 5 ng/mL tacrolimus, after which expression of activation markers was evaluated by flow cytometry (n = 4). (E and H–K) Prior to the co-culture, CORA-Ts were labeled with CTV. After 2 days of co-culture, CORA-Ts were re-stimulated with the same number of HB-82 cells (n = 3). After 5–7 days of co-culture, (H) the frequency of living target cells (CTVCD37-AAD) was assessed by flow cytometry. HB-82 cells cultured alone (only) for 5–7 or 3–5 days, respectively, are shown as first and second bar. (I and J) Proliferation of CORA-Ts was assessed via CTV dilution assay by flow cytometry and is shown as (I) representative histograms or (J) mean. (K) Release of soluble mediators into the supernatant was assessed by LEGENDplex. Fold increase to respective co-cultures in absence of tacrolimus is shown as mean. Statistical analysis was performed by using two-way ANOVA with Šídák’s multiple comparisons test. (D, F–H, and J) Data are shown as scattered dot plot with mean ± SD, whereby each symbol represents an independent donor. Statistical analysis was performed by using two-way ANOVA with Tukey’s multiple comparisons test. ns: not significant, ∗p ≤ 0.05, ∗∗p ≤ 0.01, ∗∗∗∗p ≤ 0.0001.

References

    1. Chong A.S., Rothstein D.M., Safa K., Riella L.V. Outstanding questions in transplantation: B cells, alloantibodies, and humoral rejection. Am. J. Transpl. 2019;19:2155–2163. doi: 10.1111/ajt.15323. - DOI - PMC - PubMed
    1. Hart A., Singh D., Brown S.J., Wang J.H., Kasiske B.L. Incidence, risk factors, treatment, and consequences of antibody-mediated kidney transplant rejection: A systematic review. Clin. Transpl. 2021;35 doi: 10.1111/ctr.14320. - DOI - PubMed
    1. Böhmig G.A., Eskandary F., Doberer K., Halloran P.F. The therapeutic challenge of late antibody-mediated kidney allograft rejection. Transpl. Int. 2019;32:775–788. doi: 10.1111/tri.13436. - DOI - PMC - PubMed
    1. Valenzuela N.M., Reed E.F. Antibody-mediated rejection across solid organ transplants: manifestations, mechanisms, and therapies. J. Clin. Invest. 2017;127:2492–2504. doi: 10.1172/jci90597. - DOI - PMC - PubMed
    1. Schlößer H.A., Thelen M., Dieplinger G., von Bergwelt-Baildon A., Garcia-Marquez M., Reuter S., Shimabukuro-Vornhagen A., Wennhold K., Haustein N., Buchner D., et al. Prospective Analyses of Circulating B Cell Subsets in ABO-Compatible and ABO-Incompatible Kidney Transplant Recipients. Am. J. Transpl. 2017;17:542–550. doi: 10.1111/ajt.14013. - DOI - PubMed

MeSH terms

LinkOut - more resources