. 2025 Mar 21;6(1):103557.
doi: 10.1016/j.xpro.2024.103557. Epub 2025 Jan 11.

Protocol for high-yield bacterial expression and purification of the voltage-dependent anion channel 1 for high-throughput biophysical assays

Affiliations

Protocol for high-yield bacterial expression and purification of the voltage-dependent anion channel 1 for high-throughput biophysical assays

Stefano Conti Nibali et al. STAR Protoc. .

Abstract

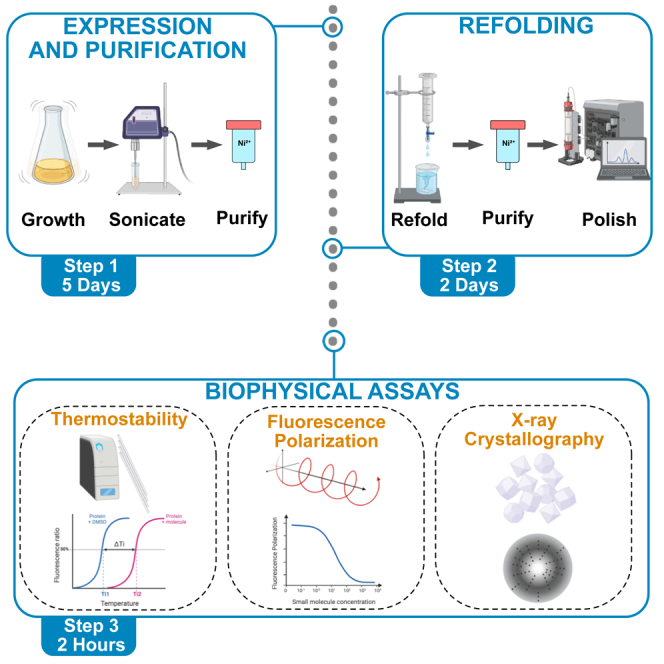
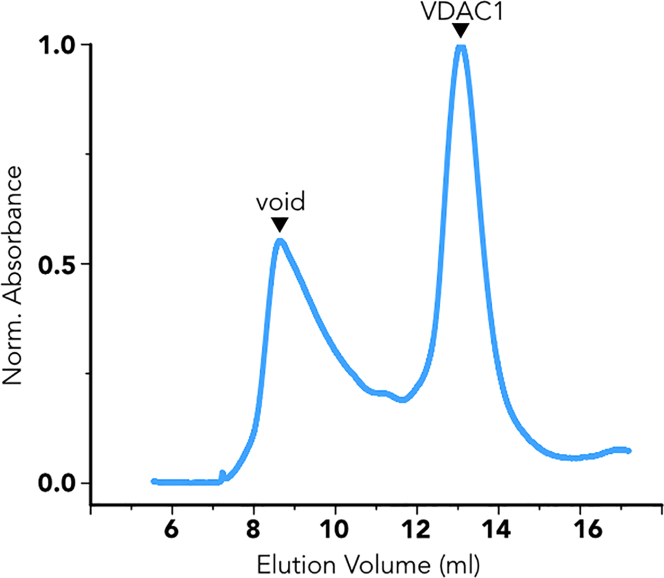
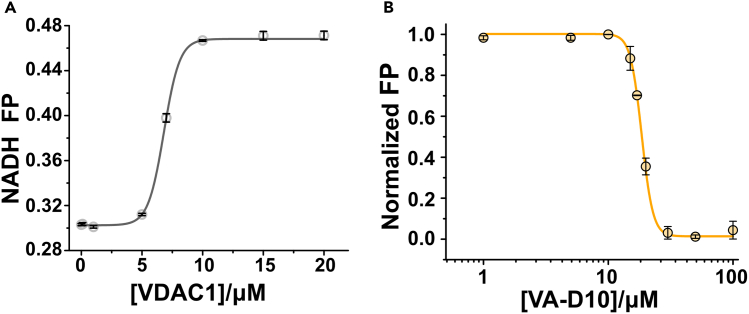
Voltage-dependent anion channel 1 (VDAC1) is a key protein in cellular metabolism and apoptosis. Here, we present a protocol to express and purify milligram amounts of recombinant VDAC1 in Escherichia coli. We detail steps for a fluorescence polarization-based high-throughput screening assay using NADH displacement, along with procedures for thermostability, fluorescence polarization, and X-ray crystallography. In this context, we demonstrate how 2-methyl-2,4-pentanediol (MPD), a crystallization reagent, interferes with VDAC1 small-molecule binding, hindering the detection of these ligands in the crystal. For complete details on the use and execution of this protocol, please refer to Conti Nibali et al.1.

Keywords: Biophysics; Protein Biochemistry; Protein expression and purification; X-ray Crystallography.


Conflict of interest statement

Declaration of interests The authors declare no competing interests.

Figures

None
Graphical abstract
Figure 1
Figure 1
Set-up of the refolding apparatus using a three-way valve to set the appropriate flow-rate
Figure 2
Figure 2
Outcomes of the size exclusion chromatography (SEC) of mVDAC1 without reducing the detergent concentration This profile has been obtained by refolding the protein in the presence of high detergent concentration (i.e., skipping step 14). ‘void’ indicates the peak corresponding to aggregated proteins; ‘VDAC1’ indicates the peak corresponding to the monomeric protein.
Figure 3
Figure 3
Expected outcomes of the SEC of mVDAC1 SEC elution profile of refolded VDAC1 protein. ‘void’ indicates the peak corresponding to aggregated proteins; ‘VDAC1’ indicates the peak corresponding to the monomeric protein. Only fractions corresponding to monomeric protein (frac) were collected and used for further experiments. The inset shows the SDS-PAGE analysis of the selected fractions (frac) from which the protein purity is estimated >95%. ‘M’ indicates the molecular weight marker. The gel is stained with Coomassie blue dye.
Figure 4
Figure 4
Representative denaturation curves of mVDAC1 in LDAO (A) Representative denaturation curve of mVDAC1 in LDAO. The inflection temperature for mVDAC1 (30 μM) in Crystal buffer is 58.8 ± 0.09°C. (B) Representative denaturation curves of mVDAC1 in LDAO in presence of 0.5% of DMSO or DMF. The inflection temperatures for mVDAC1 (0.9 mg/mL) in Crystal buffer in presence of 0.5% DMSO or DMF are 57.8 ± 0.09°C and 57.4 ± 0.10°C respectively.
Figure 5
Figure 5
Expected outcomes of the SEC of mVDAC1 SEC elution profile of refolded hVDAC1 stored at 4°C for 7 days. ‘void’ indicates the peak corresponding to aggregated proteins.
Figure 6
Figure 6
Representative denaturation curves of mVDAC1 in LDAO (A) Representative denaturation curves of mVDAC1 (30 μM) in LDAO after treatment with different VA molecules at a final concentration of 1 mM. Black curves represent the denaturation profile of the protein pre-treated with DMF (control), and the red one represent the protein pre-treated with the indicated small molecule. Temperature denaturation inflection point (Ti) shifts toward higher temperatures in the presence of the VA molecule D10 (ΔTi = 4.9 ± 0.1) indicating protein stabilization/binding. (B) Representative denaturation curves of mVDAC1 (30 μM) in LDAO after treatment with a mock VA molecule at a final concentration of 1 mM. Black curves represent the denaturation profile of the protein pre-treated with DMF (control), and the red one is the protein pre-treated with the indicated small molecule. Temperature denaturation inflection point (Ti) does not shift toward higher temperatures in the presence of small molecule E1 (ΔTi = 0.02 ± 0.01) indicating protein is not stabilized/binding. Data are expressed as mean ± SEM (n = 3).
Figure 7
Figure 7
Ti normalized (A) Δ inflection temperatures (ΔTi) values of mVDAC1 wild-type and mutants were obtained by subtracting the ΔTiU (untreated protein) from the ΔTiT (treated protein). Data are expressed as mean ± SEM (n = 3). (B) ΔΔ inflection temperatures (ΔΔTi) values were obtained by subtracting the ΔTi of mVDAC1 mutants from the ΔTi of wild-type protein. Positive or negative ΔΔTi values show the effect of stabilizing and destabilizing mutations on inflection temperature after treatment with VA molecules, respectively. Data are expressed as mean ± SEM (n = 3).
Figure 8
Figure 8
Expected outcomes of the Fluorescence polarized assay of mVDAC1 (A) Binding of the NADH (at 5 μM) to increasing concentrations of mVDAC1 measured by fluorescence polarization (FP). The dissociation constant (KD) obtained by fitting the fluorescence polarization values and the protein concentrations into a nonlinear regression model curve in Origin Lab is about 7 μM. (B) Displacement curves of the NADH (5 μM) from mVDAC1 with increased concentrations of small-molecule D10. The molecule can compete with NADH binding with an apparent KD in the micromolar range (KD = 18.5 ± 0.2). Data are expressed as mean ± SEM (n = 3). Reproduced from.
Figure 9
Figure 9
mVDAC1 crystallization and MPD effect on purified protein (A) Crystals of mVDAC1 in bicelles. Exemplary crystals are indicated by the arrows. (B) Exemplary diffraction pattern of mVDAC1 crystals. (C) Displacement curves of the NADH (5 μM) from mVDAC1 at increased concentrations of MPD. MPD competes more with NADH binding when DMSO is present in the assay buffer. Data are expressed as mean ± SEM (n = 3). (D) Crystal structures of mVDAC1 in the presence of 10% DMSO (this study, PDB: 9GNG) compared to the published structure apo-VDAC1 (PDB: 3EMN3).

Similar articles

Cited by

References

    1. Conti Nibali S., De Siervi S., Luchinat E., Magrì A., Messina A., Brocca L., Mantovani S., Oliviero B., Mondelli M.U., De Pinto V., et al. VDAC1-interacting molecules promote cell death in cancer organoids through mitochondrial-dependent metabolic interference. iScience. 2024;27 doi: 10.1016/j.isci.2024.109853. - DOI - PMC - PubMed
    1. Ujwal R., Cascio D., Colletier J.P., Faham S., Zhang J., Toro L., Ping P., Abramson J. The crystal structure of mouse VDAC1 at 2.3 (2008). A resolution reveals mechanistic insights into metabolite gating. Proc. Natl. Acad. Sci. USA. 2008;105:17742–17747. doi: 10.1073/pnas.0809634105. - DOI - PMC - PubMed
    1. Singh S.M., Panda A.K. Solubilization and refolding of bacterial inclusion body proteins. J. Biosci. Bioeng. 2005;99:303–310. doi: 10.1263/jbb.99.303. - DOI - PubMed
    1. Shi Y., Jiang C., Chen Q., Tang H. One-step on-column affinity refolding purification and functional analysis of recombinant human VDAC1. Biochem. Biophys. Res. Commun. 2003;303:475–482. doi: 10.1016/s0006-291x(03)00359-0. - DOI - PubMed
    1. Engelhardt H., Meins T., Poynor M., Adams V., Nussberger S., Welte W., Zeth K. High-level expression, refolding and probing the natural fold of the human voltage-dependent anion channel isoforms I and II. J. Membr. Biol. 2007;216:93–105. doi: 10.1007/s00232-007-9038-8. - DOI - PubMed

MeSH terms

Substances

LinkOut - more resources