. 2025 Jan 12;15(1):1761.
doi: 10.1038/s41598-024-84972-2.

Human parietal epithelial cells as Trojan horses in albumin overload

Affiliations

Human parietal epithelial cells as Trojan horses in albumin overload

Giovanna Priante et al. Sci Rep. .

Abstract

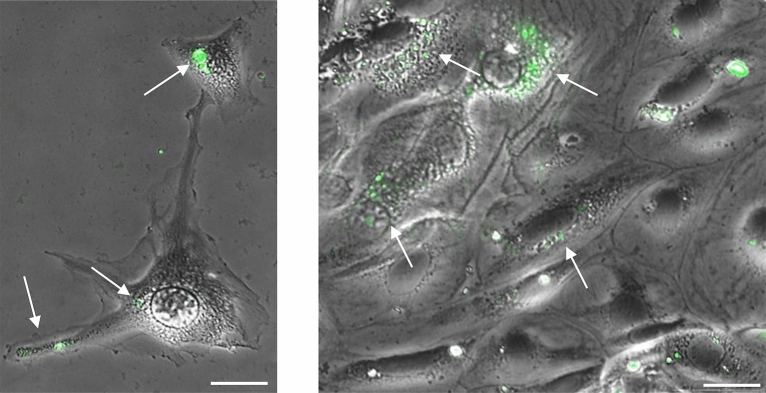
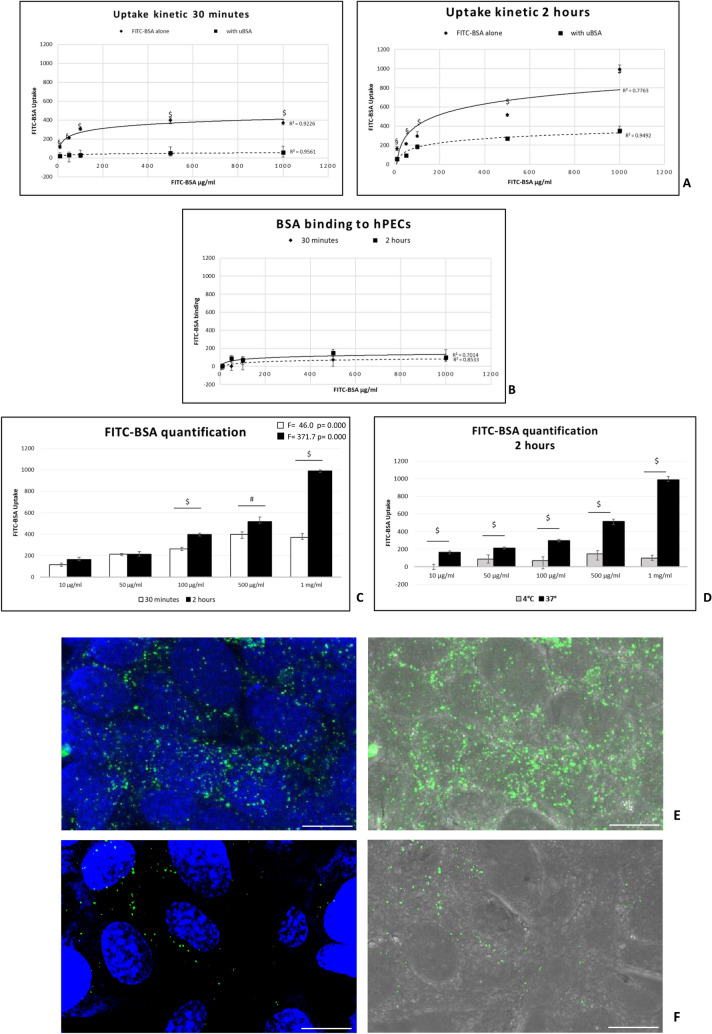
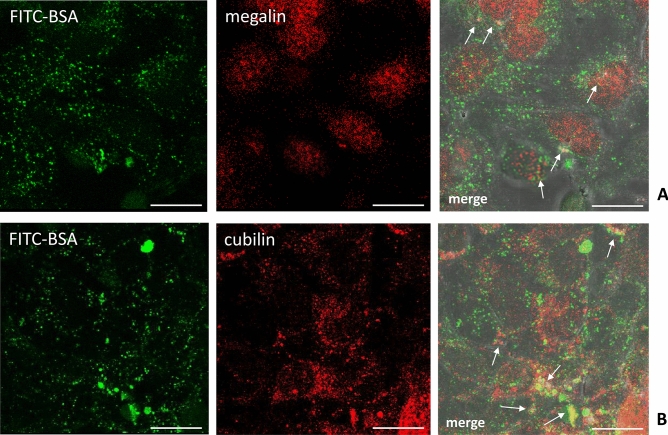
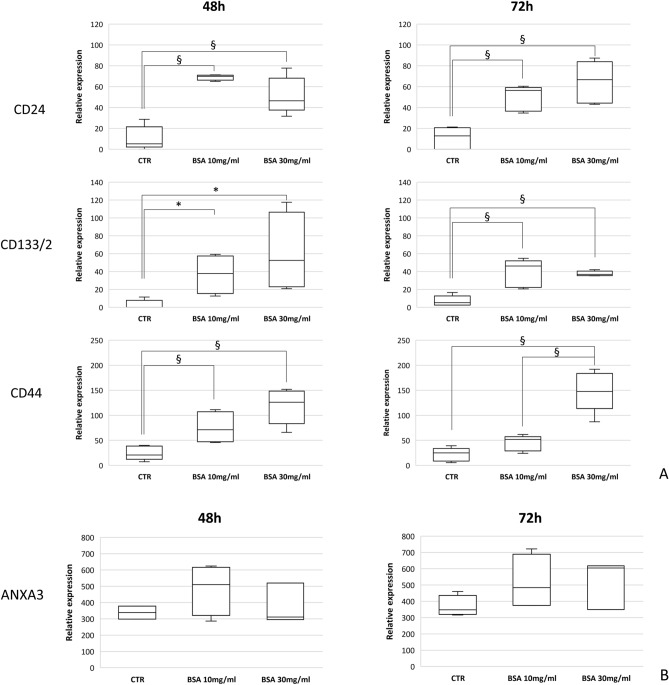
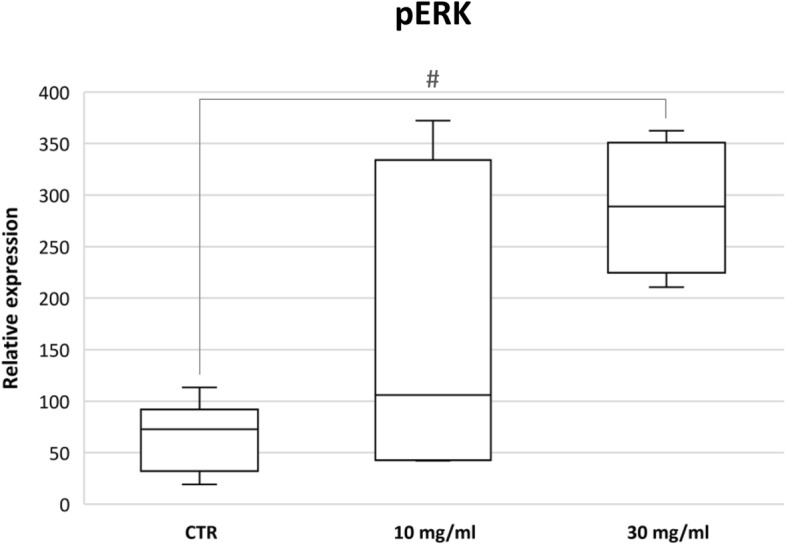
Parietal Epithelial Cells (PECs) activation and proliferation are common to several distinct forms of glomerulopathies. Due to several stimuli, PECs can change to a progenitor (CD24+ and CD133/2+) or a pro-sclerotic (CD44+) phenotype. In addition, PECs, which are constantly exposed to filtered albumin, are known to be involved in albumin internalization, but how this mechanism occurs is unknown. We hypothesized that PECs can transport albumin via receptor-mediated endocytosis and that albumin overload may affect the state of PECs. Conditionally immortalized human PECs (hPECs) were incubated with different albumin concentrations at different times. Albumin internalization studies were performed. Protein expression was assessed using In-Cell Western and immunofluorescence. Cell morphology was analyzed by phase-contrast microscopy and F-actin staining. We demonstrate that hPECs internalize albumin via receptor-mediated mechanisms. Under albumin stimulation, megalin, cubilin, ClC-5, CD133/2, CD24, and CD44 were upregulated. The increase of pERK1/2, the upregulation of ROCK1, ROCK2, caspase -3, -6, and -7, and the morphological changes associated with loss of F-actin fibers indicated that inflammation, proliferation and apoptosis mechanisms had been activated. Our results demonstrate that long-term exposure to high doses of albumin induces up-regulation of molecules involved in the tubular protein uptake machinery and suggest that albumin overload is able to trigger a regenerative process as well as an activation state which might lead in vivo to glomerular crescent formation.

Keywords: Albumin; CD44; ClC-5; Cubilin; Megalin; hPECs.


Conflict of interest statement

Declarations. Competing interests: The authors declare no competing interests.

Figures

Fig. 1
Fig. 1
Internalization of fluorescent albumin in hPECs. Images disclose the ability of hPECs to internalize albumin (FITC-BSA 10 μg/ml, 37 °C). Signals were detected as green vesicles (arrows). All images were acquired using a DMI6000CS-TCS SP8 fluorescence microscope (Leica Microystems) placed within a temperature-controlled enclosure set at 37 °C and 5% CO2 for live cell imaging. Images are representative of two separate experiments. Objective 20X/0.4. Scale bar 50 μm.
Fig. 2
Fig. 2
Uptake of fluorescent albumin in hPECs. (A) Showed FITC-BSA internalisation after incubation of hPECs with different concentration of FITC-BSA, at 37 °C alone (continuous line) or in presence of 100-fold excess of unlabeled BSA (uBSA, dotted line) after 30 min and 2 h. Albumin uptake follows receptor-mediated profile. FITC-BSA was significantly reduced by treatment with 100-fold excess of uBSA (dotted line). Data are represented as fluorescence absorbance values normalized to cell number. Results are from three different experiments in triplicate. Statistical analysis was carried out using Mann–Whitney U-test, *p < 0.05, **p < 0.005. (B) Showed results from BSA binding experiments. hPECs were incubated with different concentration of FITC-BSA at 4 °C for 30 min and 2 h. (C) Showed FITC-BSA quantification in hPECs at 37 °C after 30 min and 2 h. Albumin uptake increased significantly in a dose-dependent manner both at 30 min than 2 h. Data are represented as fluorescence absorbance values normalized to cell number. Results are from three different experiments in triplicate. Statistical analysis was carried out using ANOVA and Bonferroni’s correction F = 371.7, at 2 h, p < 0.0001; F = 46.0 at 30 min, p < 0.0001. A significantly difference was found between 30 min and 2 h at 100 µg/ml, 500 µg/ml and 1 mg/ml of FITC-BSA #p < 0.005, $p < 0.0001 (Mann–Whitney U-test). (D) Showed FITC-BSA quantification in hPECs at 4 °C and 37 °C after 2 h of treatment with different concentration of FITC-BSA. Data are represented as fluorescence absorbance values normalized to cell number. Results are from three different experiments in triplicate. A significantly difference was found between FITC-BSA at 4 °C versus 37 °C, $p < 0.0001 at all concentrations (Mann–Whitney U-test). (E, F) showed representative confocal images of cultured hPECs in presence of FITC-BSA (1 mg/ml) alone (E) or after pre-treatment (2 h) with 100-fold excess of uBSA (F). FITC-BSA appears in green cytoplasmatic vesicles. DNA stained with DRAQ5™ is shown in blue. The images on the left are merge of fluorescence signals (FITC-BSA and nuclei); the images on the right bright field (differential interference contrast, DIC) and fluorescent signal of FITC-BSA. Objective 63X/1.4, oil immersion. Scale bar 50 μm. Images are representative of two separate experiments.
Fig. 3
Fig. 3
hPEC express the macromolecular albumin uptake system. (AD): Immunostaining of representative images of hPEC disclosing: (A) ANXA3 (red), (B) ClC-5 (red), (C) megalin (red), (D) cubilin (green). Nuclei were counterstained with DAPI (blue staining). The images are the overlay of the bright field and fluorescent signals. Positivity for ANXA3 was present in all cells, confirming that we had mature PECs. The positivity for ClC-5, megalin and cubilin was present in some but not all PECs. Images are representative of two separate experiments. Objective 20X/0.4. Scale bar 50 μm. (EG) representative confocal images of hPEC disclosing: (E) ClC-5, (F) megalin, (G) cubilin. All markers are shown in red (Alexa Fluor™ 594) (Left images); DNA stained with DRAQ5™ is shown in blue. The images on the middle are merge of fluorescence signals (markers and nuclei). The images on the right are the overlay of bright field (differential interference contrast, DIC) with fluorescent signal of the different markers. Images are representative of two separate experiments and were analysed by a fluorescence microscope DMI6000CS-TCS SP8 (Leica Microsystem) in confocal mode, with a Z-interval of 1 μm z-interval. Objective: 63X/1.4, oil immersion. Scale bar = 50 μm.
Fig. 4
Fig. 4
Immunofluorescence microscopy of colocalization of FITC- BSA and megalin or cubilin. Representative immunofluorescent images by confocal microscopy showed protein expression and colocalisation of megalin (A) and cubilin (B) with FITC-BSA. FITC-BSA is shown in green, megalin (A, Alexa Fluor™ 594) and cubilin (B, Alexa Fluor™ 594) in red. In merge images white arrows indicate colocalization as yellow/orange signal. Images are representative of two separate experiments and were analysed by a fluorescence microscope DMI6000CS-TCS SP8 (Leica Microsystem) in confocal mode, with a Z-interval of 1 μm z-interval. Objective: 63X/1.4, oil immersion. Scale bar = 50 μm.
Fig. 5
Fig. 5
Inhibition of BSA-FITC uptake. (A) Effect of receptor-associated protein (RAP) on FITC-BSA uptake in hPECs. hPECs were preincubated with different amounts of RAP for 1 h (white bargraphs) followed by incubation with 1 mg/ml FITC-BSA for 2 h. Black bargraphs display FITC-BSA alone. Data are represented as fluorescence absorbance values normalized to cell number. Results are from two independent experiments performed in triplicate *p < 0.05 (Mann–Whitney U-test). (B) Effect of a sheep polyclonal anti-human Cubilin IgG antibody on FITC-BSA uptake in hPECs. hPECs were preincubated with different amounts of a sheep polyclonal anti-human Cubilin IgG antibody for 3 h (gray bargraphs) followed by incubation with 1 mg/ml FITC-BSA for 2 h. Black bargraphs display FITC-BSA alone. Data are represented as fluorescence absorbance values normalized to cell number. Results are from two independent experiments performed in triplicate *p < 0.05 (Mann–Whitney U-test). (C) Representative confocal images of inhibition by RAP and a sheep polyclonal anti-human Cubilin IgG antibody on FITC-BSA uptake. FITC-BSA was detected as green signal. Images are representative of two separate experiments and were analysed by a fluorescence microscope DMI6000CS-TCS SP8 (Leica Microsystem) in confocal mode, with a Z-interval of 1 μm z-interval. Objective: 63X/1.4, oil immersion. Scale bar = 50 μm.
Fig. 6
Fig. 6
Protein expression of the macromolecular albumin uptake system under albumin overload. Protein expression analysis was performed by ICW. Data are represented as absorbance values normalised to cell number. Results are from two independent experiments performed in triplicate. CTR: unstimulated control cells, *p < 0.05, §p < 0.01 (Mann–Whitney U-test).
Fig. 7
Fig. 7
Protein expression of hPECs markers. Protein expression analysis was performed by ICW. (A) Protein expression of CD24, CD133/2 and CD44 markers. (B) Protein expression of ANXA3 marker. Data are represented as absorbance values normalized to cell number. Results are from two independent experiments performed in triplicate. CTR: unstimulated control cells, *p < 0.05, §p < 0.01 (Mann–Whitney U-test).
Fig. 8
Fig. 8
Evaluation of hPECs morphology after albumin overload. (A) Representative microscopy images of hPECs by differential interference contrast (DIC) (grey-scale images) showing cell shape changes at different time and albumin concentration. CTR: untreated cells. Images were acquired using a DMI6000CS-TCS SP8 fluorescence microscope (Leica Microystems) with 40X/0.60 objective. Scale bar 50 μm. (B) Phalloidin fluorescence labelling of F-actin in hPECs after albumin overload for 72 h. Images demonstrating the pattern of F-actin filaments distributed as bundles of stress fibers along the cell axis, arranged neatly and unbranched in untreated cells (CTR). Boxed photos showing zoomed-in area. Stress fibers of the actin cytoskeleton were disrupted: a marked redistribution of F-actin fibers toward the periphery was observed (10 mg/ml), markedly and completely unwrapped at the higher concentration (30 mg/ml). Red: actin; Blue: DAPI. Fluorescence microscope images are representative of three separate experiments. Images were acquired using a DMI6000CS-TCS SP8 fluorescence microscope (Leica Microystems) with 20X/0.4 objective. Scale bar 50 μm. Merge: phalloidin/actin with DAPI. Scale bar 50 μm. (C) Quantification of F-actin intensity: data are reported as mean ± SD of the measured gray-scale values of images from each condition and normalized to cell number counted on the same measured cell area. Results are from three independent experiments **p < 0.005, F = 20.75, using ANOVA and by Bonferroni’s correction.
Fig. 9
Fig. 9
Protein expression of ROCK1 and ROCK2 after albumin overload for 72 h. Protein expression analysis was performed by ICW. Data are represented as absorbance values normalized to cell number. Results are from two independent experiments performed in triplicate. CTR: unstimulated control cells, $p < 0.0001 (Mann–Whitney -test).
Fig. 10
Fig. 10
Protein expression of cleaved Caspase -3, -6 and -7 after albumin overload for 72 h. Protein expression analysis was performed by ICW. Data are represented as absorbance values normalized to cell number. Results are from two independent experiments performed in triplicate. CTR: unstimulated control cells, $p < 0.0001 (Mann–Whitney -test).
Fig. 11
Fig. 11
Evaluation of pERK1/2 in hPECs under albumin overload for 72 h. The boxplots express the phosphlated ERK1/2 evaluated by ICW. Data are represented as absorbance values normalized to cell number. Results are from two independent experiments performed in triplicate. CTR: unstimulated control cells, #p < 0.005 (Mann–Whitney U-test).

References

    1. Zhao, X. et al. Albumin induces CD44 expression in glomerular parietal epithelial cells by activating extracellular signal-regulated kinase 1/2 pathway. J. Cell Physiol.234, 7224–7235 (2019). - PMC - PubMed
    1. Bronstein, R., Pace, J., Gowthaman, Y., Salant, D. J. & Mallipattu, S. K. Podocyte-parietal epithelial cell interdependence in glomerular development and disease. J. Am. Soc. Nephrol.34, 737–750 (2023). - PMC - PubMed
    1. Ceol, M. et al. Human parietal epithelial cells (PECs) and proteinuria in lupus nephritis: A role for ClC-5, megalin, and cubilin?. J. Nephrol.36, 2499–2506 (2023). - PMC - PubMed
    1. Kietzmann, L. et al. MicroRNA-193a regulates the transdifferentiation of human parietal epithelial cells toward a podocyte phenotype. J. Am. Soc. Nephrol.26, 1389–1401 (2015). - PMC - PubMed
    1. Kuppe, C. et al. Common histological patterns in glomerular epithelial cells in secondary focal segmental glomerulosclerosis. Kidney Int.88, 990–998 (2015). - PubMed

Publication types

Substances

LinkOut - more resources