. 2025 Jan 12;16(1):614.
doi: 10.1038/s41467-025-55847-5.

Integration of clinical, pathological, radiological, and transcriptomic data improves prediction for first-line immunotherapy outcome in metastatic non-small cell lung cancer

Affiliations

Integration of clinical, pathological, radiological, and transcriptomic data improves prediction for first-line immunotherapy outcome in metastatic non-small cell lung cancer

Nicolas Captier et al. Nat Commun. .

Abstract

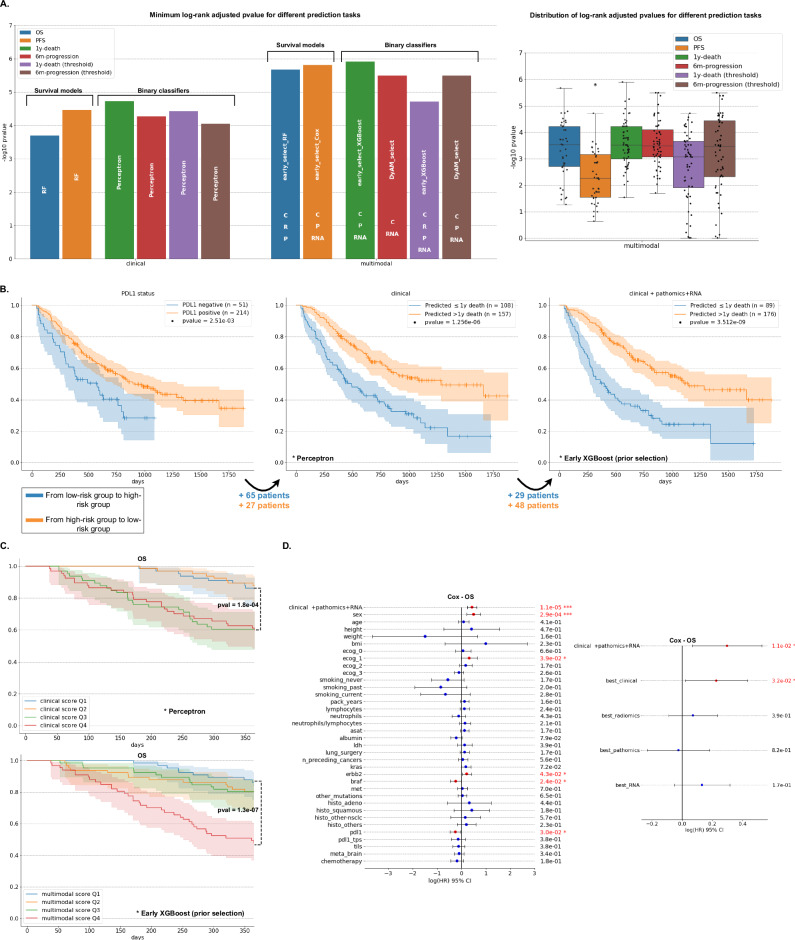
Immunotherapy is improving the survival of patients with metastatic non-small cell lung cancer (NSCLC), yet reliable biomarkers are needed to identify responders prospectively and optimize patient care. In this study, we explore the benefits of multimodal approaches to predict immunotherapy outcome using multiple machine learning algorithms and integration strategies. We analyze baseline multimodal data from a cohort of 317 metastatic NSCLC patients treated with first-line immunotherapy, including positron emission tomography images, digitized pathological slides, bulk transcriptomic profiles, and clinical information. Testing multiple integration strategies, most of them yield multimodal models surpassing both the best unimodal models and established univariate biomarkers, such as PD-L1 expression. Additionally, several multimodal combinations demonstrate improved patient risk stratification compared to models built with routine clinical features only. Our study thus provides evidence of the superiority of multimodal over unimodal approaches, advocating for the collection of large multimodal NSCLC datasets to develop and validate robust and powerful immunotherapy biomarkers.


Conflict of interest statement

Competing interests: Nicolas Girard has a consulting or advisory role for the following companies: Abbvie, AMGEN, AstraZeneca, BeiGene, Bristol-Myers Squibb, Daiichi Sankyo/Astra Zeneca, Gilead Sciences, Ipsen, Janssen, LEO Pharma, Lilly, MSD, Novartis, Pfizer, Roche, Sanofi, Takeda. The other authors declare no competing interests.

Figures

Fig. 1
Fig. 1. Survival of NSCLC patients and Venn diagram summarizing the multimodal cohort.
A OS and PFS Kaplan-Meier survival curve (solid lines) for the whole NSCLC cohort (n = 311 for OS and n = 316 for PFS) with a 95% confidence interval (shaded areas). Patients are stratified with respect to their first-line therapy, either pembrolizumab alone or pembrolizumab + chemotherapy. Log-rank p-values are reported to characterize the separation of the survival curves. B OS and PFS Kaplan-Meier survival curves (solid lines) with 95% confidence interval (shaded areas) and log-rank p-values for the patients with available PD-L1 expression (n = 295 for OS and n = 300 for PFS). Patients are stratified with respect to their PD-L1 status (positive vs negative). C OS Kaplan-Meier survival curves (solid lines) with 95% confidence interval (shaded areas) and log-rank p-values for the 43 patients with available TMB and the 174 patients with available TILs status. For the TMB, patients are stratified with a threshold of 15 mutations per megabase (see Methods). For TILs, patients are stratified with respect to their positive vs negative TILs status. D Overview of the multimodal cohort with a Venn diagram. The four data modalities and their intersections are represented (i.e., PET/CT images, clinical data, pathological slides, and bulk RNA-seq profiles). Source data are provided as a Source Data file.
Fig. 2
Fig. 2. Feature importance ranking for the prediction of overall survival, for clinical and transcriptomic modalities.
Feature importance ranking was obtained by aggregating the SHAP values collected from both tasks (OS and 1-year death) and both approaches (linear and tree ensemble methods) (see Methods). Features that were significantly associated with 1-year death (one-sided permutation test with univariate AUCs) after Benjamini-Hochberg (BH) correction (α=0.05) are shown with a * on the left side, while features that were significantly associated with OS (one-sided permutation test with univariate C-index) after BH correction are annotated with a * on the right side. * corresponds to an adjusted p-value below 0.05. A Consensus feature importance ranking for the clinical data modality (left) and heatmap of correlations between consensus clinical features (right). Correlations were evaluated by Spearman correlation coefficients (for continuous feature vs continuous feature), AUCs rescaled to [1,1](for continuous feature vs binary categorical feature), or Matthews correlation coefficient (for binary categorical feature vs binary categorical feature). B Consensus feature importance ranking for the RNA data modality (left) and heatmap of Spearman correlations between consensus RNA features (right). Source data are provided as a Source Data file.
Fig. 3
Fig. 3. Performance of all the possible multimodal combinations, with a late fusion strategy and tree ensemble methods.
The bar height corresponds to the performance metric (either ROC AUC or C-index) averaged across the 100 cross-validation schemes, and the error bar corresponds to ± 1 standard deviation, estimated across the 100 cross-validation schemes. A ROC AUCs associated with the prediction of 1-year death with XGBoost algorithms (top) and estimated with n = 77 patients. C-indexes associated with the prediction of OS with Random Survival Forest algorithms (bottom) and estimated with n = 79 patients. B ROC AUCs associated with the prediction of 6-month progression with XGBoost algorithms (top) and estimated with n = 75 patients. C-indexes associated with the prediction of PFS with Random Survival Forest algorithms (bottom) and estimated with n = 80 patients. * C: clinical, R: radiomic, P: pathomic, RNA: transcriptomic. Source data are provided as a Source Data file.
Fig. 4
Fig. 4. Marginal contribution of each modality to the multimodal predictions for late fusion strategy and XGBoost classifiers.
A Heatmap of the marginal contribution (i.e., Shapley value) of each modality to the 1-year death prediction using the C + R + RNA late fusion model with XGBoost classifiers. Marginal contributions indicate how each modality influences the prediction relative to a random baseline of 0.5. Patients are stratified based on the multimodal model’s final prediction (with a 0.5 threshold), where the positive class corresponds to those who died within 1 year, and the negative class corresponds to those who survived. B For each modality and patient in clusters 1 and 2 (see A), represented by vertical lines, this plot shows the feature with the highest SHAP value that aligns with the modality’s marginal contribution. The size of each triangle indicates the absolute SHAP value, while its orientation corresponds to its sign (up for positive values that increase the predicted probability of death within 1 year and down for negative values that decrease it). The color scale represents the associated feature value relative to the whole patient cohort. C Relationship between the unimodal predictions from clinical, radiomic, and RNA modalities (i.e., unimodal tree ensemble models). Each dot is colored according to the patient’s true label. *In these plots, all marginal contributions, SHAP values, and predictions were obtained for the 77 patients with complete multimodal profiles and available 1-year death labels across the cross-validation test sets. They were collected for each of the 100 cross-validation schemes (see Methods) and subsequently averaged for each patient. Source data are provided as a Source Data file.
Fig. 5
Fig. 5. Best unimodal and multimodal performances across all the possible combinations of modalities and predictive algorithms.
The top barplot displays the performance of the best multimodal combination for each integration strategy, while the bottom barplot shows the performance of the best unimodal algorithm for each data modality. Bar heights and error bars correspond to the mean metric (AUC or C-index) and ± 1 standard deviation, respectively, estimated across the 100 cross-validation schemes (except for the dyam_optim models for which only 10 cross-validation schemes were used, due to computational constraints). A Best performance (AUC) for the prediction of 1-year death and 6-month progression (n = 77 for 1-year death and n = 75 for 6-month progression). B Best performance (C-index) for the prediction of OS and PFS (n = 79 for OS and n = 80 for PFS). Source data are provided as a Source Data file.
Fig. 6
Fig. 6. Average performance across all models with 1, 2, 3, and 4 modalities for 1-year death and OS.
Markers and error bars correspond to the mean average performance and ± 1 standard deviation respectively, estimated across the 100 cross-validation schemes. The box-and-whisker plots show the three quartiles and the minimum and maximum as whiskers up to 1.5×IQR(25–75%). Mean increases are represented with dashed lines and bold annotations. Red annotations correspond to two-sided paired sample t test p-values to compare the different numbers of integrated modalities (e.g., 1 modality vs 2 modalities), with nmodels = 8 for 1-year death and nmodels = 6 for OS. *: 1e-2 <pval≤ 5e-2, **: 1e-4 <pval≤ 1e-3, ***: pval ≤ 1e-4. Source data are provided as a Source Data file.
Fig. 7
Fig. 7. Comparison of the performance of transcriptomic signatures with our best transcriptomic and multimodal models.
Comparison of the performance of 36 transcriptomic signatures previously associated with immunotherapy (from the literature) against the best unimodal transcriptomic model and the best multimodal model from our analysis for each prediction task. The bar height corresponds to the performance metric (either ROC AUC or C-index), averaged across 100 cross-validation schemes and estimated for the 80 patients with a complete multimodal profile. The error bar indicates ± 1 standard deviation (for signatures without a training step, this standard deviation is zero). Performance metrics were transformed using max(x, 1-x) to account for signatures with a performance below 0.5. Blue bars represent performances below 0.5 (higher signature values are associated with better prognosis), while red bars represent performances above 0.5 (higher signature values are associated with worse prognosis). A Comparison for 1-year death prediction (n = 77 patients with a complete profile and available 1-year death label) and OS prediction (n = 79 patients with complete profile and available OS information). B Comparison for 6-month progression prediction (n = 75 patients with complete profile and available 6-month progression label) and PFS prediction (n = 80 patients with complete profile and available PFS information). Source data are provided as a Source Data file.
Fig. 8
Fig. 8. Risk stratification and survival analysis for OS with the predicted multimodal scores.
A Comparison of the stratification of the patients into high-risk and low-risk groups for OS, for different predictive tasks, with log-rank p-values (n = 265 patients with the 4 targets available for a fair comparison). Only the combinations, including the clinical modality, are compared (see Methods). On the left, clinical and multimodal models are compared by showing the lowest log-rank adjusted p-values from all clinical (left) and multimodal (right) models for each prediction task. On the right, the box-and-whisker plots show the three quartiles, with whiskers extending up to 1.5×IQR (25–75%) to show the range of adjusted p-values. B Kaplan-Meier survival curves (solid lines) with 95% confidence interval (shaded areas) for the high-risk and low-risk OS groups defined by PDL1-status (left), the clinical model with the lowest log-rank p-value (middle), and the multimodal model with lowest log-rank p-value (right). Unlike in A, unadjusted p-values are displayed here. C Kaplan-Meier survival curves (solid lines) with 95% confidence interval (shaded areas) for OS within the first year of therapy. The cohort is stratified into quartiles based on either the clinical score derived from the clinical perceptron predictions (top) or the multimodal score derived from the predictions of the clinical + pathomics + RNA model (bottom). D Log hazard ratios (points) with 95% confidence intervals (error bars) and likelihood-ratio test p-values associated with multivariate Cox models trained to predict patient’s OS (n = 265). Cox model with the clinical + pathomics + RNA score as well as the clinical features collected in this study (left). Cox model with the clinical + pathomics + RNA score, as well as the best unimodal scores derived from the top performing unimodal models for 1-year death prediction (right), with the best clinical score corresponding to the clinical perceptron identified in panels (B and C). Source data are provided as a Source Data file.

References

    1. Hendriks, L. E. et al. Non-oncogene-addicted metastatic non-small-cell lung cancer: ESMO Clinical Practice Guideline for diagnosis, treatment and follow-up. Ann. Oncol.34, 358–376 (2023). - PubMed
    1. Reck, M. et al. Updated analysis of KEYNOTE-024: Pembrolizumab versus platinum-based chemotherapy for advanced non-small-cell lung cancer with PD-L1 tumor proportion score of 50% or greater. J. Clin. Oncol.37, 537–546 (2019). - PubMed
    1. Gandhi, L. et al. Pembrolizumab plus chemotherapy in metastatic non-small-cell lung cancer. N. Engl. J. Med.378, 2078–2092 (2018). - PubMed
    1. Paz-Ares, L. et al. A randomized, placebo-controlled trial of pembrolizumab plus chemotherapy in patients with metastatic squamous NSCLC: Protocol-specified final analysis of KEYNOTE-407. J. Thorac. Oncol.15, 1657–1669 (2020). - PubMed
    1. Herbst, R. S. et al. Atezolizumab for first-line treatment of PD-L1-selected patients with NSCLC. N. Engl. J. Med.383, 1328–1339 (2020). - PubMed

MeSH terms

LinkOut - more resources