. 2025 Jul;77(7):914-928.
doi: 10.1002/art.43104. Epub 2025 May 19.

Critical Role for Transglutaminase 2 in Scleroderma Skin Fibrosis and in the Development of Dermal Sclerosis in a Mouse Model of Scleroderma

Affiliations

Critical Role for Transglutaminase 2 in Scleroderma Skin Fibrosis and in the Development of Dermal Sclerosis in a Mouse Model of Scleroderma

Angela Y Y Tam et al. Arthritis Rheumatol. 2025 Jul.

Abstract

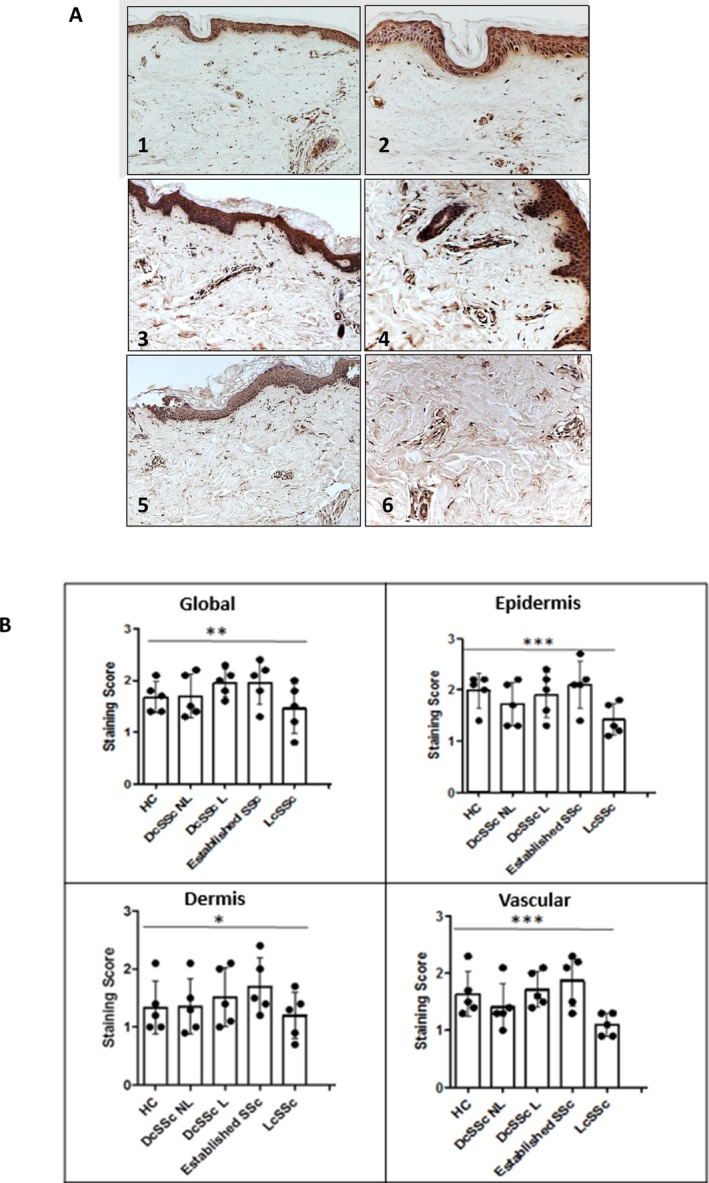
Objective: Scleroderma is a life-threatening autoimmune disease characterized by inflammation, tissue remodeling, and fibrosis. This study aimed to investigate the expression and function of transglutaminase 2 (TGM2) in scleroderma skin and experimentally induced dermal fibrosis to determine its potential role and therapeutic implications.

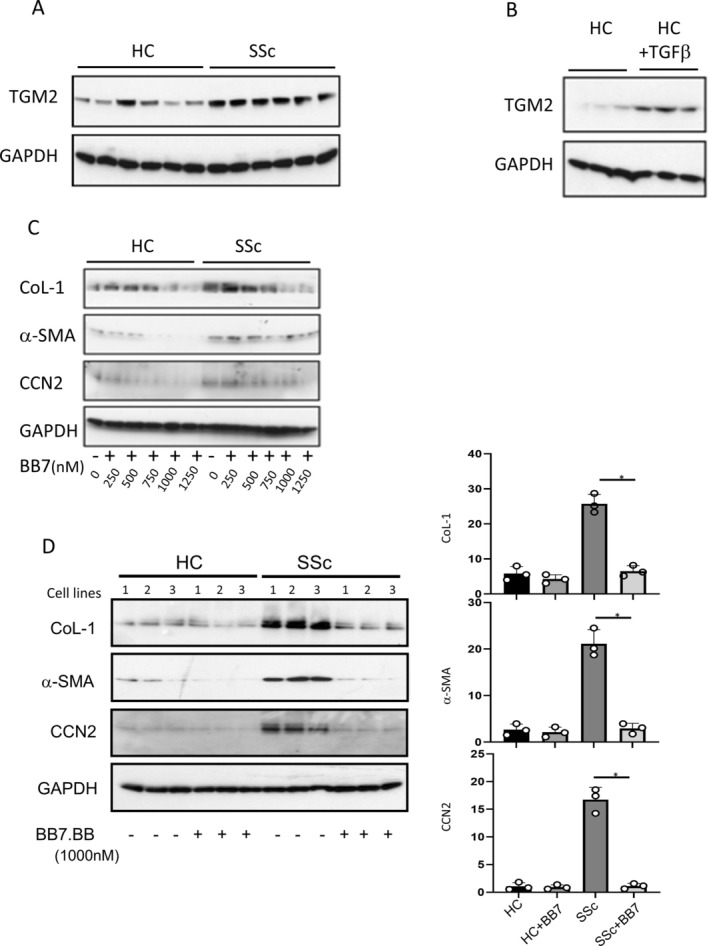
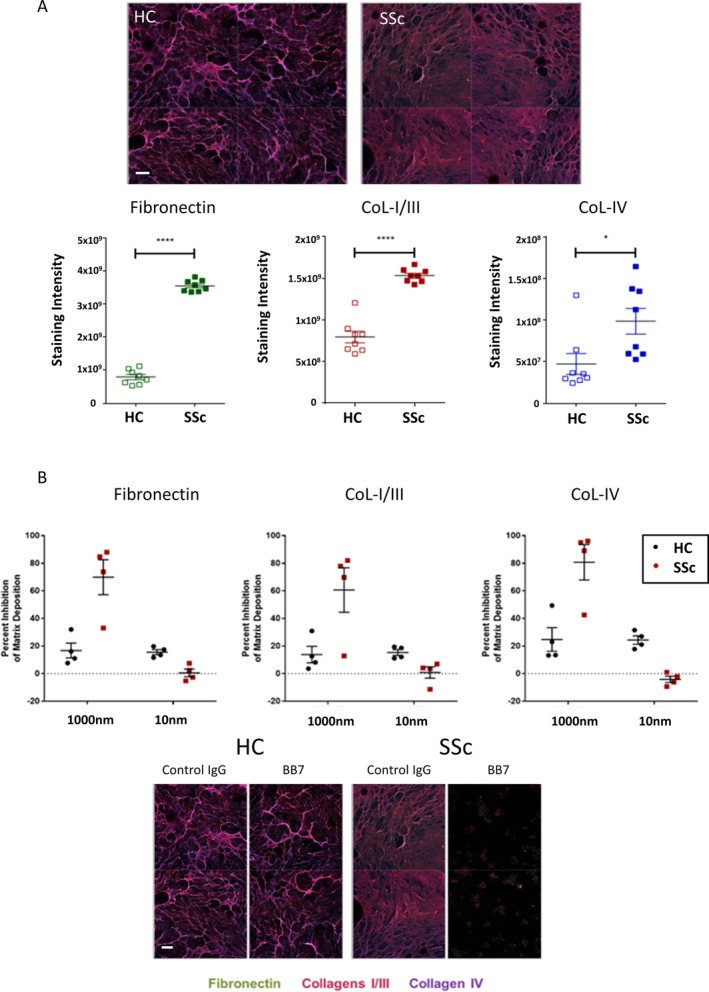
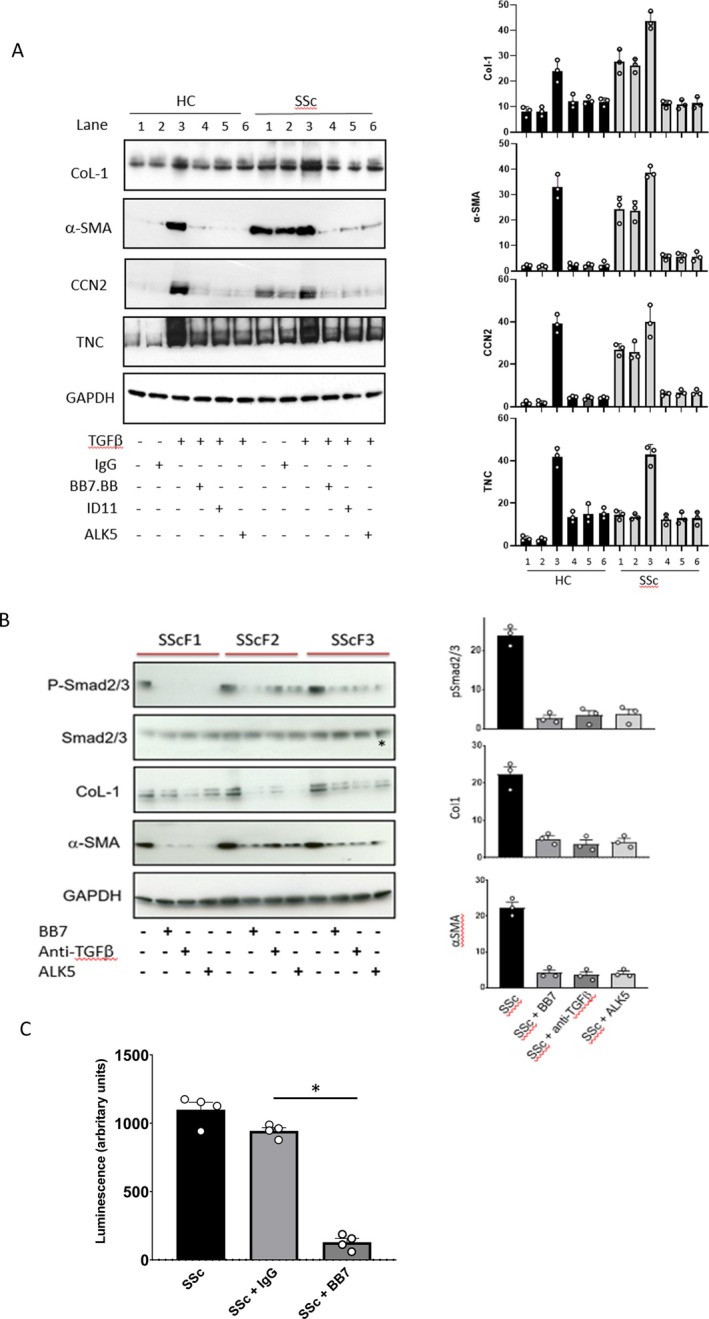
Methods: We performed immunohistochemistry on skin sections to assess TGM2 expression and localization, and protein biochemistry of both systemic sclerosis-derived and healthy control dermal fibroblasts to assess TGM2 expression, function, and extracellular matrix deposition in the presence of TGM2 inhibiting and transforming growth factor (TGF)-β neutralizing antibodies and a small-molecule inhibitor of the TGF-βRI kinase. Mice with a complete deficiency of TGM2 (Tgm2-/-) were investigated in the bleomycin-induced model of skin fibrosis.

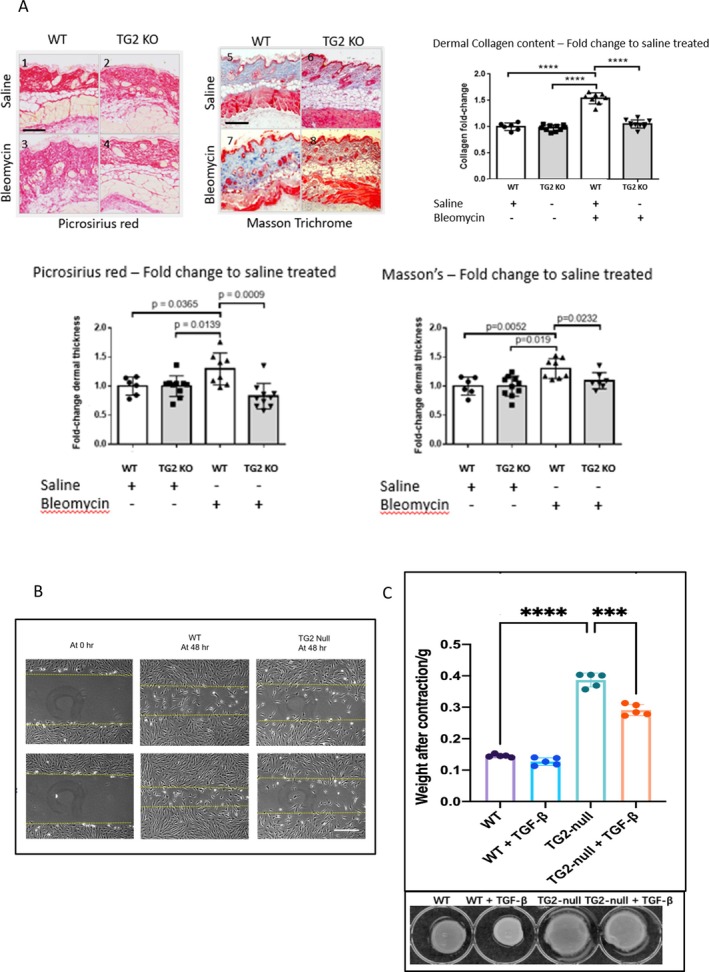
Results: TGM2 was found to be widely expressed in both control and scleroderma skin samples, as well as in cultured fibroblasts. Scleroderma fibroblasts exhibited elevated TGM2 expression, which correlated with increased expression of fibrosis markers (Col-1, αSMA, and CCN2). Inhibition of TGM2 using an inhibiting antibody reduced the expression of key markers of fibrosis. The effects of TGM2 inhibition were similar to those observed with TGF-β neutralization, suggesting a potential crosstalk between TGM2 and TGF-β signaling. Moreover, TGM2 knockout mice showed significantly reduced dermal fibrosis compared with wild type mice. In vitro experiments with TGM2-deleted fibroblasts demonstrated impaired cell migration and collagen matrix contraction, which could be partially restored by exogenous TGF-β.

Conclusion: TGM2 can regulate several key profibrotic activities of TGF-β suggesting that attenuating TGM2 function may be of benefit in severe forms of connective tissue disease with skin fibrosis.


Figures

Figure 1
Figure 1
TGM2 expression in control and scleroderma skin and the comparison of TGM2 expression patterns across the scleroderma disease spectrum. (A) Derma biopsies from HC patients with scleroderma (dcSSc; lesional and NL; lcSSc; and established SSc [>5 years duration]) were stained for TGM2 expression using immunohistochemistry (HC: panels 1 and 2; scleroderma NL skin: panels 3 and 4; scleroderma lesional skin: panels 5 and 6; magnification ×10: left; magnification ×20: right). (B) Comparison of expression patterns of TGM2 globally and within specific dermal compartments were made. Expression patterns of cross‐sectional TGM2 and within specific dermal compartments were scored by five blinded observers experienced in examining skin tissue. A semiquantitative grading of the total expression and distribution of staining was employed. Staining was graded between 0 and 3 with 0 (no staining) and 3 (highest staining) in 0.5 increments. Examination was performed at ×40 magnification on five randomly selected areas by each observer per control and disease biopsy. Total scores and average values were determined. Data represent mean staining score ± SD from five biopsy samples. Total score values were used to assess relevance of the differences using statistical significance as determined by t‐test *P = 0.05. **P < 0.01, ***P < 0.001. DcSSc, diffuse cutaneous systemic sclerosis; HC, healthy control, lcSSc, limited systemic sclerosis; NL, nonlesional; SSc, systemic sclerosis; TGM2, transglutaminase 2.
Figure 2
Figure 2
Increased expression of TGM2 by SSc fibroblasts and inhibition of TGM2 attenuates the expression of fibrotic protein markers in SSc dermal fibroblasts in vitro. (A) Expression of TGM2 (IA12 antibody) in primary HC fibroblasts (n = 6) and scleroderma fibroblasts (n = 6) was analyzed by Western blotting and normalized to expression of GAPDH. (B) TGM2 expression in primary HC fibroblasts (n = 3) was determined following fibroblast treatment with TGF‐β1 (4 ng/mL) for 24 hours. (C) Dermal fibroblasts isolated from HC and patients with SSc were cultured with TGM2 neutralizing antibody BB7.BB over a dose response range 0–1250 nM. (D) Survey of three HC and scleroderma fibroblasts cell lines culture in the presence of 1000 nM of BB7.BB. Expression of Col‐1, αSMA, and CCN2 were analyzed by Western blotting and normalized to expression of GAPDH. Densitometry analysis of Western blots (D; right) is shown. Bars show mean ± standard error of the mean. Statistical significance was tested using the t‐test, *P < 0.05. HC, healthy control; SEM, scanning electron microscopy; SSc, scleroderma; TGF, transforming growth factor; TGM2, transglutaminase 2.
Figure 3
Figure 3
TG2 antibody attenuates extracellular matrix deposition of fibroblasts in vitro. In (A), the readout is mean total intensity for each fluorophore. Data for fibronectin (left), collagens I and III (middle), and collagen IV (right), compare seven cultures derived from HC and seven from patients with SSc. In (B), cells were culture as in (A), but in the presence of BB7, and matrix was stained with antibodies to fibronectin (green) and collagens I, III (purple), and IV (blue). The data show responses from four cultures derived from HC and four from patients with SSc run in 2 independent experiments in the presence of BB7 (10 nm or 1000 nM) relative to 1000nM IgG control and given as percentage reduction in the amount of deposited extracellular matrix. All images shown are representative merged images. Statistical significance was determined by t‐test *P = 0.05, ***P < 0.001. Scale bar = 100 nm. HC, healthy control; SSc, systemic sclerosis. Color figure can be viewed in the online issue, which is available at http://onlinelibrary.wiley.com/doi/10.1002/art.43104/abstract.
Figure 4
Figure 4
TGM2 inhibition attenuates TGF‐β‐induced expression of fibrotic protein markers and alters Smad 2/3 phosphorylation and TGF‐β levels in control and SSc dermal fibroblasts. (A) Dermal fibroblasts isolated from HC (n = 3) and SSc cell lines (n = 3) were cultured alone or with recombinant TGF‐β1 (4 ng/mL), and then treated with combinations of control IgG, antibody BB7 (anti‐TGM2; 1000 nM), a pan‐TGF‐β blocking antibody (10 ug/mL), or in the presence of a small‐molecule inhibitor of ALK5inh/TGF‐βRI (SB431542; 10uM) for a further 48 hours. Expression of Col‐1, TNC, and αSMA were analyzed by Western blotting; blots shown are representative of n = 3. (B) Levels of SMAD2/3, phospho‐SMAD2/3, collagen I, and αSMA were assessed in SSc cell lines cultured alone or treated with BB7, a pan‐TGF‐β blocking antibody or with the ALK5 inhibitor. (C) Primary SSc dermal fibroblasts were grown in culture and then treated for 48 hours with either of BB7 or control IgG (1000nM). The media was then removed and the level of active TGF‐β measured using the mink lung cell bioassay. Data represent mean ± standard error of the mean for luminescence. *P < 0.05. HC, healthy control; SSc, scleroderma; TGF, transforming growth factor; TGM2, transglutaminase 2. Color figure can be viewed in the online issue, which is available at http://onlinelibrary.wiley.com/doi/10.1002/art.43104/abstract.
Figure 5
Figure 5
TGM2 gene deletion protects mice from bleomycin‐induced skin fibrosis and impacts upon primary dermal fibroblast functional activities. In (A), skin sections were stained with Masson's Trichrome and picrosirius red and dermal thickness measured using the NanoZoomer NDP software. Three measurements were taken across the skin sections and the averages skin thickness given as fold change relative to saline treated control mice. Stained sections were scanned using a NanoZoomer and viewed with the NDP viewer (×10 magnification). Data are presented as fold change in dermal thickness. *P ≤ 0.05; **P ≤ 0.01; ***P ≤ 0.001. Bar = 200 microns. (B) Primary dermal fibroblasts were culture to confluence, and the monolayers scratched to induce a single injury in the monolayer. A zero time point following wounding (left), scratch repair after 48 hours for WT (middle), and TG2 null (right) fibroblast populations are shown. The upper panel shows migration of fibroblast after 48 hours in the absence and presence (lower panels) of TGF‐β. (C) Dermal biopsies (4 mm) were taken from 6 to 10 mice and snap frozen ready for use. Collagen content was measured using the Sircoll as per the manufacturer's instructions. The Sircoll assay is a colorimetric assay for tissue collagen against a curve of collagen reference standards. Measurements are presented as fold change relative to the saline treated controls ****P = 0.0001. Average collagen content per biopsy were WT/saline (n = 6/27.3 ug), WT/bleomycin (n = 8/41.9ug), TG2 null/saline (n = 10/40.8 ug), and TG2 null/bleomycin (n = 10/43.95 ug). Fibroblast populations derived from explant skin cultures, which were placed with 3D collagen gels (left panel), and their level of contraction was assessed at 48 hours (right panel). Contraction was determined by quantification of gel weight after contraction. Statistical significance was tested by one way ANOVA with Tukey's multiple comparison, *P < 0.05, *** P < 0.0001. Scale bar = 200 μm. ANOVA, analysis of variance; KO, knockout; TGM2, transglutaminase 2; TGF, transforming growth factor; WT, wild type. Color figure can be viewed in the online issue, which is available at http://onlinelibrary.wiley.com/doi/10.1002/art.43104/abstract.

Similar articles

References

    1. Denton CP, Khanna D. Systemic sclerosis. Lancet 2017;390(10103):1685–1699. - PubMed
    1. Nihtyanova SI, Denton CP. Pathogenesis of systemic sclerosis associated interstitial lung disease. J Scleroderma Relat Disord 2020;5(2 suppl):6–16. - PMC - PubMed
    1. Pope JE, Denton CP, Johnson SR, et al. State‐of‐the‐art evidence in the treatment of systemic sclerosis. Nat Rev Rheumatol 2023;19:212–226. - PMC - PubMed
    1. Allanore Y, Simms R, Distler O, et al. Systemic sclerosis. Nat Rev Dis Primers 2015;23:15002. - PubMed
    1. Volkmann ER, Varga J. Emerging targets of disease‐modifying therapy for systemic sclerosis. Nat Rev Rheumatol 2019;15:208–224. - PubMed

MeSH terms

Grants and funding