

Network characteristics of comorbid symptoms in alcohol use disorder
- PMID: 39801256
- PMCID: PMC11731041
- DOI: 10.1080/07853890.2024.2446691
Network characteristics of comorbid symptoms in alcohol use disorder
Abstract
Background: Individuals with alcohol use disorder (AUD) often experience symptoms such as anxiety, depression, and decreased sleep quality. Although these are not diagnostic criteria, they may increase dependence risk and complicate treatment. This study aims to analyze comorbidities and their complex relationships in AUD patients through epidemiological surveys and network analysis.
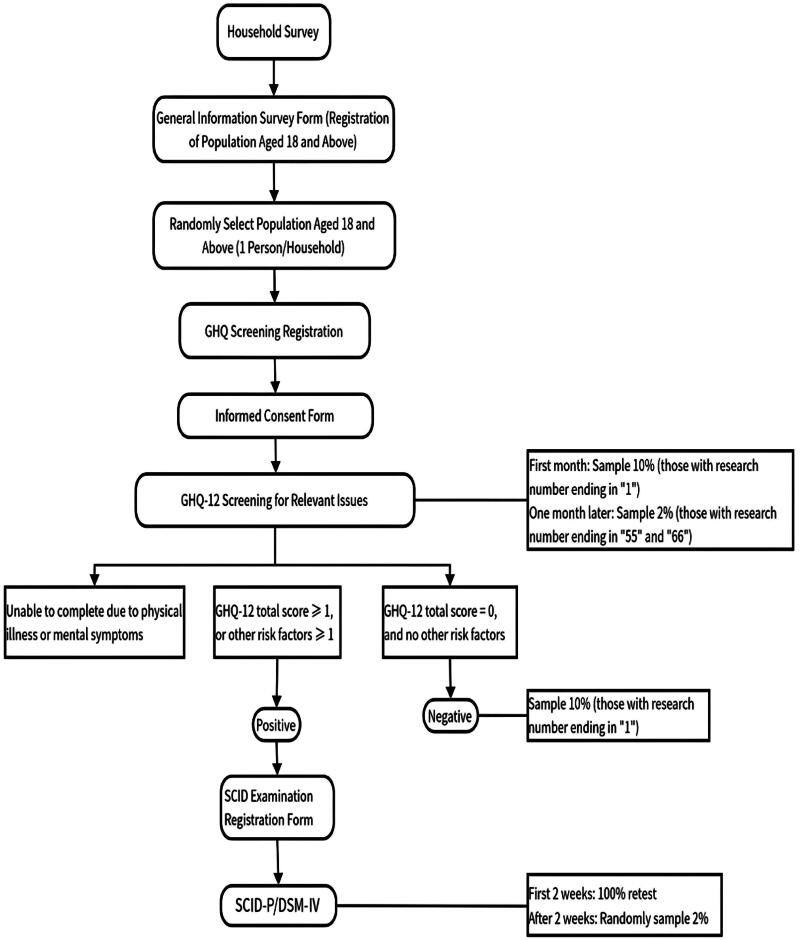
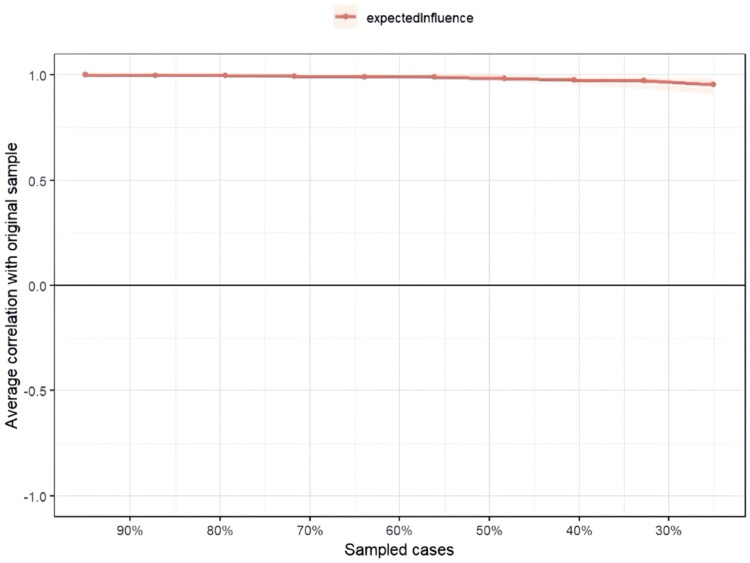
Materials and methods: Using multi-stage stratified cluster random sampling, we selected 27,913 individuals and identified those with AUD for the study. All screened subjects were assessed with the General Health Questionnaire, Pittsburgh Sleep Quality Index, and Simple Coping Style Questionnaire, and diagnosed according to DSM-IV criteria. Network analysis and visualization were performed in R 4.4.0. The qgraph and bootnet packages in R were used to obtain partial correlation network analysis and node centrality of mental health, sleep quality, and coping styles in individuals with AUD through the estimateNetwork function. The bootnet package was used to assess the accuracy and stability of the network. The bnlearn package in R was used to construct directed acyclic graph (DAG) for individuals with AUD using the Bayesian hill-climbing algorithm.
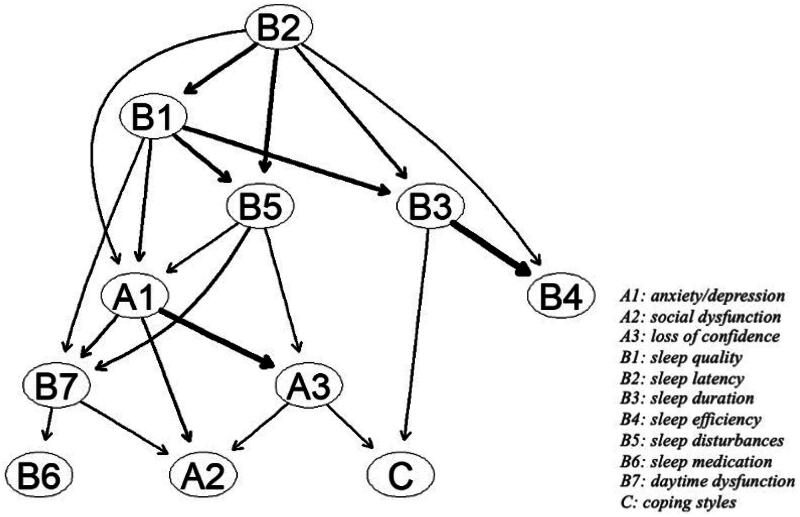
Results: In the partial correlation network, among the three major comorbidity categories, 'anxiety/depression' was most strongly associated with 'sleep quality'. 'Anxiety/depression' and 'sleep quality' had the highest node centrality, with 'sleep latency' also showing notable centrality. The DAG results indicated that 'sleep latency' had the highest probability priority, directly affecting 'anxiety/depression' and key sleep quality symptoms such as 'subjective sleep quality', 'sleep disturbances', 'sleep duration', and 'sleep efficiency', while also indirectly influencing other symptoms.
Conclusions: Among the comorbid symptoms of AUD, sleep latency appears to be a key factor in triggering other comorbid symptoms. This study provides a basis for interventions aimed at reducing the comorbid symptoms of AUD and promoting recovery.
Keywords: Alcohol use disorder; coping styles; epidemiological surveys; mental health; network analysis method; sleep quality.
Conflict of interest statement
No potential conflict of interest was reported by the authors.
Figures


Similar articles
-
The effects of seasonal affective disorder and alcohol abuse on sleep and snoring functions in a population-based study in Finland.J Sleep Res. 2018 Aug;27(4):e12611. doi: 10.1111/jsr.12611. Epub 2017 Sep 13. J Sleep Res. 2018. PMID: 28901656
-
Anxiety and depression in alcohol use disorder individuals: the role of personality and coping strategies.Subst Use Misuse. 2019;54(9):1475-1484. doi: 10.1080/10826084.2019.1586950. Epub 2019 Apr 11. Subst Use Misuse. 2019. PMID: 30973041
-
Symptoms of anxiety, depression, and borderline personality in alcohol use disorder with and without comorbid substance use disorder.Alcohol. 2021 Feb;90:19-25. doi: 10.1016/j.alcohol.2020.11.002. Epub 2020 Nov 21. Alcohol. 2021. PMID: 33232791 Free PMC article.
-
Comorbid social anxiety disorder in patients with alcohol use disorder: A systematic review.J Psychiatr Res. 2018 Nov;106:8-14. doi: 10.1016/j.jpsychires.2018.09.008. Epub 2018 Sep 14. J Psychiatr Res. 2018. PMID: 30236640
-
Clinical interventions for adults with comorbid alcohol use and depressive disorders: A systematic review and network meta-analysis.PLoS Med. 2021 Oct 8;18(10):e1003822. doi: 10.1371/journal.pmed.1003822. eCollection 2021 Oct. PLoS Med. 2021. PMID: 34624018 Free PMC article.
References
MeSH terms
LinkOut - more resources
Full Text Sources
Medical