. 2025 Apr 14;20(8):e202400842.
doi: 10.1002/cmdc.202400842. Epub 2025 Jan 26.

APH Inhibitors that Reverse Aminoglycoside Resistance in Enterococcus casseliflavus

Affiliations

APH Inhibitors that Reverse Aminoglycoside Resistance in Enterococcus casseliflavus

Elise Kaplan et al. ChemMedChem. .

Abstract

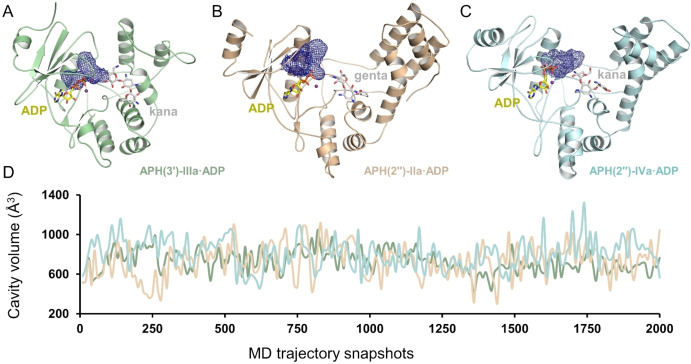
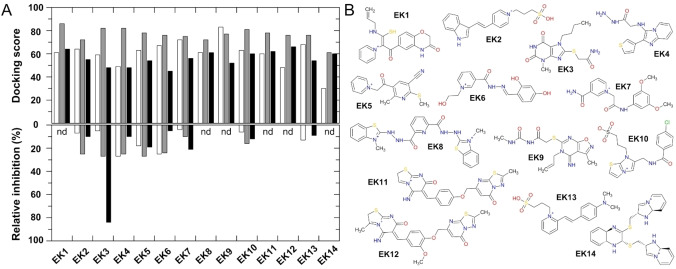
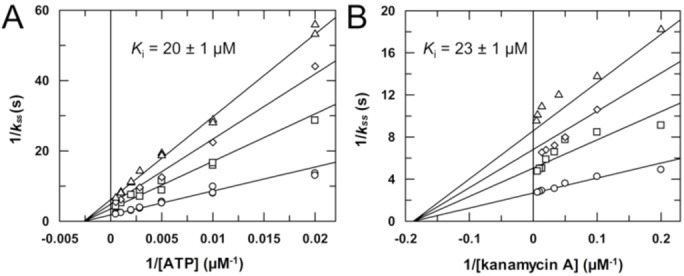
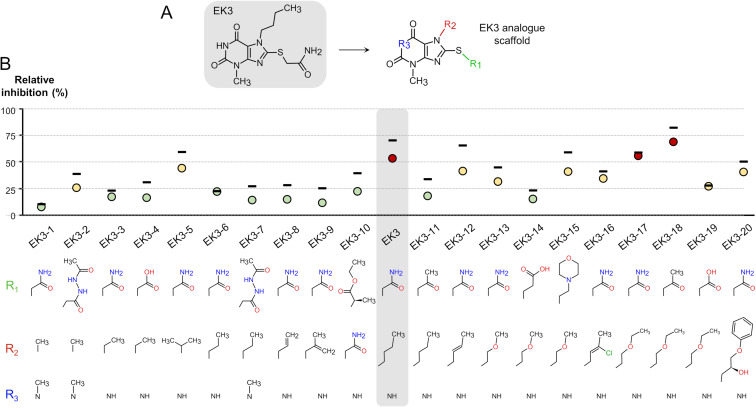
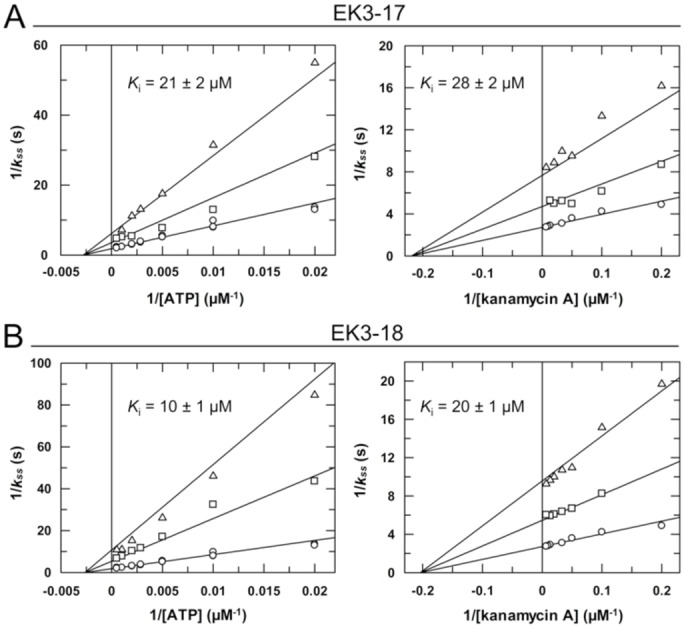
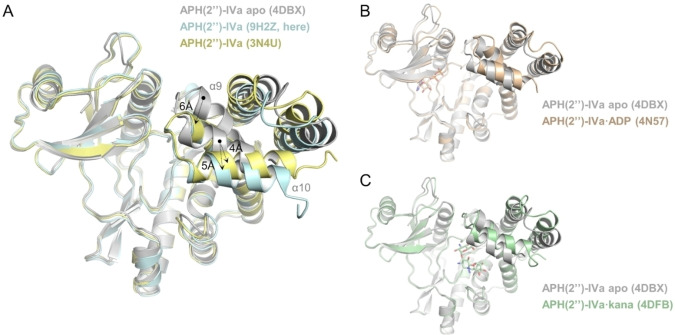
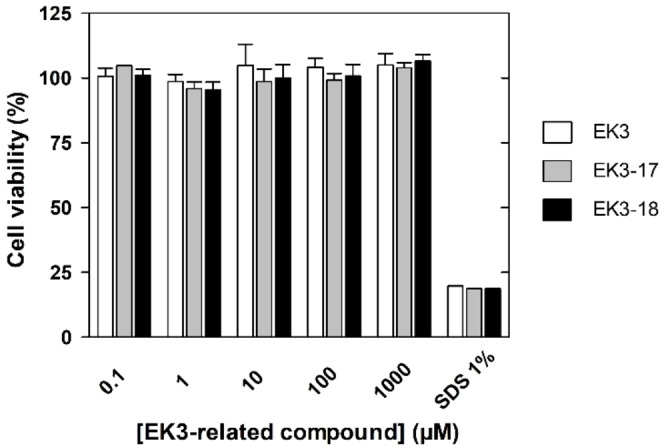
Aminoglycoside-phosphotransferases (APHs) are a class of bacterial enzymes that mediate acquired resistance to aminoglycoside antibiotics. Here we report the identification of small molecules counteracting aminoglycoside resistance in Enterococcus casseliflavus. Molecular dynamics simulations were performed to identify an allosteric pocket in three APH enzymes belonging to 3' and 2'' subfamilies in which we then screened, in silico, 12,000 small molecules. From a subset of only 14 high-scored molecules tested in vitro, we identified a compound, named here EK3, able to non-competitively inhibit the APH(2'')-IVa, an enzyme mediating clinical gentamicin resistance. Structure-activity relationship (SAR) exploration of this hit compound allowed us to identify a molecule with improved enzymatic inhibition. By measuring bacterial sensitivity, we found that the three best compounds in this series restored bactericidal activity of various aminoglycosides, including gentamicin, without exhibiting toxicity to HeLa cells. This work not only provides a basis to fight aminoglycoside resistance but also highlights a proof-of-concept for the search of allosteric modulators by using in silico methods.

Keywords: Allostery; Antibiotic resistance; Inhibitors; Molecular docking; Virtual screening.


Conflict of interest statement

The authors declare no conflict of interest.

Figures

Figure 1
Figure 1
Selection of a target cavity for in silico screening of allosteric inhibitors. Crystal structures are (A) APH(3′)‐IIIa (1J7L), (B) APH(2′′)‐IIa (4DCA, superseding 3R70) and (C) APH(2′′)‐IVa (4DBX). The nucleotides, magnesium ions and aminoglycosides are respectively represented in yellow sticks, purple spheres and grey sticks. In (C), MgADP derives from 4DCA aligned to 4DBX. Aminoglycosides correspond to kanamycin A from 1L8T in (A), gentamicin C1a from 3HAM in (B) and kanamycin A from 4DFB in (C). (D) Distribution of the volume cavity during the MD simulations for APH(3′)‐IIIa (green), APH(2′′)‐IIa (salmon) and APH(2′′)‐IVa (blue). For clarity, snapshots are shown at 0.1 ns intervals. The first 200 MD snapshots for the three proteins and the corresponding cavities are shown in Movie S1.
Figure 2
Figure 2
Docking scores and enzymatic APH inhibition of selected EK molecules. (A) Upper panel: in silico screening scores on APH(3′)‐IIIa (white), APH(2′′)‐IIa (grey) and APH(2′′)‐IVa (black) for the 14 selected EK compounds. Lower panel: relative inhibitions of the enzymatic activities by EK compounds. Steady‐state rate constants (k ss) were measured using the ADP/NADH coupled assay with final concentrations of 0.5 μM APH enzyme, 100 μM kanamycin A, 350 μM ATP and 500 μM EK compounds, before normalizing the activities to vehicle values. nd (no data) indicates compound solubility issues preventing testing. (B) Corresponding 2D structures of EK molecules. ZINC numbers, docking scores and enzymatic relative activities are fully listed in Table S1.
Figure 3
Figure 3
Mode of inhibition of APH(2′′)‐IVa by EK3. Lineweaver‐Burk representation of the non‐competitive inhibition profiles of EK3 with respect to (A) ATP or (B) kanamycin A. Initial concentrations in the reaction mixtures were 0.5 μM APH(2′′)‐IVa, 20 μM kanamycin A, 50–2000 μM ATP in (A) or 5–200 μM kanamycin A and 400 μM ATP in (B), and 0 (circles), 20 (squares), 35 (diamonds) or 50 (triangles) μM EK3. The values of the inhibition constants, K i, are indicated. Raw data and global fittings according to other modes of inhibition are shown in Figure S1.
Figure 4
Figure 4
Structure‐activity optimization of EK3 for APH(2′′)‐IVa inhibition. (A) 2D view of EK3 and the pharmacologic scaffold shared by the 20 purchased analogues, indicating the locations R1, R2 and R3 of structural variations, as further detailed in (B). (B) Relative inhibition of APH(2′′)‐IVa by EK3 and 20 analogues. For each molecule, motifs present in R1, R2 and R3 are shown and analogues are organized, left to right, by the increasing length and/or complexity of R2. Position of EK3 is marked with a grey frame as in (A). Colored circles depict the level of inhibition: high (more than 50 %, red), medium (between 25 and 50 %, yellow) or weak (less than 25 %, green). Values correspond to the average of two independent repetitions with the upper limit of standard deviation indicated as a horizontal line. Final concentrations were 0.5 μM APH, 20 μM kanamycin A, 400 μM ATP and 20 μM EK3 and analogue compounds.
Figure 5
Figure 5
Modes of inhibition of APH(2′′)‐IVa by EK3–17 and EK3–18 compounds. Lineweaver‐Burk representations of the non‐competitive inhibition profiles of EK3–17 (A) and EK3–18 (B) with respect to ATP (left) and kanamycin A (right). Values of inhibition constants, K i, are indicated. Final concentrations were as in Figure 3 with 0 (circles), 20 (squares), or 50 (triangles) μM EK3 analogues. Raw data and global fittings with different modes of inhibition are shown in Figure S2.
Figure 6
Figure 6
Conformational change of the C‐terminal domain of the protein. Overlay of crystal structures of APH(2′′)‐IVa in apo form (grey, 4DBX) and (A) after soaking with EK3–18 (light blue, 9H2Z) or in an alternate apo form (yellow, 3 N4 U), (B) in complex with ADP (salmon, 4 N57) and (C) in complex with kanamycin A (green, 4DFB). Ligands are shown as sticks.
Figure 7
Figure 7
Cytotoxicity assays of EK3 and related compounds. Viability of HeLa cells in the presence of indicated concentrations of EK3 (white bars), EK3–17 (grey bars) or EK3–18 (black bars) was measured using the an XTT‐based colorimetric assay. SDS at 1 % was used as a negative control. Results are expressed as mean versus cell viability obtained without compound but at the same DMSO concentration (1 %)±standard deviation for three independent replicates. For SDS, the error bars are not visible due to low dispersion of the data (SD ranging from 0.14–0.27 % cell viability).

Similar articles

Cited by

References

    1. Krause K. M., Serio A. W., Kane T. R., Connolly L. E., Cold Spring Harb. Perspect. Med. 2016, 6, a027029. - PMC - PubMed
    1. Kotra L. P., Haddad J., Mobashery S., Antimicrob. Agents Chemother. 2000, 44, 3249–3256. - PMC - PubMed
    1. Carter A. P., Clemons W. M., Brodersen D. E., Morgan-Warren R. J., Wimberly B. T., Ramakrishnan V., Nature 2000, 407, 340–348. - PubMed
    1. Davis B. D., Microbiol. Rev. 1987, 51, 341–350. - PMC - PubMed
    1. Zhanel G. G., Hoban D. J., Harding G. K., DICP 1991, 25, 153–163. - PubMed

MeSH terms

Substances

LinkOut - more resources