[Preprint]. 2024 Dec 31:rs.3.rs-5682984.
doi: 10.21203/rs.3.rs-5682984/v1.

Abnormal redox balance at membrane contact sites causes axonopathy in GDAP1-related Charcot-Marie-Tooth disease

Affiliations

Abnormal redox balance at membrane contact sites causes axonopathy in GDAP1-related Charcot-Marie-Tooth disease

Lara Cantarero et al. Res Sq. .

Abstract

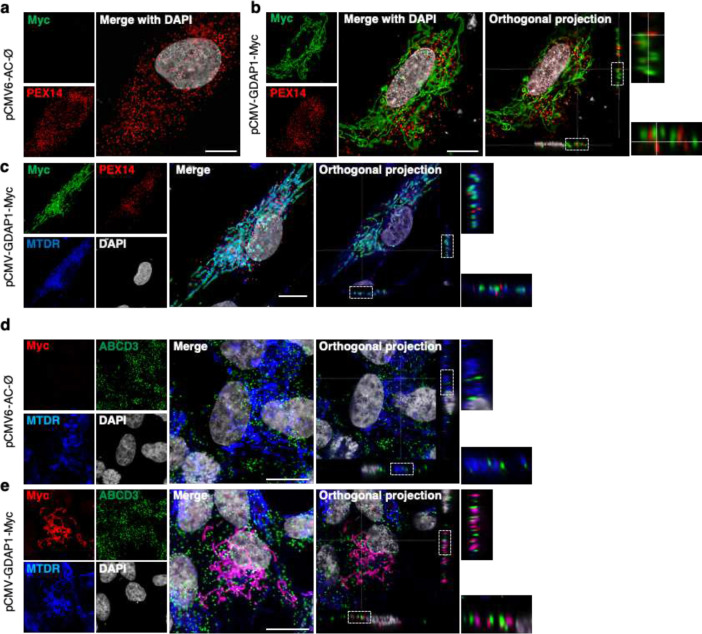
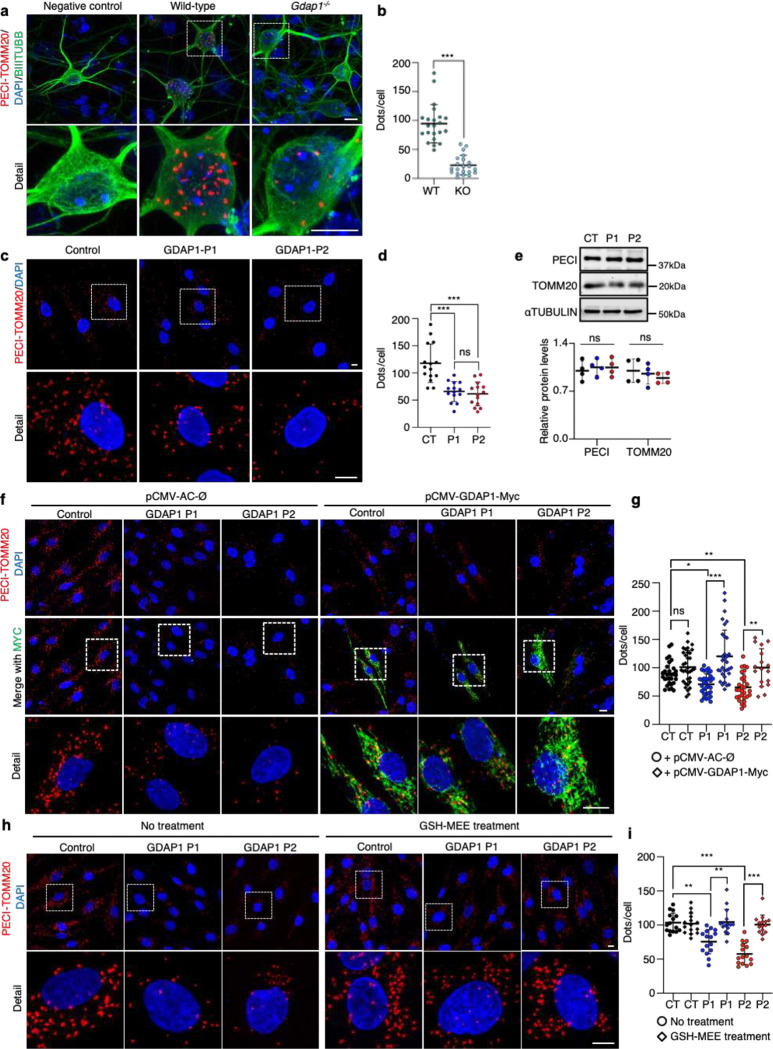
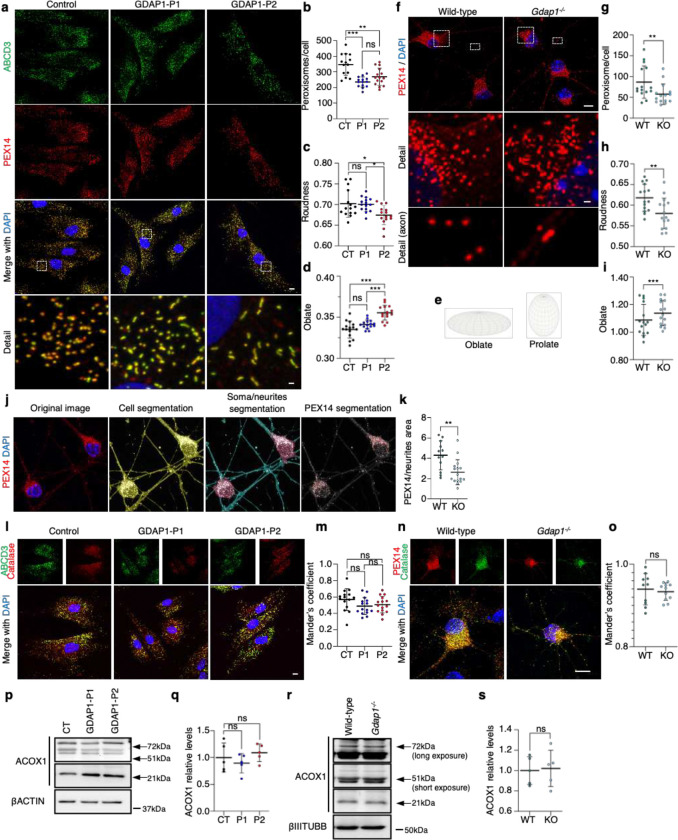
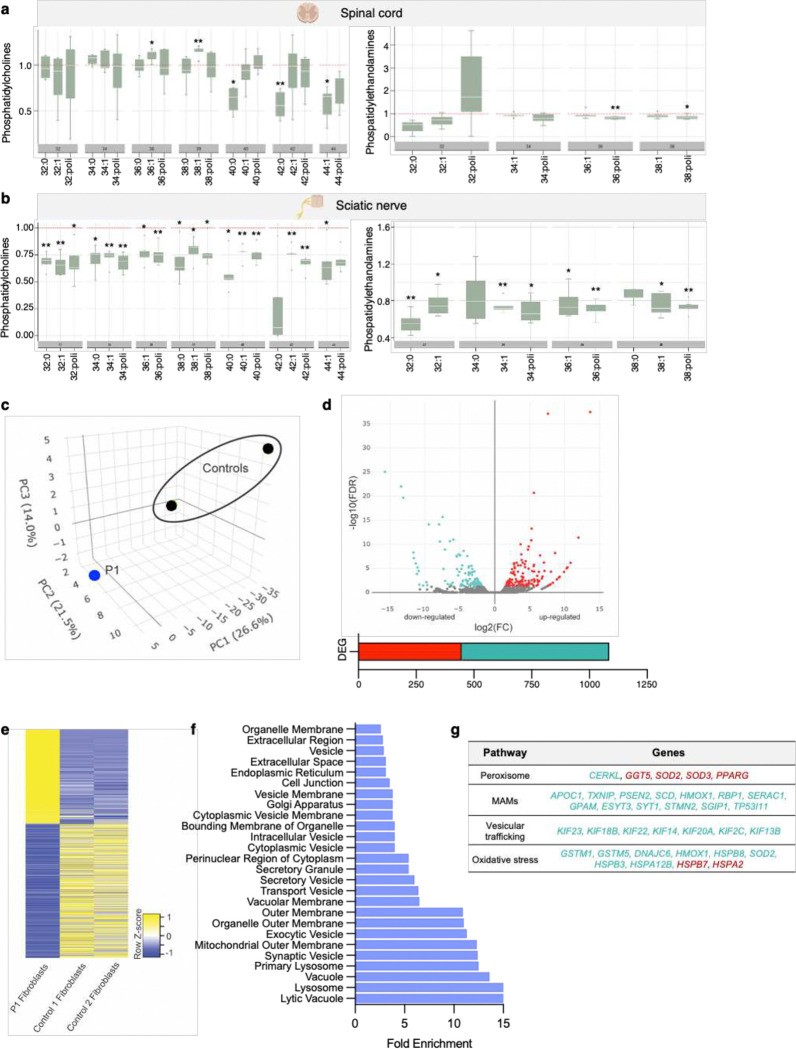
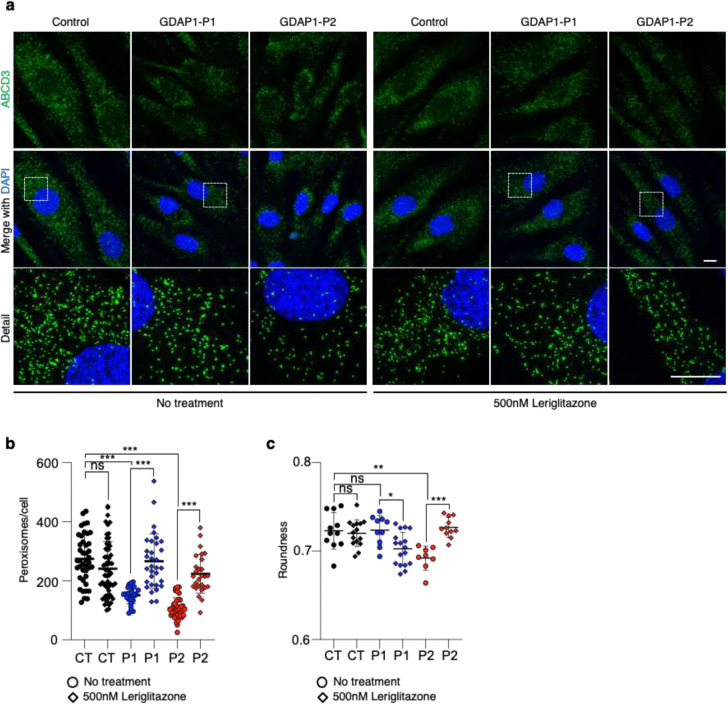
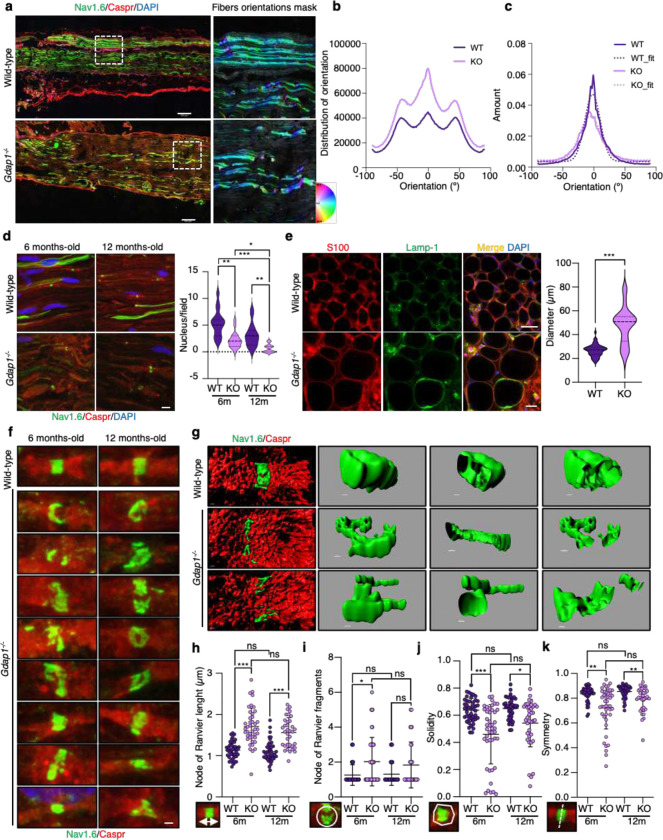
Pathogenic variants of GDAP1 cause Charcot-Marie-Tooth disease (CMT), an inherited neuropathy characterized by axonal degeneration. GDAP1, an atypical glutathione S-transferase, localizes to the outer mitochondrial membrane (OMM), regulating this organelle's dynamics, transport, and membrane contact sites (MCSs). It has been proposed that GDAP1 functions as a cellular redox sensor. However, its precise contribution to redox homeostasis remains poorly understood, as does the possible redox regulation at mitochondrial MCSs. Given the relationship between the peroxisomal redox state and overall cellular redox balance, we investigated the role of GDAP1 in peroxisomal function and mitochondrial MCSs maintenance by using high-resolution microscopy, live cell imaging with pH-sensitive fluorescent probes, and transcriptomic and lipidomic analyses in the Gdap1 -/- mice and patient-derived fibroblasts. We demonstrate that GDAP1 deficiency disrupts mitochondria-peroxisome MCSs and leads to peroxisomal abnormalities, which are reversible upon pharmacological activation of PPARγ or glutathione supplementation. These results identify GDAP1 as a new tether of mitochondria-peroxisome MCSs that maintain peroxisomal number and integrity. The supply of glutathione (GSH-MEE) or GDAP1 overexpression suffices to rescue these MCSs. Furthermore, GDAP1 may regulate the redox state within the microdomain of mitochondrial MCSs, as suggested by decreased pH at mitochondria-lysosome contacts in patient-derived fibroblasts, highlighting the relationship between GDAP1 and redox-sensitive targets. Finally, in vivo analysis of sciatic nerve tissue in Gdap1 -/- mice revealed significant axonal structural abnormalities, including nodes of Ranvier disruption and defects in the distribution and morphology of mitochondria, lysosomes, and peroxisomes, emphasizing the importance of GDAP1 in sustaining axon integrity in the peripheral nervous system. Taken together, this study positions GDAP1 as a multifunctional protein that mediates mitochondrial interaction with cellular organelles of diverse functions, contributes to redox state sensing, and helps maintain axonal homeostasis. In addition, we identify PPAR as a novel therapeutic target, based on knowledge of the underlying pathogenetic mechanisms.


Conflict of interest statement

Competing Interests Statement The authors declare no competing interests.

Figures

Figure 1.
Figure 1.. GDAP1 is not located in the peroxisomal membrane.
a, GDAP1-Myc and PEX14 staining in control fibroblasts transfected with pCMV-AC-Ø plasmid. Scale bar 10 μm. b, GDAP1-Myc and PEX14 staining in control fibroblasts transfected with pCMV-GDAP1-Myc plasmid. Orthogonal projections and magnification details are shown. Scale bar 10 μm. c, GDAP1-Myc, PEX14 and MitoTracker Deep Red (MTDR) staining in control fibroblasts transfected with pCMV-GDAP1-Myc plasmid. Orthogonal projections and magnification details are shown. Scale bar 10 μm. d, GDAP1-Myc and ABCD3 staining in SH-SY5Y neuroblastoma cells transfected with pCMV-AC-Ø plasmid. Orthogonal projections and magnification details are shown. Scale bar 10 μm. e, GDAP1-Myc and ABCD3 staining in SH-SY5Y cells transfected with pCMV-GDAP1-Myc plasmid. Orthogonal projections and magnification details are shown. Scale bar 10 μm.
Figure 2.
Figure 2.. GDAP1 is a tether of mitochondria—peroxisome membrane contact sites.
a, PLA assay between endogenous PECI and TOMM20 in control and Gdap1−/− eMNs. BIIITUBB is also stained. A detail is shown. Scale bar: 10 μm. b, Quantification of the number of PECI-TOMM20 dots per neuron. Mann-Whitney test (WT=22, KO=21, neurons, three independent cultures). c, PLA assay between endogenous PECI and TOMM20 in control and GDAP1 patients' fibroblasts. A detail is shown. Scale bar: 10 μm. d, Quantification of the number of PECI-TOMM20 dots per cell. Kruskal-Wallis followed by Dunn's multiple comparisons test. (CT=64, P1=70, P2=61 fibroblasts, three independent experiments). e, Western blot analysis of PECI and TOMM20 proteins in control and GDAP1 patients' fibroblasts. Quantification is shown in the panel below. One sample t-test (four independent experiments). f, PLA assay between endogenous PECI and TOMM20 in control and GDAP1 patients’ fibroblasts transfected with pCMV-AC-Ø or pCMV-GDAP1-Myc. A detail is shown. Scale bar: 10 μm. g, Quantification of the number of PECI-TOMM20 dots per cell. Kruskal-Wallis followed by Dunn's multiple comparisons test. (CT=30, P1=33, P2=29, CT+GDAP1=34, P1+GDAP1=32, P2+GDAP1=17 fibroblasts, four independent experiments). h, PLA assay between PECI and TOMM20 in untreated control and GDAP1 patients' fibroblasts or after GSH-MEE treatment. A detail is shown. Scale bar: 10 μm. i, Quantification of the number of PECI-TOMM20 dots per cell. Kruskal-Wallis followed by Dunn's multiple comparisons test. (CT=15, P1=15, P2=15, CT+GSH=15, P1+GSH=15, P2+GSH=15 fibroblasts, three independent experiments). All quantitative data are presented as mean ± SD and individual values are displayed as dots. For all comparisons, *p<0.05, **p<0.01, ***p<0.001, ns: not significant.
Figure 3.
Figure 3.. GDAP1 deficiency leads to abnormalities in the number and morphology of peroxisomes without affecting their enzymatic capacity.
a, Representative images of peroxisomal membrane proteins ABCD3 and PEX14, and DAPI in control and GDAP1 patients’ fibroblasts. A magnification is shown. Scale bar 10 μm, detail 1 μm. b, Peroxisomal roundness quantification. One-way ANOVA followed by Tukey's post hoc. (CT=47, P1=58, P2=61 fibroblasts, three independent experiments). c, Peroxisome number per cell. One-way ANOVA followed by Tukey's post hoc. (CT=47, P1=58, P2=61 fibroblasts, three independent experiments). d, Oblate shape descriptor quantification. One-way ANOVA followed by Tukey's post hoc. (CT=47, P1=58, P2=61 fibroblasts, three independent experiments). e, Representation of oblate and prolate shape descriptors. f, Representative images of peroxisomal membrane protein PEX14, and DAPI in cultured eMNs from wild-type and Gdap1−/− mice. General and axonal details are shown. Scale bar 10 μm, detail 1 μm. g, Quantification of peroxisomal roundness. Mann-Whitney test. (WT=31, KO=31 neurons, three independent primary cultures). h, Peroxisome number per neuron. Mann-Whitney test. (WT=31, KO=31 neurons, three independent primary cultures). i, Quantification of oblate shape descriptor. One-sample t-test. (WT=31, KO=31 neurons, three independent primary cultures). j, Image processing and segmentation for soma/neurites peroxisome number analysis. k, Quantification of peroxisome number in neurites of eMNs from wild-type and Gdap1−/− mice. Mann-Whitney test. (WT=31, KO=31 neurons, three independent primary cultures). l, Representative images of ABCD3 and Catalase in control and GDAP1 patients' fibroblasts. Scale bar 10μm. m, Mander’s coefficient quantification. One-way ANOVA followed by Tukey's post hoc. (n=15 ROI, from three independent experiments). n, Representative images of PEX14 and Catalase in cultured eMNs from wild-type and Gdap1−/− mice. Scale bar 10μm. o, Mander’s coefficient quantification. One-sample t test. (WT=10, KO=11 ROI, three independent primary cultures). p, Western blot analysis of ACOX1 isoforms in GDAP1 patients' fibroblasts. q, Quantification of ACOX1 relative levels in GDAP1 patients’ fibroblasts. One-Sample t test. (five independent experiments). r, Western blot analysis of ACOX1 isoforms in eMNs from wild-type and Gdap1−/− mice. s, Quantification of ACOX1 relative levels in eMNs. One-sample t test. (five independent primary cultures). All quantitative data are presented as mean ± SD and individual values are displayed as dots. For all comparisons, *p<0.05, **p<0.01, ***p<0.001, ns: not significant. ROI: region of interest.
Figure 4.
Figure 4.. GDAP1 deficiency lowers the pH at mitochondrial membrane contact sites.
a, Representative confocal microscopy images of control and GDAP1 patients' fibroblasts transfected with TOMM20-RpHluorin2 and stained with Lysotracker Red. Pseudocolored images display the pH indicator signal in two channels (F405/F475). Fluorescent images (λem 500–560 nm) were detected with excitation at λex 405 nm and λex 475 nm. The pseudocolored scale is shown at the bottom left. Warm colors such as white and red represent maximum intensities, whereas cold colors like blue are representative of low intensities. Scale bar: 5 μm. b, pH quantification in mitochondria-lysosome contacts by F475/F405 ratio in control and GDAP1 patients’ fibroblasts. Kruskal-Wallis followed by Dunn's multiple comparisons test (n=75–80 events/sample). Data are presented as mean ± SD, and individual values are displayed as dots. ***p<0.001, ns: not significant. c, Representative confocal microscopy images of control, GDAP1 and MFN2 patients' fibroblasts transfected with TOMM20-RpHluorin2 and stained with Lysotracker Red. Pseudocolored images display the pH indicator signal in two channels (F405/F475). Fluorescent images (λem 500–560 nm) were detected with excitation at λex 405 nm and λex 475 nm. The pseudocolored scale is shown at the bottom left. Warm colors such as white and red represent maximum intensities, whereas cold colors like blue are representative of low intensities. Scale bar: 5 μm. d, pH quantification in mitochondria-lysosome contacts by F475/F405 ratio in control, GDAP1 and MFN2 patients’ fibroblasts. Kruskal-Wallis followed by Dunn's multiple comparisons test (n=44–46 events/sample). All quantitative data are presented as mean ± SD, and individual values are displayed as dots. ***p<0.001, ns: not significant.
Figure 5.
Figure 5.. GDAP1 deficiency disrupts phospholipid profiles and modulates gene expression associated with cellular stress responses.
a, Fold-change ratio quantification of phosphatidylcholines (left) and phosphatidylethanolamines (right) in the spinal cord from wild type and Gdap1−/− mice by UHPLC-TOF. (5 animals/genotype). b, Fold-change ratio quantification of phosphatidylcholines (left) and phosphatidylethanolamines (right) sciatic nerve from wild type and Gdap1−/− mice by UHPLC-TOF. (5 animals/genotype). Two-sided one-sample t-test. The box plot lines correspond from the bottom of the box to the top: 25th percentile, median percentile, 75th percentile. The whiskers extend to the minimum and maximum values. *P<0.05; **P<0.01. c, PCA plot shows the distribution of DEG in the patient (P1) sample as compared to two control fibroblasts lines. Further, the 1086 DEGs are fairly evenly distributed between up and downregulated categories as illustrated in the d, volcano plot and e, heatmap. The e, biological pathway enrichment reveals 19 pathways with 3 to 24 fold enrichment, all which have a q-value <2.5E−3. g, summary of the specific pathways with the upregulated and downregulated genes identified in the RNAseq analysis.
Figure 6.
Figure 6.. The PPARγ agonist Leriglitazone restores peroxisomal defects in GDAP1 fibroblasts.
a, Representative images of peroxisomal membrane protein ABCD3, and DAPI in untreated control and GDAP1 patients' fibroblasts, or after Leriglitazone treatment at 500nM during 48 hours. A magnification is shown. Scale bar 10 μm. b, Peroxisome number per cell. One-way ANOVA followed by Tukey's post hoc. (CT=42, P1=27, P2=38, CT+Leri=61, P1+Leri=32, P2+Leri=27 fibroblasts, two independent experiments). c, Peroxisomal roundness quantification. One-way ANOVA followed by Tukey's post hoc. (CT=6769, P1=4711, P2=4061, CT+Leri=7146, P1+Leri=8515, P2+Leri=6029 peroxisomes, two independent experiments). All quantitative data are presented as mean ± SD and individual values are displayed as dots. For all comparisons, *p<0.05, **p<0.01, ***p<0.001, ns: not significant.
Figure 7.
Figure 7.. Mitochondria, lysosomes and peroxisomes are disrupted in sciatic nerves of Gdap1−/− mice.
a, Representative images of Cytochrome c and S100 staining in sciatic nerve sections from wild-type and Gdap1−/− mice. Magnification details are shown. Scale bar 8 μm, detail 4 μm. b, Quantification of Cytochrome c percentage area per ROI. Mann-Whitney test. (n=9 WT and n=9 KO ROIs, from three animals/genotype). c, Representative images of LAMP-1 and S100 staining in sciatic nerve sections from wild-type and Gdap1−/− mice. Magnification details are shown. Scale bar 15 μm, detail 5 μm. d, Quantification of LAMP-1 total area per ROI. Mann-Whitney test. (n=5 WT and n=9 KO ROIs, from three and five animals/genotype, respectively). e, Representative images of PEX14 and S100 staining in sciatic nerve sections from wild-type and Gdap1−/− mice. Magnification details are shown. Scale bar 10 μm, detail 2 μm. f, Quantification of peroxisome number per ROI. Mann-Whitney test. (n=12 ROI, from three animals/genotype). g, Proximity ligation assay (PLA) between endogenous GDAP1 and PEX14 in control and Gdap1−/− eMNs. Bright field is shown. Scale bar: 10 μm. h, PLA assay between endogenous GDAP1 and PEX14 in control fibroblasts. A detail is shown. Scale bar: 10 μm. i, Co-IP assay of endogenous GDAP1 and PEX14 in control fibroblasts. All quantitative data are presented as mean ± SD and individual values are displayed as dots. For all comparisons, *p<0.05, **p<0.01, ***p<0.001, ns: not significant. ROI: region of interest.
Figure 8.
Figure 8.. Lack of Gdap1 causes structural nerve alterations.
a, Projection of stitched mosaic images depicting the sciatic nerves stained with Nav1.6, Caspr and DAPI from 6-months old wild-type and Gdap1−/− mice. On the right, a hue-saturation-brightness (HSB) color map region of Nav1.6 is displayed. These maps are generated using the OrientationJ plugin, where specific orientation angles are assigned to colors and their saturation levels. Scale bar 100 μm. b-c, Graphs illustrating the distribution (b) and quantity (c) of Nav1.6 orientation in wild-type and Gdap1−/− nerves. d, Representative images of Nav1.6, Caspr and DAPI in sciatic nerve sections from 6-months old and 12-months old wild-type and Gdap1−/− mice. Scale bar 10 μm. A violin plot showing the quantification of the number of nuclei per field is shown in the right panel. Kruskal-Wallis followed by Dunn's multiple comparisons test. (n=15 WT-6, n=16 WT-12; n=17 KO-6 and n=18 KO-12 ROIs, from three animals/genotype). e, Whole mount staining of sciatic nerves from 6-months old wild-type and Gdap1−/− mice. We show S100, Lamp-1 and DAPI of the most distal region, where neuromuscular junctions are stablished. Scale bar 20 μm. A quantification of the axon diameter is shown in the right panel. Studenťs t-test (n=50 WT, n=50 KO, axons, respectively). f, Representative images of Caspr and Nav1.6 staining in sciatic nerve sections from 6-months old and 12-months old wild-type and Gdap1−/− mice. Scale bar 1 μm. g, Node of Ranvier 3D projections from 6-months old wild-type and Gdap1−/− mice. Different sections and orientations are shown. Scale bar 0.5 μm. h, Node of Ranvier length quantification. Kruskal-Wallis followed by Dunn's multiple comparisons test. (n=46 WT-6, n=46 WT-12; n=41 KO-6 and n=35 KO-12 nodes, from three animals/genotype, respectively). i, Node of Ranvier fragments quantification. Kruskal-Wallis followed by Dunn's multiple comparisons test. (n=39 WT-6, n=44 WT-12; n=43 KO-6 and n=30 KO-12 nodes, from three animals/genotype, respectively). j, Node of Ranvier solidity quantification. Kruskal-Wallis followed by Dunn's multiple comparisons test. (n=45 WT-6, n=45 WT-12; n=44 KO-6 and n=37 KO-12 nodes, from three animals/genotype, respectively). k, Node of Ranvier symmetry quantification. Kruskal-Wallis followed by Dunn's multiple comparisons test. (n=45 WT-6, n=45 WT-12; n=44 KO-6 and n=37 KO-12 nodes, from three animals/genotype, respectively). Quantitative data (h-k) are presented as mean ± SD and individual values are displayed as dots. For all comparisons, *p<0.05, **p<0.01, ***p<0.001, ns: not significant.
Figure 9.
Figure 9.. GDAP1 functions and proposed pathophysiological mechanisms in deficient cells.
The figure shows the structure of sciatic nerves with nodes of Ranvier, peroxisome biogenesis, which shares machinery with mitochondria, organelle transport along the axon, and mitochondrial-membrane contact sites in wild-type cells (left panel) juxtaposed with GDAP1 deficient cells (right panel).

Similar articles

Cited by

References

    1. Nelis E., et al. Mutations in GDAP1: autosomal recessive CMT with demyelination and axonopathy. Neurology 59, 1865–1872 (2002). - PubMed
    1. Cuesta A., et al. The gene encoding ganglioside-induced differentiation-associated protein 1 is mutated in axonal Charcot-Marie-Tooth type 4A disease. Nat Genet 30, 22–25 (2002). - PubMed
    1. Sevilla T., et al. Clinical, electrophysiological and morphological findings of Charcot-Marie-Tooth neuropathy with vocal cord palsy and mutations in the GDAP1 gene. Brain 126, 2023–2033 (2003). - PubMed
    1. Baxter R.V., et al. Ganglioside-induced differentiation-associated protein-1 is mutant in Charcot-Marie-Tooth disease type 4A/8q21. Nat Genet 30, 21–22 (2002). - PubMed
    1. Pedrola L., et al. GDAP1, the protein causing Charcot-Marie-Tooth disease type 4A, is expressed in neurons and is associated with mitochondria. Hum Mol Genet 14, 1087–1094 (2005). - PubMed

Publication types

LinkOut - more resources