

Role of multi-parametric ultrasonography for the assessment and monitoring of functional status of renal allografts with histopathological correlation
- PMID: 39801670
- PMCID: PMC11718520
- DOI: 10.4329/wjr.v16.i12.782
Role of multi-parametric ultrasonography for the assessment and monitoring of functional status of renal allografts with histopathological correlation
Abstract
Background: The study focuses on the use of multi-parametric ultrasound [gray scale, color Doppler and shear wave elastography (SWE)] to differentiate stable renal allografts from acute graft dysfunction and to assess time-dependent changes in parenchymal stiffness, thereby assessing its use as an efficient monitoring tool for ongoing graft dysfunction. To date, biopsy is the gold standard for evaluation of acute graft dysfunction. However, because it is invasive, it carries certain risks and cannot be used for follow-up monitoring. SWE is a non-invasive imaging modality that identifies higher parenchymal stiffness values in cases of acute graft dysfunction compared to stable grafts.
Aim: To assess renal allograft parenchymal stiffness by SWE and to correlate its findings with functional status of the graft kidney.
Methods: This prospective observational study included 71 renal allograft recipients. Multi-parametric ultrasound was performed on all patients, and biopsies were performed in cases of acute graft dysfunction. The study was performed for a period of 2 years at Sanjay Gandhi Postgraduate Institute of Medical Sciences, Lucknow, a tertiary care center in north India. Independent samples t-test was used to compare the means between two independent groups. Paired-samples t-test was used to test the change in mean value between baseline and follow-up observations.
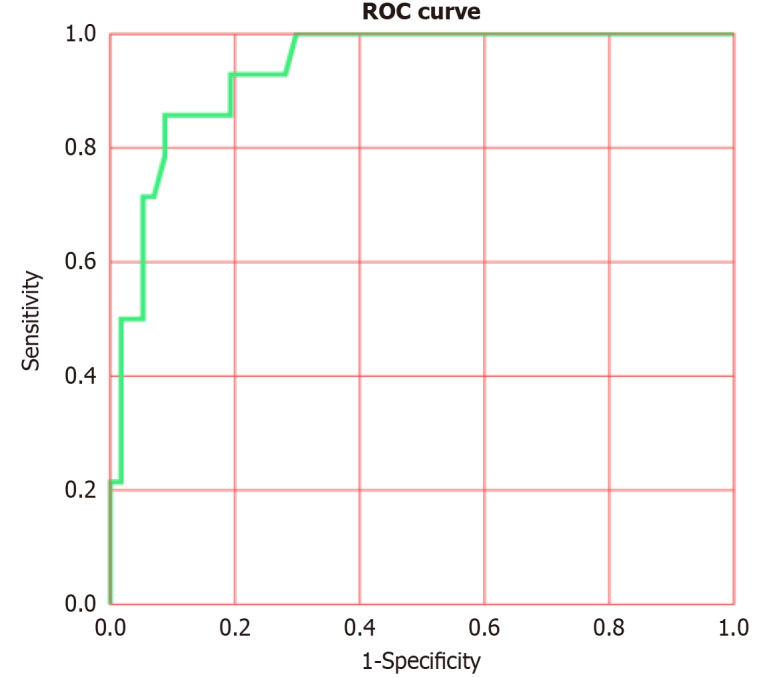
Results: Thirty-one patients had experienced acute graft dysfunction at least once, followed by recovery, but none of them had a history of chronic renal allograft injury. Mean baseline parenchymal stiffness in stable grafts and acute graft dysfunction were 30.21 + 2.03 kPa (3.17 + 0.11 m/s) and 31.07 + 2.88 kPa (3.22 + 0.15 m/s), respectively; however, these differences were not statistically significant (P = 0.305 and 0.252, respectively). There was a gradual decrease in SWE values during the first 3 postoperative months, followed by an increase in SWE values up to one-year post-transplantation. Patients with biopsy-confirmed graft dysfunction showed higher SWE values compared to those with a negative biopsy. However, receiver operating characteristic analysis failed to show statistically significant cut-off values to differentiate between the stable graft and acute graft dysfunction.
Conclusion: Acute graft dysfunction displays higher parenchymal stiffness values compared to stable grafts. Therefore, SWE may be useful in monitoring the functional status of allografts to predict any ongoing dysfunction.
Keywords: Acute graft rejection; Multi-parametric ultrasound; Renal allograft; Renal transplant; Resistive index; Shear wave elastography.
©The Author(s) 2024. Published by Baishideng Publishing Group Inc. All rights reserved.
Conflict of interest statement
Conflict-of-interest statement: The authors of this manuscript have no conflicts of interest to disclose.
Figures


Similar articles
-
ARFI-based tissue elasticity quantification and kidney graft dysfunction: first clinical experiences.Clin Hemorheol Microcirc. 2011;49(1-4):527-35. doi: 10.3233/CH-2011-1503. Clin Hemorheol Microcirc. 2011. PMID: 22214724 Clinical Trial.
-
Renal Allograft Dysfunction: Evaluation with Shear-wave Sonoelastography.Radiology. 2018 Jul;288(1):146-152. doi: 10.1148/radiol.2018170577. Epub 2018 Apr 10. Radiology. 2018. PMID: 29634441
-
Prediction of acute rejection in renal allografts using shear-wave dispersion slope.Eur Radiol. 2024 Jul;34(7):4527-4537. doi: 10.1007/s00330-023-10492-8. Epub 2023 Dec 13. Eur Radiol. 2024. PMID: 38091056
-
Renographic indices for evaluation of changes in graft function.Eur J Nucl Med. 1998 Nov;25(11):1575-86. doi: 10.1007/s002590050338. Eur J Nucl Med. 1998. PMID: 9799356 Review.
-
Challenges and Considerations When Using Shear Wave Elastography to Evaluate the Transplanted Kidney, With Pictorial Review.J Ultrasound Med. 2017 Sep;36(9):1771-1782. doi: 10.1002/jum.14217. Epub 2017 May 4. J Ultrasound Med. 2017. PMID: 28471017 Review.
Cited by
-
Update on newer ultrasound systems to study the microvasculature.Radiol Med. 2025 Aug;130(8):1283-1296. doi: 10.1007/s11547-025-02035-6. Epub 2025 Jun 25. Radiol Med. 2025. PMID: 40560337 Review.
References
-
- Wekerle T, Segev D, Lechler R, Oberbauer R. Strategies for long-term preservation of kidney graft function. Lancet. 2017;389:2152–2162. - PubMed
-
- Hariharan S, Johnson CP, Bresnahan BA, Taranto SE, McIntosh MJ, Stablein D. Improved graft survival after renal transplantation in the United States, 1988 to 1996. N Engl J Med. 2000;342:605–612. - PubMed
-
- Josephson MA. Monitoring and managing graft health in the kidney transplant recipient. Clin J Am Soc Nephrol. 2011;6:1774–1780. - PubMed
-
- Furness PN, Taub N Convergence of European Renal Transplant Pathology Assessment Procedures (CERTPAP) Project. International variation in the interpretation of renal transplant biopsies: report of the CERTPAP Project. Kidney Int. 2001;60:1998–2012. - PubMed
-
- Arndt R, Schmidt S, Loddenkemper C, Grünbaum M, Zidek W, van der Giet M, Westhoff TH. Noninvasive evaluation of renal allograft fibrosis by transient elastography--a pilot study. Transpl Int. 2010;23:871–877. - PubMed
LinkOut - more resources
Full Text Sources
