Review
. 2024 Aug 5;10(1):e10701.
doi: 10.1002/btm2.10701. eCollection 2025 Jan.

Mesenchymal stem cells for osteoarthritis: Recent advances in related cell therapy

Affiliations
Review

Mesenchymal stem cells for osteoarthritis: Recent advances in related cell therapy

Jianjing Lin et al. Bioeng Transl Med. .

Abstract

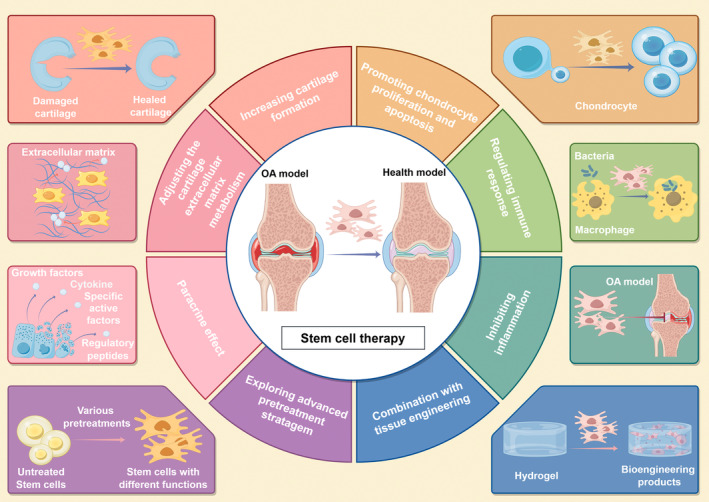
Osteoarthritis (OA) is a degenerative joint disease that affects the entire joint and has been a huge burden on the health care system worldwide. Although traditional therapy and targeted cartilage cell therapy have made significant progress in the treatment of OA and cartilage regeneration, there are still many problems. Mesenchymal stem cells from various tissues are the most studied cell type and have been used in preclinical and clinical studies of OA, because they are more widely available, have a greater capacity for in vitro expansion, and have anti-inflammatory and immunomodulatory properties compared to autologous chondrocytes. This article will systematically review the latest developments in these areas. It may provide new insights for improving OA and cartilage regeneration.

Keywords: cartilage; extracellular vesicles; mesenchymal stem cells; osteoarthritis; stem cell.


Conflict of interest statement

The authors declare that they have no competing interests.

Figures

FIGURE 1
FIGURE 1
Role of stem cell therapy in the treatment of OA. Created with figdraw.com. OA, Osteoarthritis.
FIGURE 2
FIGURE 2
Therapeutic effects of different MSCs on cartilage defect. (a) Week 12 Comparative Imaging of Horse 7's Metacarpophalangeal Joints: The left fore fetlock (images a′–d′) treated with placebo shows grade 3 synovial effusion and periarticular osteophytes on STIR sagittal and T1‐weighted dorsal MRI images, respectively (white arrows, arrowheads in a′, b′). In contrast, the right fore fetlock (images e′–h′) treated with BMMSCs exhibits grade 2 synovial effusion and lower osteophyte scores (grade 3 on the left vs. grade 1 on the right in 35° oblique radiographs and ultrasound). (b) Week 12 Comparative Imaging of Horse 4's Metacarpophalangeal Joints: The left fore fetlock (images a′–d′) receiving placebo shows grade 3 synovial effusion and periarticular osteophytes on STIR sagittal and T1‐weighted dorsal MRI images (white arrows, arrowheads in a′, b′). The right fore fetlock (images e′–h′) treated with UCB‐MSCs displays grade 2 synovial effusion. Osteophytes are consistent at grade 2 in 35° oblique radiographs and ultrasounds for both fetlocks (arrow heads in c′, g′, d′, h′). Adapted with permission. Copyright © 2021 The Author(s). (b) Gross morphological observations of femoral condyles were conducted at weeks 8 and 12 post‐surgery. Groups included control and ADSC‐treated at both time points. Severe erosion was observed in the control group at week 12, while moderate erosion was noted in both control and ADSC‐treated groups at week 8 and 12. Mild lesions were seen in the ADSC‐treated group at week 8. (c) Histological evaluation of femoral condyles was conducted at weeks 8 and 12 post‐surgery. Specimens were stained with hematoxylin and eosin (H&E) and Safranin‐O/fast green. Severe cartilage damage was observed in groups c′ and g′, moderate damage in groups a′, e′, d′, and h′, and mild damage in groups b′ and f′. Adapted with permission. Copyright © 2017 The Author(s). (d) Changes in visual analog scale (VAS) scores for daily (a′) and sports (b′) activities were monitored over 48 weeks post infrapatellar fat pad‐derived MSCs (IFP‐MSCs) injection. Significant pain relief was observed one‐week post‐injection, with rates nearing 100% in the following 47 weeks. Mean pain relief rate, presented as a percentage relative to baseline, was calculated. ***p < 0.001. Adapted with permission. Copyright © 2021 International Society for Cell & Gene Therapy. BMMSC, bone marrow mesenchymal stem cells; MRI, magnetic resonance imaging; MSCs, mesenchymal stem/stromal cells; UCB‐MSCs, umbilical cord blood‐derived mesenchymal stem cells.
FIGURE 3
FIGURE 3
Therapeutic effects of ESCs and iPSCs on cartilage defect. (a) (a′) Macroscopic features of the femoral condyle, illustrated by India ink, were examined in three specimens per group at 6 and 10 weeks post‐initial injection. (b′) International Cartilage Repair Society (ICRS) macroscopic scores of the femoral condyle for all groups at 6 after the first injection. (c′) ICRS macroscopic scores of the femoral condyle for all groups at 10 weeks after the first injection. Error bars represent 95% confidence intervals (CI). ** p < 0.01, **** p < 0.0001, ns = no significance. (b) The corresponding modified Mankin scoresfor all groups. Error bars represent 95%CI. ** p < 0.01, **** p < 0.001, ns = no significance. Adapted with permission. Copyright © 2021 The Author(s). (c) The ICRS histological score evaluated tissue regeneration in rabbit articular cartilage defects 12 weeks after treatment. Scores in the iPSC‐MSC‐chondrocytes group were significantly higher than those in the control group (n = 3), *p = 0.02, analyzed using the Mann–Whitney U test. Adapted with permission. Copyright © 2020 The Author(s). (d) Macroscopic images of tibia at 15 weeks post injection. The control tibia showed no cartilage lesions in both the medial and lateral compartments of the tibial plateau (red arrow), while the monosodium iodoacetate (MIA)‐injected tibia exhibited severe cartilage lesions specifically on the medial tibial plateau (black arrow). Notably, observable repair was evident in the knee transplanted with iPS‐derived chondrocytes (white arrow). All the arrow point to medial tibial plateau. Adapted with permission. Copyright © 2016 The Author(s). ESCs, embryonic stem cells; iPSCs: induced pluripotent stem cells; MSCs, mesenchymal stem cells.
FIGURE 4
FIGURE 4
Physical strategies to improve cartilage differentiation of MSCs. (a) Evaluate the overall repair results based on the macroscopic appearance observed in each group of cartilage repair models. Sham: Sham surgery group; Scaffold only: Scaffold only group. Adapted with permission. Copyright © 2018 The Author(s). (b) Macroscopic view of nanosecond pulsed electric fields (nsPEFs)‐preconditioned MSCs enhanced cartilage regeneration in vivo. condition A: nsPEF preconditioning of 10 ns at 20 kV/cm; condition B: nsPEF preconditioning of 100 ns at 10 kV/cm. (c) ICRS Macroscopic score of joint. n = 6 per group. condition A: nsPEF preconditioning of 10 ns at 20 kV/cm; condition B: nsPEF preconditioning of 100 ns at 10 kV/cm. Adapted with permission. Copyright © 2019 The Author(s). (d) Osteogenesis of BMSCs under varied fluid shear stress (FSS) after 7 days in growth medium was studied. (a′) Phase‐contrast micrographs depicted cells under different FSS levels stained for alkaline phosphatase (ALP), an osteoblast indicator. (b′) and (c′) Statistical analysis showed relative gene expression (OPN, col I) in BMMSCs under different FSS conditions. “***”: p < 0.001, “Δ”: p > 0.05. BCIP/NBT alkaline phosphatase color development kit: A kit from Beyotime Biotechnology Co., Ltd. (China); OPN: An RT‐PCR primer sequences of the tested genes. Adapted with permission. Copyright © 2021 The Author(s). (e) Schematic diagrams summarize pathways influenced by hydrostatic pressure during MSC chondrogenesis. (a′) Pressure upregulates estrogen receptor, triggering the estrogen receptor pathway and activating anabolic responses via c‐Jun N‐terminal kinases (JNK). (b′) Hydrostatic loading activates voltage‐gated calcium ion channels and calcium stores (SERCs) through purinergic signaling, involving ATP release and interaction with purine receptors, stimulating calcium signaling. (c′) Pressure‐induced chondrogenesis affects cytoskeletal structure via GTPases, promoting the anabolic response by activating N‐cadherins, leading to MSC condensation and subsequent chondrogenesis. Adapted with permission. Copyright © 2019 The Author(s). BMMSCs, bone marrow mesenchymal stem cells; MSCs, mesenchymal stem cells; RT‐PCR: reverse transcription‐polymerase chain reaction.
FIGURE 5
FIGURE 5
Biological strategies to improve cartilage differentiation of MSCs. (a) Morphological features of knee joints showed yellowish fibrocartilage in OA joints. Transplanting Vitamin E‐treated MSCs markedly reduced fibrosis. Adapted with permission. Copyright © 2016 Osteoarthritis Research Society International. (b) Impact of siTGFBI‐hMSCs in collagenase‐induced osteoarthritic (CIOA) mice. Histological images compared healthy (H) mice to CIOA mice untreated (NT) or treated with hMSCs transfected with control (siCT) or anti‐TGFBI (siTBI) mRNAs. (c) OA score of histological sections of knee joints of the CIOA mice. Results are expressed as the mean ± SEM; *: p < 0.05; ****: p < 0.0001. Adapted with permission. Copyright © 2019 Elsevier Ltd. (d) Matrilin‐3 inhibits Ad‐MSC‐induced chondrocyte hypertrophy. (A) mRNA expression of chondrogenic, hypertrophy, and ossification markers on day 14. G1: Control, G2: Ad‐MSC + matrilin‐3. *: p < 0.05, **: p < 0.01, ***: p < 0.001. Adapted with permission. Copyright © 2020 The Author(s). (e) Reduced OA severity observed with intra‐articular (IA) administration of STAT3 signaling inhibition (iSTAT3) OA MSCs in MIA‐induced OA rats. (a) Wistar rats underwent OA induction via IA injection of MIA. OA rats received IA injections of normal (Nor‐) MSCs, OA‐MSCs, or iSTAT3 OA‐MSCs. Pain behavior was assessed via mechanical hyperalgesia using a dynamic plantar esthesiometer and incapacitance meter, with paw‐withdrawal latency (PWL) and paw‐withdrawal threshold (PWT) quantified. Adapted with permission. Copyright © 2018 The Author(s). MIA, Monoiodoacetate; MSCs, mesenchymal stem cells; OA: osteoarthritis.
FIGURE 6
FIGURE 6
Biological strategies to improve cartilage differentiation of MSCs. (a) Pellet GAG content under physioxia and hyperoxia conditions for chondrogenic pellets. Dotted lines indicate thresholds for high (physioxia non‐responsive) and low (physioxia responsive) GAG donors. R represents physioxia responders, and NR indicates physioxia non‐responders. (b) Representative macroscopic and DMMB‐stained chondrogenic pellets of physioxia non‐responders and responders. Data are presented as mean ± standard deviation (SD); n = 5. * p < 0.05. DMMB dye: 18 μg/mL in 0.5% ethanol, 0.2% formic acid, 30 mM sodium formate, ph = 3. Adapted with permission. Copyright © 2020 The Author(s). (c) In vitro cell growth of BMMSCs maintained for 6 days under normal or hypoxic conditions. OM refers to osteogenic medium, and SM indicates standard medium. (d) Clonogenicity of BM‐MSCs (number of colony‐forming units [CFU] following BM‐MSC culture with standard medium) under either normoxic or hypoxic conditions. Adapted with permission. Copyright © 2016 International Society for Cellular Therapy. (e) SDSCs were pelletized and subjected to chondrogenic differentiation under normoxic and hypoxic conditions for 21 days. The effects were assessed by examining pellet morphology, size, and weight. Adapted with permission. Copyright © 2018 The Author(s). (f) Gene expression levels were measured via qRT‐PCR for cells cultured under hypoxic and normoxic conditions. (a′) Pluripotency genes KLF4, NANOG, and POU5F1 were analyzed. (b′) MSC differentiation genes, including osteogenic markers COL1A1 and RUNX2, chondrogenic markers SOX9 and COL2A1, and adipogenic marker PPARG, were assessed. Expression levels were normalized to GAPDH and P5H, with * indicating significant differences (p < 0.05) compared to the P5H sample. Adapted with permission. Copyright © 2020 The Author(s). BMMSCs, bone marrow mesenchymal stem cells; GAG, glycosaminoglycan; MSCs, mesenchymal stem cells; SDSCs, synovium‐derived stem cells.

Similar articles

Cited by

References

    1. Hunter DJ, March L, Chew M. Osteoarthritis in 2020 and beyond: a lancet commission. Lancet. 2020;396(10264):1711‐1712. - PubMed
    1. Hunter DJ, Schofield D, Callander E. The individual and socioeconomic impact of osteoarthritis. Nat Rev Rheumatol. 2014;10(7):437‐441. - PubMed
    1. Hunter DJ, Bierma‐Zeinstra S. Osteoarthritis. Lancet. 2019;393(10182):1745‐1759. - PubMed
    1. Tang X, Wang S, Zhan S, et al. The prevalence of symptomatic knee osteoarthritis in China: results from the China health and retirement longitudinal study. Arthritis Rheumatol. 2016;68(3):648‐653. - PubMed
    1. Sharma L. Osteoarthritis of the knee. N Engl J Med. 2021;384(1):51‐59. - PubMed

LinkOut - more resources