. 2024 Dec 3;11(1):e40881.
doi: 10.1016/j.heliyon.2024.e40881. eCollection 2025 Jan 15.

Development and validation of a prognostic nomogram incorporating neutrophil-to-albumin ratio for predicting overall survival in patients with nasopharyngeal carcinoma undergoing concurrent chemoradiotherapy

Affiliations

Development and validation of a prognostic nomogram incorporating neutrophil-to-albumin ratio for predicting overall survival in patients with nasopharyngeal carcinoma undergoing concurrent chemoradiotherapy

Xin Hua et al. Heliyon. .

Abstract

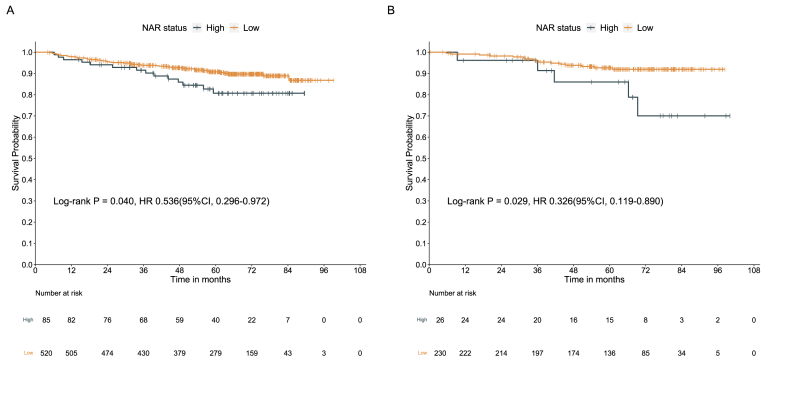
Background: Recent research suggests that the emerging neutrophil-albumin ratio (NAR) has a significant correlation with the survival outcomes across a range of tumors, yet its predictive significance for nasopharyngeal carcinoma (NPC) remains insufficiently investigated. This study aimed to evaluate the relationship between the neutrophil-to-albumin ratio (NAR) and overall survival (OS) in patients with NPC, as well as to develop a corresponding prognostic model.

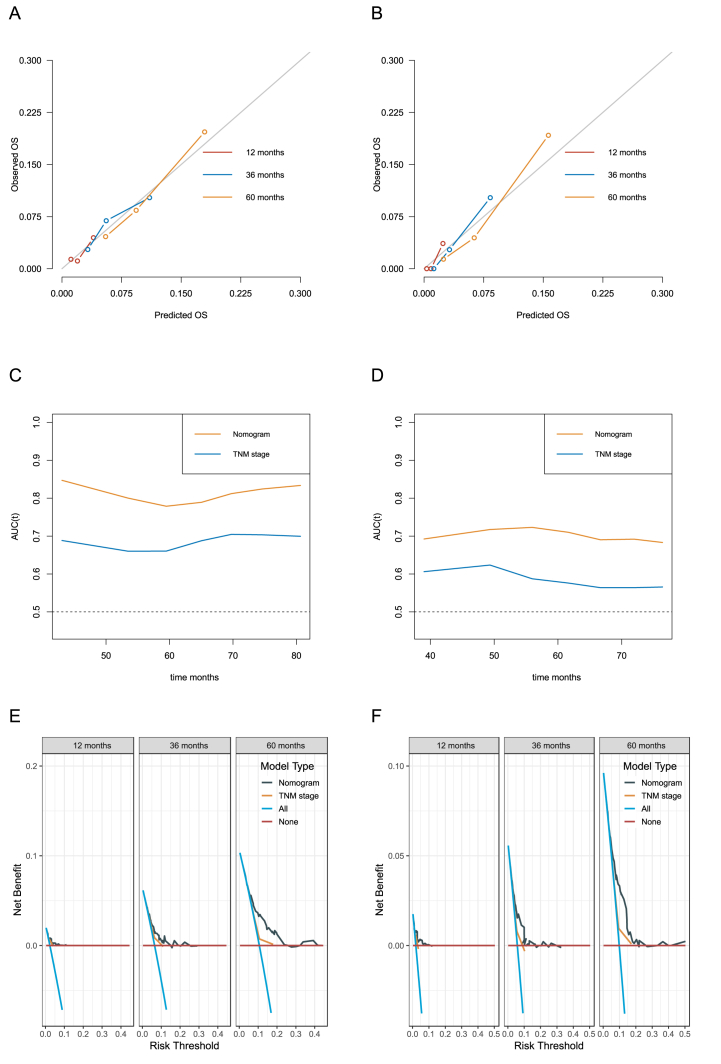
Methods: This retrospective analysis included 861 NPC patients treated with concurrent chemoradiotherapy (CCRT), who were randomly divided into a training group (n = 605) and a validation group (n = 256). To identify factors associated with OS and construct a prognostic nomogram, both univariate and multivariate Cox regression analyses were performed. The nomogram's prognostic accuracy was evaluated and independently validated.

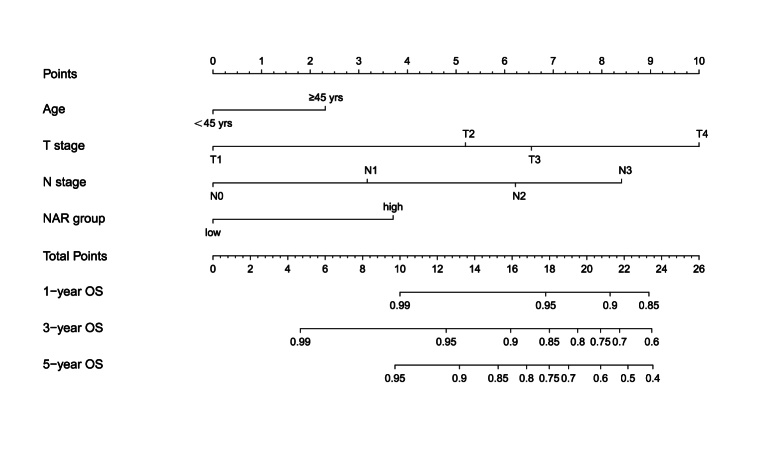
Results: The NAR score successfully segregated NPC patients into two categories with significantly different OS (HR = 0.536; 95 % CI: 0.296-0.972, P = 0.040). Through multivariate analysis, factors such as age, T stage, N stage, and NAR score were identified as independent predictors of OS, leading to the creation of a prognostic nomogram. This nomogram demonstrated superior predictive capability for OS [C-index = 0.702 (95 % CI: 0.636-0.768)], surpassing that of the conventional staging system [C-index = 0.651 (95 % CI: 0.549-0.752)]. The findings underwent internal validation within an independent cohort.

Conclusions: The NAR, an emergent biomarker combining nutritional and inflammatory status, offers a practical, low-cost, and non-invasive prognostic measure for NPC patients treated with CCRT. Additionally, the prognostic nomogram derived from NAR surpasses traditional staging systems in predictive accuracy.

Keywords: Concurrent chemoradiotherapy; Nasopharyngeal carcinoma; Neutrophil-albumin ratio; Nomogram; Prognosis.


Conflict of interest statement

The authors declare that they have no known competing financial interests or personal relationships that could have appeared to influence the work reported in this paper.

Figures

Fig. 1
Fig. 1
Survival curves obtained with Kaplan-Meier analysis between different NAR Groups (the HRs reported were unadjusted). A: Survival curves in the training cohort. B: Survival curves in the validation cohort. AbbreviationsNAR = neutrophil-albumin ratio; HR = hazard ratios; CI = confidence interval.
Fig. 2
Fig. 2
Nomogram of the current prognostic model for individualized survival predictions. The nomogram enables clinicians to assign points to each factor based on the patient's individual characteristics. For instance, the top row labeled “Age” assigns higher points to patients aged ≥45 years compared to those aged <45 years. Similarly, the row labeled “T stage” assigns more points to higher stages (T4, T3, and T2) compared to lower stages (T1). The third row labeled “N stage” assigns more points to higher stages (N3, N2, and N1) compared to lower stages (N0). The fourth row labeled “NAR group” assigns higher points to higher NAR values compared to lower NAR values. By summing the total points for all factors, clinicians can use the bottom row labeled “Total Points” to determine the predicted OS rate. This nomogram provides estimates for 1-year, 3-year, and 5-year OS rates. Clinicians can draw a line from the Total Points axis to the corresponding survival probability axis, providing a visual representation of the patient's expected survival chances. AbbreviationsOS = overall survival; NAR = neutrophil-albumin ratio.
Fig. 3
Fig. 3
Assessment of predictive performance of the prognostic model. (A) Calibration plot of the nomogram model at 1-, 3-, and 5-year in the training cohort. Calibration plot, the x-axis typically represents the predicted probabilities, while the y-axis shows the actual fraction of positive cases. Ideally, the plot should show a straight line at a 45-degree angle, indicating perfect calibration where the observed outcomes match the predicted probabilities perfectly. Our calibration plot nearly coincides with the Y = X line, demonstrating good model calibration. (B) Calibration plot of the nomogram model at 1-, 3-, and 5-year in the validation cohort. Calibration plot, the x-axis typically represents the predicted probabilities, while the y-axis shows the actual fraction of positive cases. Ideally, the plot should show a straight line at a 45-degree angle, indicating perfect calibration where the observed outcomes match the predicted probabilities perfectly. Our calibration plot nearly coincides with the Y = X line, demonstrating good model calibration. (C) Time-independent ROC curves compared the predictive accuracy of the current model and the traditional TNM stage in the training cohort.(D) Time-independent ROC curves compared the predictive accuracy of the current model and the traditional TNM stage in the validation cohort. (E) DCA curves compared the net benefit rate of the current model and the traditional TNM stage in the training cohort. The DCA curve is a graphical representation where the x-axis displays the range of threshold probabilities and the y-axis shows the net benefit. The DCA curves based on 1-year, 3-year, and 5-year overall survival benefits clearly demonstrate that the proposed model provides a significantly higher net benefit compared to the traditional staging system in the training set. (F) DCA curves compared the net benefit rate of the current model and the traditional TNM stage in the validation cohort. The DCA curve is a graphical representation where the x-axis displays the range of threshold probabilities and the y-axis shows the net benefit. The DCA curves based on 1-year, 3-year, and 5-year overall survival benefits clearly demonstrate that the proposed model provides a significantly higher net benefit compared to the traditional staging system in the validation set. Abbreviations: OS = overall survival; AUC = area under curve; TNM = tumor-node-metastasis.

Similar articles

Cited by

References

    1. Chen Y.P., et al. Nasopharyngeal carcinoma. Lancet. 2019;394(10192):64–80. - PubMed
    1. Chang E.T., et al. The evolving epidemiology of nasopharyngeal carcinoma. Cancer Epidemiol. Biomarkers Prev. 2021;30(6):1035–1047. - PubMed
    1. Huang H., et al. Immunotherapy for nasopharyngeal carcinoma: Current status and prospects (Review) Int J Oncol. 2023;63(2) - PMC - PubMed
    1. Chang E.T., Adami H.O. The enigmatic epidemiology of nasopharyngeal carcinoma. Cancer Epidemiol. Biomarkers Prev. 2006;15(10):1765–1777. - PubMed
    1. Zhang R., et al. Nasopharyngeal carcinoma burden and its attributable risk factors in China: estimates and forecasts from 1990 to 2050. Int. J. Environ. Res. Publ. Health. 2023;20(4) - PMC - PubMed

LinkOut - more resources