

Tibiofemoral cartilage strain and recovery following a 3-mile run measured using deep learning segmentation of bone and cartilage
- PMID: 39802079
- PMCID: PMC11720442
- DOI: 10.1016/j.ocarto.2024.100556
Tibiofemoral cartilage strain and recovery following a 3-mile run measured using deep learning segmentation of bone and cartilage
Abstract
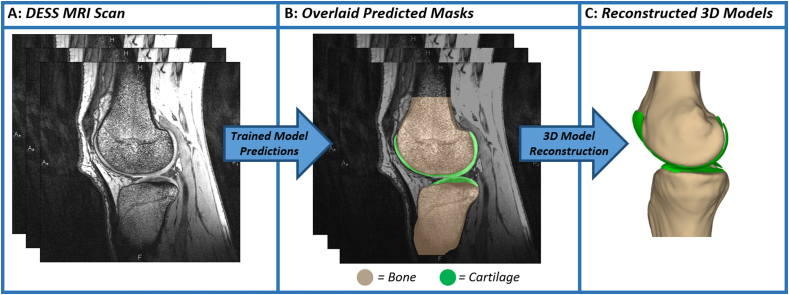
Objective: We sought to measure the deformation of tibiofemoral cartilage immediately following a 3-mile treadmill run, as well as the recovery of cartilage thickness the following day. To enable these measurements, we developed and validated deep learning models to automate tibiofemoral cartilage and bone segmentation from double-echo steady-state magnetic resonance imaging (MRI) scans.
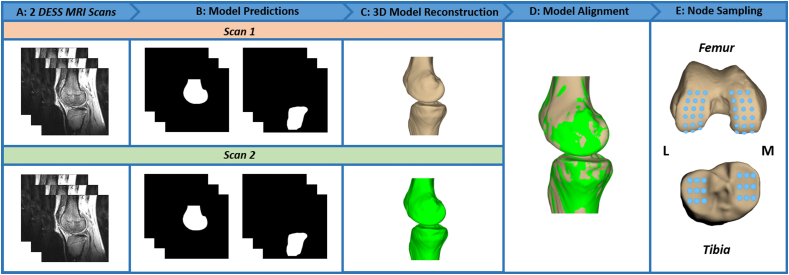
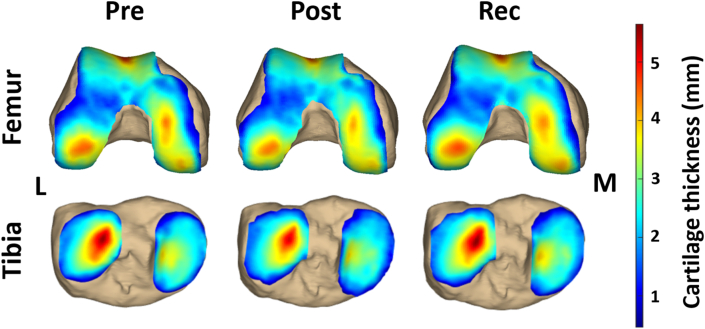
Design: Eight asymptomatic male participants arrived at 7 a.m., rested supine for 45 min, underwent pre-exercise MRI, ran 3 miles on a treadmill, and finally underwent post-exercise MRI. To assess whether cartilage recovered to its baseline thickness, participants returned the following morning at 7 a.m., rested supine for 45 min, and underwent a final MRI session. These images were used to generate 3D models of the tibia, femur, and cartilage surfaces at each time point. Site-specific tibial and femoral cartilage thicknesses were measured from each 3D model. To aid in these measurements, deep learning segmentation models were developed.
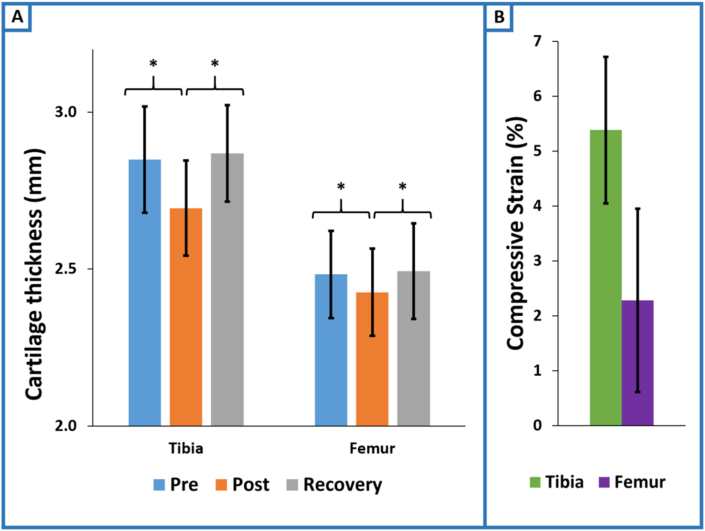
Results: All trained deep learning models demonstrated repeatability within 0.03 mm or approximately 1 % of cartilage thickness. The 3-mile run induced mean compressive strains of 5.4 % (95 % CI = 4.1 to 6.7) and 2.3 % (95 % CI = 0.6 to 4.0) for the tibial and femoral cartilage, respectively. Furthermore, both tibial and femoral cartilage thicknesses returned to within 1 % of baseline thickness the following day.
Conclusions: The 3-mile treadmill run induced a significant decrease in both tibial and femoral cartilage thickness; however, this was largely ameliorated the following morning.
Keywords: Auto-segmentation; Cartilage deformation; Cartilage thickness; Magnetic resonance imaging; UNet.
© 2024 The Author(s).
Conflict of interest statement
This work was prepared while Dr. Amber Collins was employed at Duke University School of Medicine. The opinions expressed in this article are the author’s own and do not reflect the view of the National Institutes of Health, the Department of Health and Human Services, or the United States government. The remaining authors have no conflicts of interest to disclose.
Figures
References
-
- Eckstein F., Wluka A.E., Wirth W., Cicuttini F. 30 Years of MRI-based cartilage & bone morphometry in knee osteoarthritis: from correlation to clinical trials. Osteoarthritis Cartilage. 2024;32:439–451. - PubMed
-
- Coburn S.L., Crossley K.M., Kemp J.L., Warden S.J., West T.J., Bruder A.M., et al. Is running good or bad for your knees? A systematic review and meta-analysis of cartilage morphology and composition changes in the tibiofemoral and patellofemoral joints. Osteoarthritis Cartilage. 2023;31:144–157. - PubMed
Grants and funding
LinkOut - more resources
Full Text Sources
Miscellaneous
