Review
. 2024 Dec 16:56:101571.
doi: 10.1016/j.ijcha.2024.101571. eCollection 2025 Feb.

Bibliometric analysis of levosimendan

Affiliations
Review

Bibliometric analysis of levosimendan

Xian-Shu Zhao et al. Int J Cardiol Heart Vasc. .

Abstract

Background: Levosimendan (LEVO), a calcium sensitizer and adenosine triphosphate-dependent potassium channel opener, has been widely used for decades in medical and surgical patients for advanced heart failure (HF), right ventricular failure, cardiogenic shock, takotsubo cardiomyopathy, pulmonary hypertension, and so on. Currently, as the limited scope and lack of comprehensive data in current LEVO publications, there is an increasing obstacle to conducting new studies that require integrated information and quantifiable results. Thus, the current study was performed to identify the research trends and hot spots in LEVO-related publications using bibliometric software.

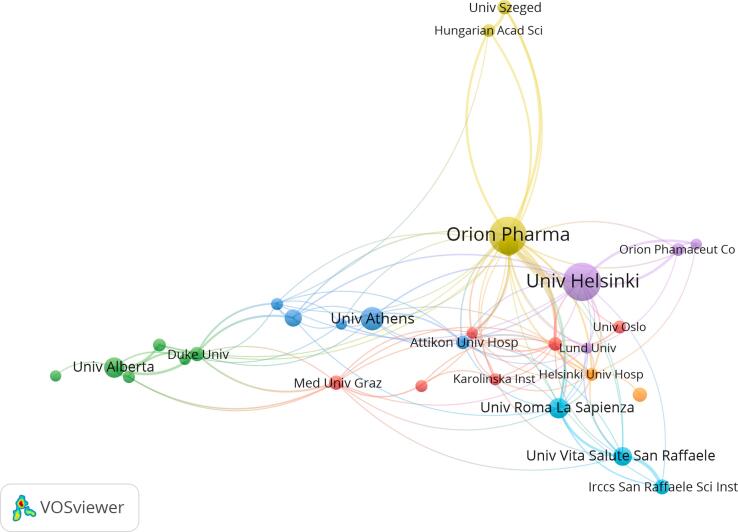
Methods: LEVO-related publications from 1990 to 2023 were searched and retrieved in the Web of Science Core Collection (WoSCC) and analyzed with VOSviewer, CiteSpace, Scimago Graphica, R-bibliometrix and Rstudio for publication dates, countries/regions, institutions, authors, keywords, journals, and references.

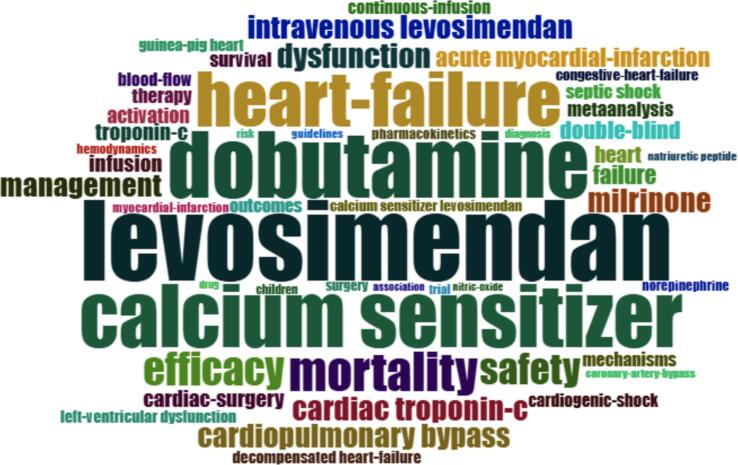
Results: Finally, a total of 1,432 LEVO-related articles were included in the present study. Annual LEVO-related publications have been increased yearly. The United States was the most productive country with 243 articles. The University of Helsinkin published 69 articles in the field of LEVO, which were the most productive institution among all the institutions. Of all the authors, professor Pollesello,Piero was the most productive author with 62 articles. Moreover, the results of the co-citation analysis and citation bursts analysis revealed that the safety and effectiveness of LEVO were the global research trends and potential hot spots.

Conclusions: This study systematically summarizes the current status in the field of LEVO and provides insights into the research focuses and future hotspots.

Keywords: Bibliometric analysis; Hot spots; Levosimendan; Trends.


Conflict of interest statement

The authors declare that they have no known competing financial interests or personal relationships that could have appeared to influence the work reported in this paper.

Figures

Fig. 1
Fig. 1
Flowchart of study identification and selection based on Web of Science.
Fig. 2
Fig. 2
Overview of publications around the world by 2023. (A) Timeline of publications and citations on LEVO; (B) World atlas of publications in different countries and relationships among the countries. The size of the circle and the font size in the world map indicates the number of publications. The lines between countries means the countries cooperate with each other; (C) Network evaluating international collaborations; (D) The annual citation number and the annual H-index of publications.
Fig. 2
Fig. 2
Overview of publications around the world by 2023. (A) Timeline of publications and citations on LEVO; (B) World atlas of publications in different countries and relationships among the countries. The size of the circle and the font size in the world map indicates the number of publications. The lines between countries means the countries cooperate with each other; (C) Network evaluating international collaborations; (D) The annual citation number and the annual H-index of publications.
Fig. 3
Fig. 3
Country analysis. (A) Corresponding author’s countries; (B) Network map of co-authorship country; (C) Density map of co-authorship country.
Fig. 3
Fig. 3
Country analysis. (A) Corresponding author’s countries; (B) Network map of co-authorship country; (C) Density map of co-authorship country.
Fig. 3
Fig. 3
Country analysis. (A) Corresponding author’s countries; (B) Network map of co-authorship country; (C) Density map of co-authorship country.
Fig. 4
Fig. 4
Institution analysis. (A) Network map of interinstitutional cooperation; (B) Dynamic graph of temporal trends of articles published in the LEVO field; (C) Density map of co-authorship institution.
Fig. 4
Fig. 4
Institution analysis. (A) Network map of interinstitutional cooperation; (B) Dynamic graph of temporal trends of articles published in the LEVO field; (C) Density map of co-authorship institution.
Fig. 4
Fig. 4
Institution analysis. (A) Network map of interinstitutional cooperation; (B) Dynamic graph of temporal trends of articles published in the LEVO field; (C) Density map of co-authorship institution.
Fig. 5
Fig. 5
Overview of co-authorships around the world. (A) Network map of author collaboration; (B) Top 14 authors’ publications over time. The different color indicates the corresponding cluster of A. The size of the circle in the line chart refers to the number of publications, and the depth of the round color represents the number of citations. (C) Lotka's law of authors involved in LEVO research. Solid black line indicates the distribution of published articles according to Lotkaw’s law. The dotted line indicates the publication on subject matter.
Fig. 5
Fig. 5
Overview of co-authorships around the world. (A) Network map of author collaboration; (B) Top 14 authors’ publications over time. The different color indicates the corresponding cluster of A. The size of the circle in the line chart refers to the number of publications, and the depth of the round color represents the number of citations. (C) Lotka's law of authors involved in LEVO research. Solid black line indicates the distribution of published articles according to Lotkaw’s law. The dotted line indicates the publication on subject matter.
Fig. 6
Fig. 6
Journal Analysis. (A) Visualization map of co-cited journals; (B) Bradford's law of journals involved in LEVO research.
Fig. 6
Fig. 6
Journal Analysis. (A) Visualization map of co-cited journals; (B) Bradford's law of journals involved in LEVO research.
Fig. 7
Fig. 7
The dual-map overlay of journals.
Fig. 8
Fig. 8
Research focuses and keywords burst by 2023. (A)Word cloud; (B) Visualization map of keywords. Node size and color represents the number of keywords and cluster. Lines of different colors show that the 2 keywords appear in an article; (C) Dynamic graph of temporal trends of keywords in the LEVO field; (D) Keyword heat map and emergence. The frequency of keyword occurrence was processed by standardization, and the values were distributed between 0 and 1, where each little cell shows the frequency of occurrence of a term in one year. The value of the blue cell is the smallest, representing the lowest frequency of keyword occurrence this year. With the color change, the value of the pink cell is the largest, and its corresponding keyword has the highest frequency of occurrence this year. (E) Keywords with the strongest citation bursts. The blue cell indicates when keyword bursts were detected, and the pink cell displays the time interval.
Fig. 8
Fig. 8
Research focuses and keywords burst by 2023. (A)Word cloud; (B) Visualization map of keywords. Node size and color represents the number of keywords and cluster. Lines of different colors show that the 2 keywords appear in an article; (C) Dynamic graph of temporal trends of keywords in the LEVO field; (D) Keyword heat map and emergence. The frequency of keyword occurrence was processed by standardization, and the values were distributed between 0 and 1, where each little cell shows the frequency of occurrence of a term in one year. The value of the blue cell is the smallest, representing the lowest frequency of keyword occurrence this year. With the color change, the value of the pink cell is the largest, and its corresponding keyword has the highest frequency of occurrence this year. (E) Keywords with the strongest citation bursts. The blue cell indicates when keyword bursts were detected, and the pink cell displays the time interval.
Fig. 9
Fig. 9
Co-cited reference analysis. (A) Visualization map of co-cited references; (B) Timeline of co-cited references.
Fig. 9
Fig. 9
Co-cited reference analysis. (A) Visualization map of co-cited references; (B) Timeline of co-cited references.
Fig. 10
Fig. 10
Cluster analysis of LEVO field. (A) Visualization map of co-cited reference cluster; (B) Evolution of co-cited reference cluster.
Fig. 10
Fig. 10
Cluster analysis of LEVO field. (A) Visualization map of co-cited reference cluster; (B) Evolution of co-cited reference cluster.
Fig. 11
Fig. 11
The top 25 references with the strongest strength citation bursts.

References

    1. Yilmaz M.B., Grossini E., Silva Cardoso J.C., Édes I., Fedele F., Pollesello P., Kivikko M., Harjola V.P., Hasslacher J., Mebazaa A., Morelli A., le Noble J., Oldner A., Oulego Erroz I., Parissis J.T., Parkhomenko A., Poelzl G., Rehberg S., Ricksten S.E., Rodríguez Fernández L.M., Salmenperä M., Singer M., Treskatsch S., Vrtovec B., Wikström G. Renal effects of levosimendan: a consensus report. Cardiovasc. Drugs Ther. 2013;27(6):581–590. doi: 10.1007/s10557-013-6485-6. (PMID: 23929366; PMCID: PMC3830192) - DOI - PMC - PubMed
    1. Papp Z., Agostoni P., Alvarez J., Bettex D., Bouchez S., Brito D., Černý V., Comin-Colet J., Crespo-Leiro M.G., Delgado J.F., Édes I., Eremenko A.A., Farmakis D., Fedele F., Fonseca C., Fruhwald S., Girardis M., Guarracino F., Harjola V.P., Heringlake M., Herpain A., Heunks L.M.A., Husebye T., Ivancan V., Karason K., Kaul S., Kivikko M., Kubica J., Masip J., Matskeplishvili S., Mebazaa A., Nieminen M.S., Oliva F., Papp J.G., Parissis J., Parkhomenko A., Põder P., Pölzl G., Reinecke A., Ricksten S.E., Riha H., Rudiger A., Sarapohja T., Schwinger R.H.G., Toller W., Tritapepe L., Tschöpe C., Wikström G., Lewinski D.V., Vrtovec B., Pollesello P. Levosimendan efficacy and safety: 20 Years of SIMDAX in clinical use. J. Cardiovasc. Pharmacol. 2020;76(1):4–22. doi: 10.1097/FJC.0000000000000859. (PMID: 32639325; PMCID: PMC7340234) - DOI - PMC - PubMed
    1. Kong X., Hu X., Hua B., Fedele F., Farmakis D., Pollesello P. Levosimendan in Europe and China: an appraisal of evidence and context. Eur Cardiol. 2021;8(16) doi: 10.15420/ecr.2021.41. (PMID: 34815750; PMCID: PMC8591618) - DOI - PMC - PubMed
    1. Cholley B., Levy B., Fellahi J.L., Longrois D., Amour J., Ouattara A., Mebazaa A. Levosimendan in the light of the results of the recent randomized controlled trials: an expert opinion paper. Crit. Care. 2019;23(1):385. doi: 10.1186/s13054-019-2674-4. (PMID: 31783891; PMCID: PMC6883606) - DOI - PMC - PubMed
    1. Pan J., Yang Y.M., Zhu J.Y., Lu Y.Q. Multiorgan drug action of levosimendan in critical illnesses. Biomed Res. Int. 2019;19 doi: 10.1155/2019/9731467. (PMID: 31641670; PMCID: PMC6770297) - DOI - PMC - PubMed

LinkOut - more resources