

An open source ultrasonic flowmeter for monitoring the input/output flow rates of wastewater treatment plants
- PMID: 39802194
- PMCID: PMC11719284
- DOI: 10.1016/j.ohx.2024.e00613
An open source ultrasonic flowmeter for monitoring the input/output flow rates of wastewater treatment plants
Abstract
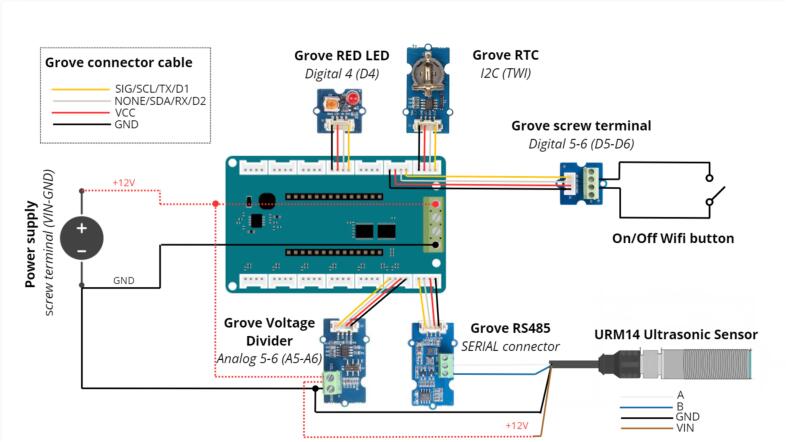
Sensors play an important role in both the continuous monitoring and intermittent analyses, which are essential for the study of wastewater treatment plant management and conducting related research. Given the significant environmental impact of the issues involved, accurate measurement of the volume of water flowing into and out of treatment plants is a key parameter for plant management, ecotoxicological studies and academic research programs. Traditionally, flow measurements have been based on calibrated weirs or venturi flumes, using water level measurements for conversion into flow, according to established relationships. In this article, the authors propose an innovative approach to explore the feasibility of developing an open-source, reparable and cost-effective data logger for flow monitoring using ultrasonic technology. By leveraging Arduino modules and a complementary Grove shield, the proposed data logger offers seamless integration and affordability. In particular, it features an on-board web server to facilitate data collection and device testing, offering accessibility through Wi-Fi connectivity with smartphones or computers. The authors demonstrate the effectiveness of their flowmeter by comparing its performance with that of a commercial reference flowmeter, yielding a maximum permissible measurement error of 0.6 mm on the water level measurement. Furthermore, they demonstrate the durability and reliability of the developed data logger through extensive field-testing over a 9-month period.
Keywords: Low-tech; Monitoring; Treatment plant; Ultrasonic sensor; Wastewater; Water level.
© 2024 The Author(s).
Conflict of interest statement
The authors declare that they have no known competing financial interests or personal relationships that could have appeared to influence the work reported in this paper.
Figures


Similar articles
-
[Standard technical specifications for methacholine chloride (Methacholine) bronchial challenge test (2023)].Zhonghua Jie He He Hu Xi Za Zhi. 2024 Feb 12;47(2):101-119. doi: 10.3760/cma.j.cn112147-20231019-00247. Zhonghua Jie He He Hu Xi Za Zhi. 2024. PMID: 38309959 Chinese.
-
Low-Cost Approach to an Instream Water Depth Sensor Construction Using Differential Pressure Sensors and Arduino Microcontrollers.Sensors (Basel). 2024 Apr 12;24(8):2488. doi: 10.3390/s24082488. Sensors (Basel). 2024. PMID: 38676104 Free PMC article.
-
Reliability Testing of a Low-Cost, Multi-Purpose Arduino-Based Data Logger Deployed in Several Applications Such as Outdoor Air Quality, Human Activity, Motion, and Exhaust Gas Monitoring.Sensors (Basel). 2023 Aug 25;23(17):7412. doi: 10.3390/s23177412. Sensors (Basel). 2023. PMID: 37687868 Free PMC article.
-
Microbial Fuel Cell-Based Biological Oxygen Demand Sensors for Monitoring Wastewater: State-of-the-Art and Practical Applications.ACS Sens. 2020 Aug 28;5(8):2297-2316. doi: 10.1021/acssensors.0c01299. Epub 2020 Aug 14. ACS Sens. 2020. PMID: 32786393 Review.
-
Flow measurement in mechanical ventilation: a review.Med Eng Phys. 2015 Mar;37(3):257-64. doi: 10.1016/j.medengphy.2015.01.010. Epub 2015 Feb 7. Med Eng Phys. 2015. PMID: 25659299 Review.
Cited by
-
A float-controlled self-contained laser gauge for monitoring river levels in tropical environments.HardwareX. 2025 Jul 24;23:e00682. doi: 10.1016/j.ohx.2025.e00682. eCollection 2025 Sep. HardwareX. 2025. PMID: 40761713 Free PMC article.
References
-
- APHA-AWWA-WEF, Standard Methods for the Examination of Water and Wastewater, in: T.S.S. New York Method 2540 D, 2.-55 a 2.-59 (Ed.), 21th Editi, 2005.
-
- Corominas L.l., Garrido-Baserba M., Villez K., Olsson G., Cortés U., Poch M. Transforming data into knowledge for improved wastewater treatment operation: A critical review of techniques. Environmental Modelling & Software 106. 2018:89–103. doi: 10.1016/j.envsoft.2017.11.023. - DOI
-
- Suard E., Clément R., Fayolle Y., Alliet M., Albasi C., Gillot S. Electrical resistivity tomography used to characterize bubble distribution in complex aerated reactors: Development of the method and application to a semi-industrial MBR in operation. Chem. Eng. J. 2019;355:498–509. doi: 10.1016/j.cej.2018.08.014. - DOI
LinkOut - more resources
Full Text Sources
