. 2024 Dec 11:14:101856.
doi: 10.1016/j.toxrep.2024.101856. eCollection 2025 Jun.

Gossypol enhances ponatinib's cytotoxicity against human hepatocellular carcinoma cells by involving cell cycle arrest, p-AKT/LC3II/p62, and Bcl2/caspase-3 pathways

Affiliations

Gossypol enhances ponatinib's cytotoxicity against human hepatocellular carcinoma cells by involving cell cycle arrest, p-AKT/LC3II/p62, and Bcl2/caspase-3 pathways

Hadeel H Elkattan et al. Toxicol Rep. .

Abstract

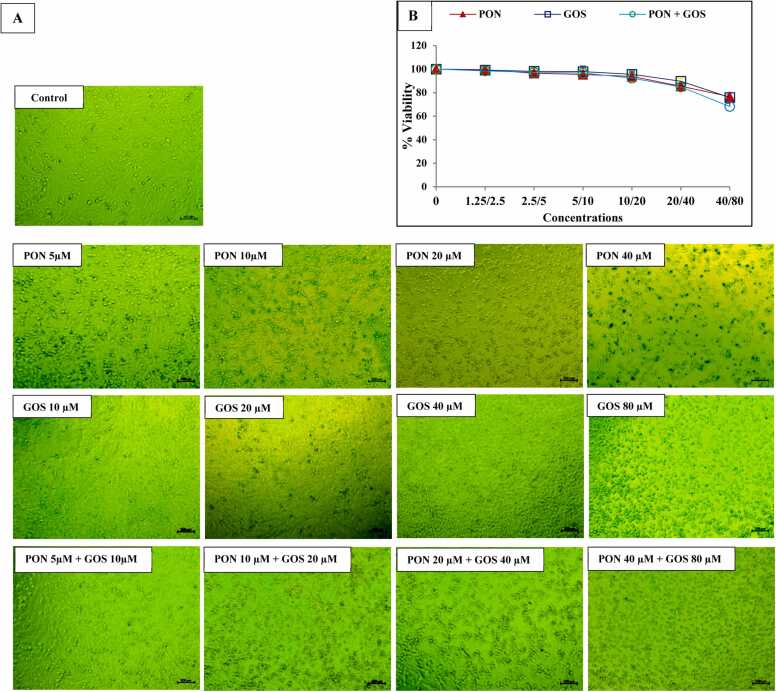
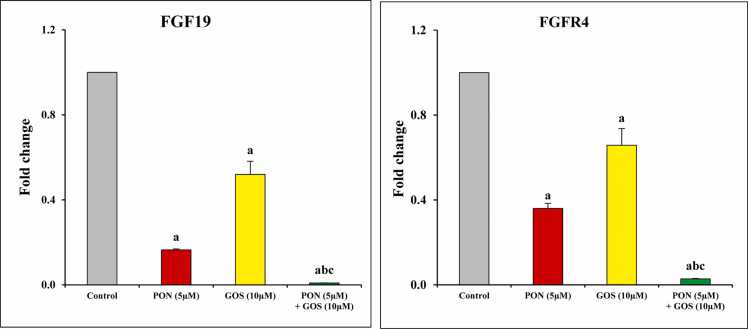
Despite significant breakthroughs in frontline cancer research and chemotherapy for hepatocellular carcinoma (HCC), many of the suggested drugs have high toxic side effects and resistance, limiting their clinical utility. Exploring potential therapeutic targets or novel combinations with fewer side effects is therefore crucial in combating this dreadful disease. The current study aims to use a novel combination of ponatinib and gossypol against the HepG2 cell line. Cell survival, FGF19/FGFR4, apoptotic and autophagic cell death, and synergistic drug interactions were assessed in response to increasing concentrations of ponatinib and/or gossypol treatment. Research revealed that ponatinib (1.25-40 μM) and gossypol (2.5-80 μM) reduced the viability of HepG2 cells in a way that was dependent on both time and dose. Ponatinib's anti-proliferation effectiveness was improved synergistically by gossypol and was associated with a rise in apoptotic cell death, cell cycle blockage during the G0/G1 phase, and suppression of the FGF19/FGFR4 axis. Furthermore, the ponatinib/gossypol combination lowered Bcl-2 and p-Akt while increasing active caspase-3, Beclin-1, p62, and LC3II. This combination, however, had no harm on normal hepatocytes. Overall, gossypol enhanced ponatinib's anticancer effects in HCC cells. Notably, this new combination appears to be potential adjuvant targeted chemotherapy, a discovery that warrants more clinical investigation, in the management of patients with HCC.

Keywords: Apoptosis; Autophagy; Cell cycle arrest; Gossypol; Hepatocellular carcinoma; Ponatinib.


Conflict of interest statement

The authors declare that they have no known competing financial interests or personal relationships that could have appeared to influence the work reported in this paper

Figures

None
Graphical abstract
Fig. 1
Fig. 1
The effect of ponatinib (1.25 −40 μM) and gossypol (2.5–80 μM) alone (A and B) and their combination (C and D) at 1: 2 ratios on the viability of HepG2 cells after 24 and 48 h, respectively, using the MTT assay. The cell viability percentage was calculated by multiplying the absorbance ratio between the compound-treated cell culture and the untreated control by 100. Data are presented as Mean ± SEM (n = 3) and analyzed by one-way ANOVA test followed by a Tukey’s post hoc test. (E) The effect of ponatinib and/or gossypol on HepG2 morphological alterations after 48 h. Morphological pictures of the cells were obtained using an inverted phase contrast microscope (Reichert Jung, Nikon Eclipse TS200, Nikon) at a magnification of 200x. PON: ponatinib, GOS: gossypol. a, b, c Significantly different from untreated control, PON and GOS groups, respectively, at P ˂ 0.05.
Fig. 2
Fig. 2
The effect of ponatinib (1.25 −40 μM) and gossypol (2.5–80 μM) alone or in combination at 1: 2 ratios on the morphological alterations of primary hepatocytes after 48 h (A). Morphological pictures of the cells were obtained using an inverted phase contrast microscope (Reichert Jung, Nikon Eclipse TS200, Nikon) at a magnification of 200x. (B) The effect of ponatinib and/or gossypol on the % viability of normal hepatocyte after 48 h, using the MTT assay. The cell viability percentage was calculated by multiplying the absorbance ratio between the compound-treated cell culture and the untreated control by 100. Data are presented as Mean ± SEM (n = 3) and analyzed by one-way ANOVA test followed by a Tukey’s post hoc test. PON: ponatinib, GOS: gossypol.
Fig. 3
Fig. 3
Combination (A and C) and dose reduction (B and D) index plots of ponatinib combined with gossypol at a constant ratio (1:2) in HepG2 at 24 h and 48 h, respectively. CI < 1, CI = 1, and CI > 1 represented synergism, additive effect, and antagonism, respectively. The CI is calculated as (dA/DA) + (dB/DB), where dA and dB are the concentrations of PON and GOS together, and DA and DB are the concentrations of PON or GOS that induce the same effect alone. The computer software CompuSyn (version 1.0.1) was used to calculate the combined drugs' CI, DRI, and Fa. PON: Ponatinib, GOS: Gossypol, CI: Combination Index, DRI: Dose reduction index, Fa: Fraction affected.
Fig. 4
Fig. 4
Ponatinib and gossypol combination induced cell cycle arrest at G0/G1 in HepG2 cells. Cell cycle distribution of HepG2 cells was analyzed by flow cytometry at different phases after 48 hours in (A) untreated control, (B) PON IC50, (C) GOS IC50, and (D) PON IC50 + GOS IC50. (E) Cell cycle distribution of HepG2 cells at different phases is represented as a histogram. Data are presented as Mean ± SEM (n = 3) and analyzed by one-way ANOVA test followed by a Tukey’s post hoc test. IC50: the dose of ponatinib and gossypol required to suppress cell growth by 50 % and was determined using nonlinear regression analysis (GraphPad Software Instat, version 5; Inc., La Jolla, CA, USA). PON: ponatinib, GOS: gossypol. a, b, c Significantly different from the untreated control, PON and GOS groups, respectively at P ˂0.05.
Fig. 5
Fig. 5
The effect of ponatinib alone and in combination with gossypol on FGF19/FGFR4 axis in HepG2 cells after 48 h. Data are presented as Mean ± SEM (n = 3) and analyzed by one-way ANOVA test followed by a Tukey’s post hoc test. PON: ponatinib, GOS: gossypol. a, b, c Significantly different from the untreated control, PON and GOS groups, respectively at P ˂0.05.
Fig. 6
Fig. 6
Gossypol enhances the apoptotic activity of ponatinib in HepG2 cells. Apoptotic cells were determined by PI and Annexin-V staining and analyzed by flow cytometry after 48 h in (A) untreated control, (B) PON IC50, (C) GOS IC50, and (D) PON IC50 + GOS IC50. (E) The X-axis depicts various treatments for HepG2 cells, while the Y-axis reflects the proportion of apoptotic/necrotic cells. (F, G) Apoptotic markers such as Bcl-2 and caspase-3 were tested in HepG2 cells after 48 h of treatment. Data are presented as Mean ± SEM (n = 3) and analyzed by one-way ANOVA test followed by a Tukey’s post hoc test. IC50: the dose of ponatinib and gossypol required to suppress cell growth by 50 % and was determined using nonlinear regression analysis (GraphPad Software Instat, version 5; Inc., La Jolla, CA, USA). PON: ponatinib, GOS: gossypol. a, b, c Significantly different from untreated control, PON and GOS groups, respectively at P ˂0.05.
Fig. 7
Fig. 7
Autophagic markers p-AKT, beclin-1, LC3II and p62 were evaluated in HepG2 cells after 48 h in untreated control, PON IC50, GOS IC50, and PON IC50 + GOS IC50. Data are presented as Mean ± SEM (n = 3) and analyzed by one-way ANOVA test followed by a Tukey’s post hoc test. IC50: the dose of ponatinib and gossypol required to suppress cell growth by 50 % was determined using nonlinear regression analysis (GraphPad Software Instat, version 5; Inc., La Jolla, CA, USA). PON: ponatinib, GOS: gossypol. a, b, c Significantly different from untreated control, PON and GOS groups, respectively at P ˂ 0.05.

Similar articles

References

    1. Zhang H., Zhang W., Jiang L., Chen Y. Recent advances in systemic therapy for hepatocellular carcinoma. Biomark. Res. 2022;10(1):1–21. doi: 10.1186/S40364-021-00350-4. 2021 10. - DOI - PMC - PubMed
    1. Su G.L., Altayar O., O’Shea R., Shah R., Estfan B., Wenzell C., Sultan S., Falck-Ytter Y. AGA clinical practice guideline on systemic therapy for hepatocellular carcinoma. Gastroenterology. 2022;162:920–934. doi: 10.1053/j.gastro.2021.12.276. - DOI - PubMed
    1. Tu S., Zhang X., Luo D., Liu Z., Yang X., Wan H., Yu L., Li H., Wan F. Effect of taurine on the proliferation and apoptosis of human hepatocellular carcinoma HepG2 cells. Exp. Ther. Med. 2015;10:193–200. doi: 10.3892/ETM.2015.2476/HTML. - DOI - PMC - PubMed
    1. Shinde S.D., Sahu B., Chamoli A., Mandoli A., Kalia K., Behera S.K. Tyrosine kinases: their role in hepatocellular carcinoma. Thera Precis. Med. Manag. Hepatocell. Carcinoma, Vol. 2: Diagn., Ther. Targets, Mol. Mech. 2022:133–148. doi: 10.1016/B978-0-323-98807-0.00010-7. - DOI
    1. Yamaoka T., Kusumoto S., Ando K., Ohba M., Ohmori T. Receptor tyrosine kinase-targeted cancer therapy. Int J. Mol. Sci. 2018;19 doi: 10.3390/ijms19113491. - DOI - PMC - PubMed

LinkOut - more resources