[Preprint]. 2024 Nov 15:2024.11.14.24317204.
doi: 10.1101/2024.11.14.24317204.

Mapping chromatin interactions at melanoma susceptibility loci and cell-type specific dataset integration uncovers distant gene targets of cis-regulation

Affiliations

Mapping chromatin interactions at melanoma susceptibility loci and cell-type specific dataset integration uncovers distant gene targets of cis-regulation

Rohit Thakur et al. medRxiv. .

Update in

Abstract

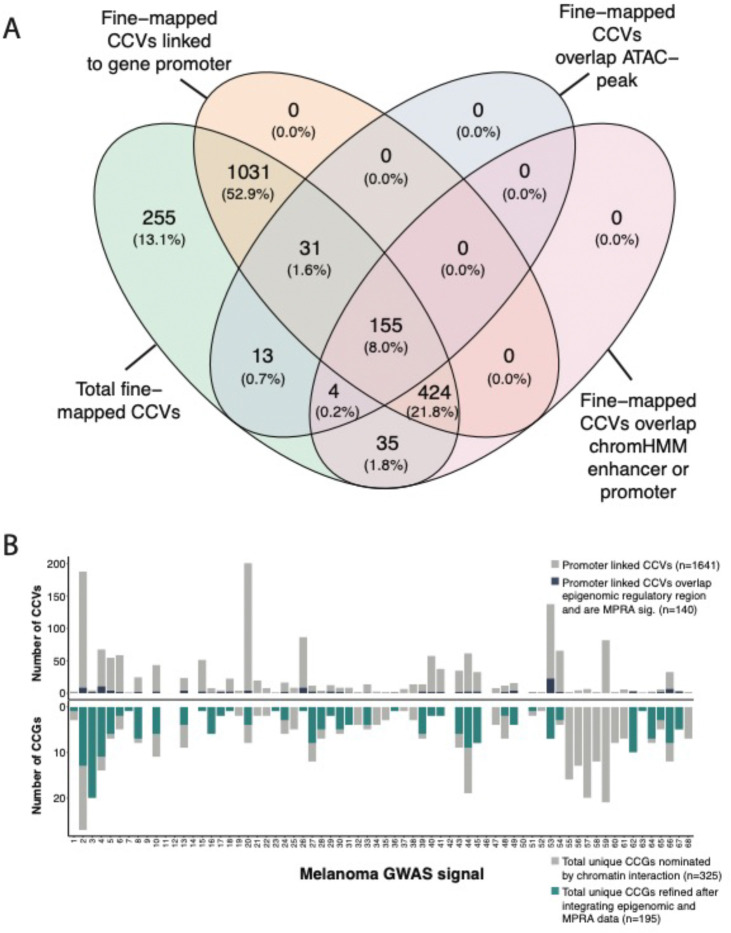
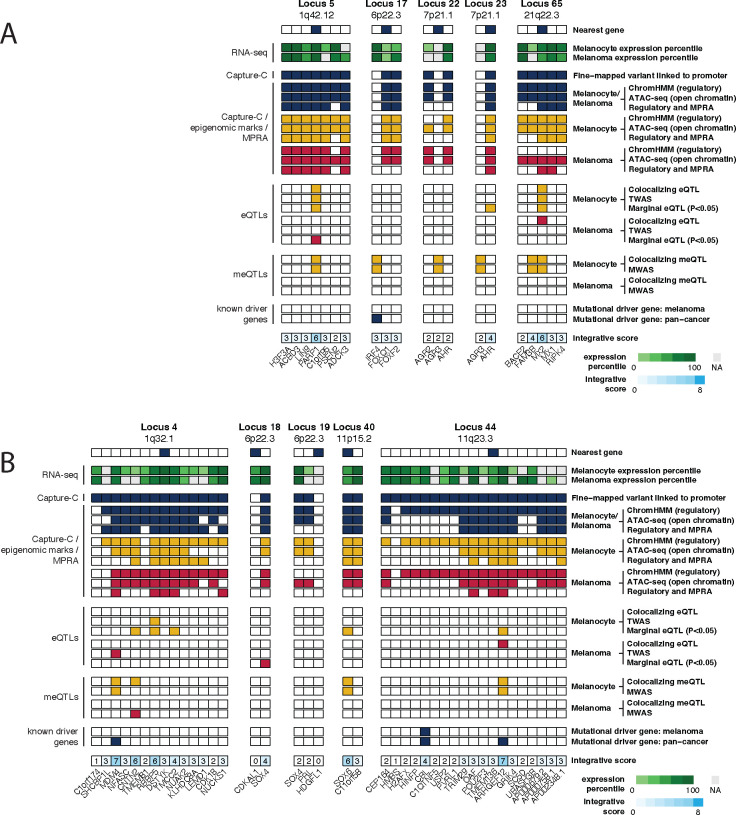
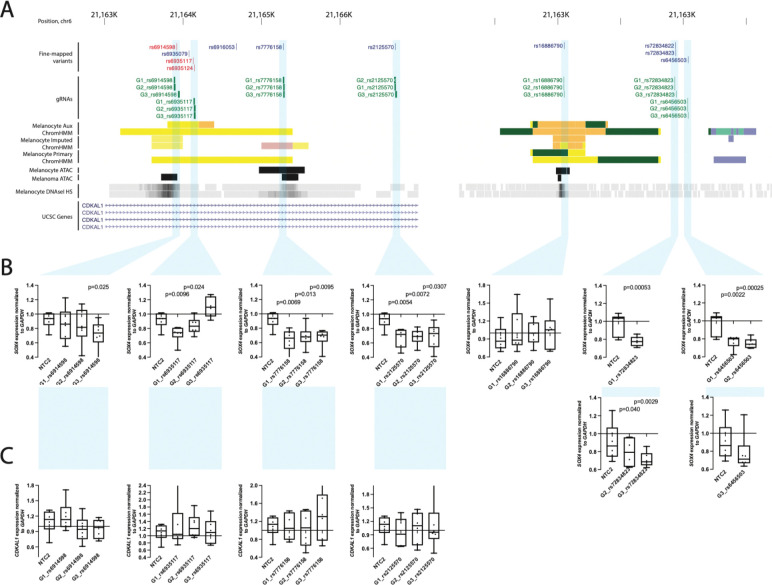
Genome-wide association studies (GWAS) of melanoma risk have identified 68 independent signals at 54 loci. For most loci, specific functional variants and their respective target genes remain to be established. Capture-HiC is an assay that links fine-mapped risk variants to candidate target genes by comprehensively mapping cell-type specific chromatin interactions. We performed a melanoma GWAS region-focused capture-HiC assay in human primary melanocytes to identify physical interactions between fine-mapped risk variants and potential causal melanoma susceptibility genes. Overall, chromatin interaction data alone nominated potential causal genes for 61 of the 68 melanoma risk signals, identifying many candidates beyond those reported by previous studies. We further integrated these data with cell-type specific epigenomic (chromatin state, accessibility), gene expression (eQTL/TWAS), DNA methylation (meQTL/MWAS), and massively parallel reporter assay (MPRA) data to prioritize potentially cis-regulatory variants and their respective candidate gene targets. From the set of fine-mapped variants across these loci, we identified 140 prioritized candidate causal variants linked to 195 candidate genes at 42 risk signals. In addition, we developed an integrative scoring system to facilitate candidate gene prioritization, integrating melanocyte and melanoma datasets. Notably, at several GWAS risk signals we observed long-range chromatin connections (500 kb to >1 Mb) with distant candidate target genes. We validated several such cis-regulatory interactions using CRISPR inhibition, providing evidence for known cancer driver genes MDM4 and CBL, as well as the SRY-box transcription factor SOX4, as likely melanoma risk genes.


Conflict of interest statement

DECLARATION OF INTERESTS The authors declare no competing interests.

Figures

Figure 1.
Figure 1.. Schematic of data integration of capture-HiC data with orthogonal data to prioritize candidate causal variants and genes.
(A) Schematic summary of this study utilizing an integrative analysis approach to identify candidate causal variants (CCVs) and target candidate genes at the 68 melanoma GWAS risk signals. We performed GWAS region-specific capture-HiC assay, baiting the entire region of association for the 68 melanoma GWAS risk signals to comprehensively map chromatin interactions. Subsequently we utilized this dataset to link fine-mapped risk variants to candidate target genes. We integrated fine-mapping with observed chromatin interactions, further overlaying cell-type specific epigenomic (chromatin state, accessibility) and high-throughput reporter assay screening (massively parallel reporter assays, MPRA) datasets to prioritize likely functional variants and respective candidate gene target(s) for cis-regulation. Finally, we validated candidate genes nominated at multiple loci via CRISPR inhibition system. (B) Summary of fine-mapped credible causal variants (CCVs) using Bayesian, LLR/LD, or both criteria at the 68 melanoma GWAS signals (a key to numbered loci is provided in Table S1). The black bar shows the union of fine-mapped variants identified by Bayesian and LLR/LD approaches.
Figure 2.
Figure 2.. Summary of fine-mapped candidate causal variants (CCVs) linked to potential target candidate causal genes (CCGs) at 68 melanoma GWAS risk signals.
(A) Stacked bar plot summary of fine-mapped CCVs and nominated target CCGs. The top bar plot (dark blue color) shows the number of CCVs linked by chromatin interaction or overlap with at least one gene promoter, while the light blue color shows the number of CCVs not linked to a promoter. The bottom plot shows the total number of nominated CCGs per locus. (B) Pie chart showing the proportion of all fine-mapped CCVs that are linked to target CCGs via distant promoter interactions, direct overlap with gene promoter regions, or both. (C) Bar plot summarizing the proportion of GWAS risk signals with at least one gene nominated through chromatin interactions over varying distances.
Figure 3.
Figure 3.
(A) Summary of fine-mapped variants overlap with chromatin interaction cis-regulatory regions in the ATAC-seq and ChromHMM datasets. (B) Stacked bar plot summary of fine-mapped variants (CCVs) and nominated target genes (CCGs) after integrating the chromatin interaction dataset with melanocyte- and melanoma-specific ATAC-seq, ChromHMM, and MPRA datasets for each of 68 melanoma risk signals. The top bar plot shows the total number of fine-mapped variants that are linked to at least one target gene using the chromatin interaction dataset, while blue color shows the number of interacting variants overlapping a potential regulatory region in any of the ATAC-seq or ChromHMM datasets and the variant is also FDR significant in MPRA dataset. The bottom plot shows the number of unique genes nominated as potential candidates using chromatin interaction data only, while the green color shows the number of candidate genes following integration with epigenomic (ATAC-seq and ChromHMM) and MPRA datasets.
Figure 4.
Figure 4.. Summary of overlapping CCGs between QTL datasets and capture-HiC chromatin interaction analyses.
eQTL/TWAS CCGs were nominated when colocalization of eQTL and GWAS data was observed, or alternatively when the gene was identified as FDR-significant via Transcriptome Wide Association Study (TWAS), using either primary melanocyte or melanoma tumor eQTL reference datasets. Likewise, meQTL/MWAS CCGs were nominated via meQTL colocalization or an FDR-significant Methylome-Wide Association Study finding, where the significant CpG probe was located within a gene promoter or gene body, and meQTL reference datasets from melanocytes and melanoma tumors were tested separately. High confidence CCGs were nominated via integration analyses of fine-mapping, chromatin interactions datasets with epigenomic (ATAC-seq and ChromHMM) and MPRA data derived from melanocytes and melanoma cells.
Figure 5.
Figure 5.. Integrative evidence for candidate causal genes at select melanoma risk signals.
(A) Loci with previously characterized candidate causal genes, and (B) select novel loci. For each locus, the figure indicates the nearest gene to the lead variant, summarizes candidate gene expression in primary melanocytes and melanoma tumors, indicates genes implicated by interaction of fine-mapped variants to the gene’s promoter, along with further refined evidence for these interacting variants integrated with melanocyte and melanoma epigenomic and MPRA data. Also summarized are melanocyte eQTL/TWAS evidence, meQTL/MWAS evidence, and whether the candidate gene has been implicated as a melanoma or pan-cancer driver gene. Finally, the figures show an overall integrative score for each candidate scored from 0–8 with 8 being the highest score.
Figure 6.
Figure 6.. Chromatin looping from two independent loci on chromosome 6 to the promoter of SOX4.
Figure shows data from melanocyte DNase I hypersensitivity sequencing (Roadmap, n=2 melanocyte cultures), melanocyte ChromHMM (Roadmap, n=2 melanocyte cultures), melanocyte ATAC-seq (n=5 cultures), and melanoma cell ATAC-seq relative to genes in the region. Fine-mapped variants for both loci and location of capture-HiC baits is shown along with chromatin looping. Fine-mapped variants from both loci located within the CDKAL1 gene and near HDGFL1, respectively, directly interact with the SOX4 promoter region.
Figure 7.
Figure 7.. CRISPR-inhibition validation of SOX4 as a target of regulatory regions harboring fine-mapped variants at two independent melanoma risk loci on chromosome 6.
(A) Guide RNAs were designed to target four regions collectively harboring five fine-mapped sequence variants in a risk locus located within an intron of the CDKAL1 gene (left), as well as three regions harboring four fine-mapped variants for an independent locus nearest the HDGFL1 gene (right); three guides were designed per region and tested along with two non-targeting guides (NTC1 and NTC2). (B) Each guide was individually tested for effects on SOX4 expression relative to NTC1 in immortalized melanocytes stably expressing dCas9-KRAB via a TaqMan quantitative RT-PCR assay. Expression values from six replicate experiments are shown as fold change relative to NTC1. Where SNP-targeting guides were tested in separate experiments, they are shown grouped with respective values for NTC2 from the same experiments. Whiskers show minimum and maximum values. P-values were calculated using a two-sample two-sided paired t-test comparing delta-Ct values from individual guides to those from NTC1.

References

    1. Brown K.M., Macgregor S., Montgomery G.W., Craig D.W., Zhao Z.Z., Iyadurai K., Henders A.K., Homer N., Campbell M.J., Stark M., et al. (2008). Common sequence variants on 20q11.22 confer melanoma susceptibility. Nature Genetics 40, 838–840. 10.1038/ng.163. - DOI - PMC - PubMed
    1. Bishop D.T., Demenais F., Iles M.M., Harland M., Taylor J.C., Corda E., Randerson-Moor J., Aitken J.F., Avril M.F., Azizi E., et al. (2009). Genome-wide association study identifies three loci associated with melanoma risk. Nature Genetics 41, 920–925. 10.1038/ng.411. - DOI - PMC - PubMed
    1. Amos C.I., Wang L.E., Lee J.E., Gershenwald J.E., Chen W.V., Fang S., Kosoy R., Zhang M., Qureshi A.A., Vattathil S., et al. (2011). Genome-wide association study identifies novel loci predisposing to cutaneous melanoma. Hum Mol Genet 20, 5012–5023. 10.1093/hmg/ddr415. - DOI - PMC - PubMed
    1. Macgregor S., Montgomery G.W., Liu J.Z., Zhao Z.Z., Henders A.K., Stark M., Schmid H., Holland E.A., Duffy D.L., Zhang M., et al. (2011). Genome-wide association study identifies a new melanoma susceptibility locus at 1q21.3. Nature Genetics 43, 1114–1118. 10.1038/ng.958. - DOI - PMC - PubMed
    1. Law M.H., Montgomery G.W., Brown K.M., Martin N.G., Mann G.J., Hayward N.K., and MacGregor S. (2012). Meta-analysis combining new and existing data sets confirms that the TERT-CLPTM1L locus influences melanoma risk. J Invest Dermatol 132, 485–487. 10.1038/jid.2011.322. - DOI - PMC - PubMed

Publication types