[Preprint]. 2025 Jan 3:2025.01.02.24318941.
doi: 10.1101/2025.01.02.24318941.

Transcriptome-wide outlier approach identifies individuals with minor spliceopathies

Affiliations

Transcriptome-wide outlier approach identifies individuals with minor spliceopathies

Maggie T Arriaga et al. medRxiv. .

Update in

  • Transcriptome-wide outlier approach identifies individuals with minor spliceopathies.
    Arriaga TM, Mendez R, Ungar RA, Bonner DE, Matalon DR, Lemire G, Goddard PC, Padhi EM, Miller AM, Nguyen JV, Ma J, Smith KS, Scott SA, Liao L, Ng Z, Marwaha S, Bademci G, Bivona SA, Tekin M; Undiagnosed Diseases Network; Genomics Research to Elucidate the Genetics of Rare Diseases consortium; Bernstein JA, Montgomery SB, O'Donnell-Luria A, Wheeler MT, Ganesh VS. Arriaga TM, et al. Am J Hum Genet. 2025 Oct 2;112(10):2458-2475. doi: 10.1016/j.ajhg.2025.08.018. Epub 2025 Sep 19. Am J Hum Genet. 2025. PMID: 40975062

Abstract

RNA-sequencing has improved the diagnostic yield of individuals with rare diseases. Current analyses predominantly focus on identifying outliers in single genes that can be attributed to cis-acting variants within the gene locus. This approach overlooks causal variants with trans-acting effects on splicing transcriptome-wide, such as variants impacting spliceosome function. We present a transcriptomics-first method to diagnose individuals with rare diseases by examining transcriptome-wide patterns of splicing outliers. Using splicing outlier detection methods (FRASER and FRASER2) we characterized splicing outliers from whole blood for 390 individuals from the Genomics Research to Elucidate the Genetics of Rare Diseases (GREGoR) and Undiagnosed Diseases Network (UDN) consortia. We examined all samples for excess intron retention outliers in minor intron containing genes (MIGs). Minor introns, which make up about 0.5% of all introns in the human genome, are removed by small nuclear RNAs (snRNAs) in the minor spliceosome. This approach identified five individuals with excess intron retention outliers in MIGs, all of which were found to harbor rare, biallelic variants in minor spliceosome snRNAs. Four individuals had rare, compound heterozygous variants in RNU4ATAC, which aided the reclassification of four variants. Additionally, one individual had rare, highly conserved, compound heterozygous variants in RNU6ATAC that may disrupt the formation of the catalytic spliceosome, suggesting a novel gene-disease candidate. These results demonstrate that examining RNA-sequencing data for transcriptome-wide signatures can increase the diagnostic yield of individuals with rare diseases, provide variant-to-function interpretation of spliceopathies, and uncover novel disease gene associations.


Conflict of interest statement

DECLARATION OF INTERESTS AODL was a paid consultant for Tome Biosciences, Ono Pharma USA, and Addition Therapeutics. SBM is an advisor to Character Bio, Myome, PhiTech and Tenaya Therapeutics.

Figures

Figure 1.
Figure 1.. Affected status and primary systems affected for individuals in our GREGoR and UDN cohort
Two pie charts depicting information on our rare disease cohort. The pie chart on the left of the page depicts the affected status composition of our 390-person rare disease cohort from the Undiagnosed Disease Network (UDN) and Genomics to Elucidate the Genetics of Rare Disease (GREGoR) consortia. Lines radiating from the affected (orange) section of the left pie chart indicate that the pie chart on the right contains information on the primary systems affected for all 217 individuals with rare disease in our cohort. The percent and number of individuals affected (n) per system in our cohort are labeled. “Cardiology” includes both cardiology and vascular systems, while “Immunology” includes immunology, infectious diseases, and allergies. “Musculoskeletal” also includes orthopedic complaints. “Other” indicates that no system was selected for the individual at the time of enrollment.
Figure 2.
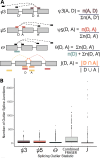
Figure 2.. Evaluation of the number of outlier junctions detected per person
(A) Depiction of FRASER and FRASER2 metrics. ψ5 and ψ3 use split reads, which span an exon-exon boundary, while θ and the Jaccard index (J) use both split and unsplit reads, the latter of which span only one exon boundary. ψ5 quantifies alternative acceptor usage from a single donor, while ψ3 quantifies alternative donor usage from a single acceptor. θ quantifies the splicing efficiency, which captures intron retention outliers by comparing the number of split reads to all reads, split and unsplit. J quantifies the proportion of all reads, split and unsplit that support the spicing of an intron of interest compared to all reads, split and unsplit, associated with both the donor and acceptor of the intron of interest. (B) Box plot displaying the number of outlier splice junctions detected per person for each metric. Junctions were labeled as outliers if their adjusted p-value was less than 0.05 and their absolute value of |Δψ|, a normalization metric, was greater than 0.3. The Y-axis is the number of outlier junctions found per person, while the X-axis represents the different types of metrics examined by FRASER (ψ3,ψ5,θ) and FRASER2 (J). Combined FRASER refers to the combined number of outlier junctions from FRASER’s three metrics- ψ5,ψ3, and θ. The bottom of the box represents the first quartile, while the middle line represents the median and the top of the box represents the third quartile. All dots represent outliers.
Figure 3.
Figure 3.. Enrichment analysis on genes detected to be splicing outliers via FRASER1 and FRASER2
A) Results of enrichment analysis on genes detected to be significant splicing outliers via FRASER. All categories not crossing the dotted vertical line were found to be significant before False Discovery Rate (FDR) correction. All categories shown as significant stayed significant after FDR correction except for the haploinsufficient gene set, whose p-value after correction was 0.06. (B) Results of enrichment analysis on genes detected to have significant Jaccard index outlier junctions (as detected by FRASER2). All categories whose lines do not cross the dotted vertical line were found to be significant before FDR correction, and all categories shown as significant in this figure remained significant after FDR correction.
Figure 4.
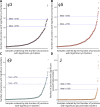
Figure 4.. Individuals with excess significant outlier junctions detected using FRASER and FRASER2 metrics
Plots showing the number of significant outlier junctions detected per individual for all three FRASER metrics (ψ3,ψ5, and θ) and the FRASER2 Jaccard index (J). Junctions were labeled as significant outliers if their adjusted p-value was less than 0.05 and their |Δψ|, a normalization metric, was greater than 0.3. For all four plots, each dot represents an individual and the position on the Y-axis of the dot represents the number of significant outlier junctions of the specified type for that individual. Individuals are ordered on the X-axis by the number of significant outlier junctions of the specified metric. The number of significant outliers shown per individual are, as labeled: (A) ψ3, (B) ψ5, (C) θ, and (D) J.
Figure 5.
Figure 5.. Outliers with excess intron retention events ((θ)) in minor intron containing genes (MIGs) identified in individuals with rare, biallelic variants in RNU4ATAC
(A) Plot showing the number of significant intron retention (θ) events in minor intron containing genes (MIGs). Each dot represents an individual and the Y-axis position represents the number of significant intron retention (θ) events in MIGs detected in that individual. The X-axis is ordered by the number of significant intron retention events (θ) in MIGs. Individuals with rare, biallelic variants in RNU4ATAC or RNU6ATAC are labeled as “RNU4atac-opathy” and “RNU6atac-opathy”, respectively. (B) Boxplots showing the number of MIGs with significant outliers of type (from top left clockwise) ψ3,ψ5, Jaccard index (J), and θ (intron retention). In each boxplot, the right box labeled “RNU4atac-opathies” represents the individuals with rare, biallelic variants in RNU4ATAC, while the left box represents the remaining samples. Where D1 is an outlier, it is marked as an orange circle. Note that the y-axis ends at around 15 for the ψ3 and ψ5 boxplots and around 200 for the θ and J boxplots. (C) Secondary structure of U4ATAC, which is encoded by RNU4ATAC. Areas of high importance to splicing are labeled in pink; limited importance to splicing, brown; and variable importance to splicing, gray. The rare variants in individuals A1, B1, C1, and C2 are labeled by the blue, red, and yellow arrows.
Figure 6.
Figure 6.. Outlier with excess intron retention events in minor intron containing genes (MIGs) found to harbor rare, conserved biallelic variants in RNU6ATAC
(A) Venn diagram of the genes shared between all four RNU4atac-opathy cases (A1-C2) and the case with rare, biallelic variants in RNU6ATAC (D1). All genes unique to the RNU4atac-opathy cases (A1-C2) are shown in yellow, while all genes unique to D1 (RNU6ATAC case) are shown in blue. All shared genes are shown in green. (B) Examination of conservation of RNU6ATAC (DNA). Conservation levels for each nucleotide were obtained using PhyloP to compare the nucleotides across 100 vertebrates. The brown line above the sequence indicates that all of the nucleotides in this region are highly conserved. The animals shown represent the following organisms: human, rhesus, mouse, dog, elephant, chicken, X. tropicalis, and zebrafish. The two RNU6ATAC variants seen in individual D1 are marked by arrows. (C) Secondary structure of the binding of U4ATAC and U6ATAC (RNAs) required for the formation of the catalytic splice site. The two variants in D1 are marked by the dashed and solid arrows. The relative importance of each nucleotide in RNU4ATAC to splicing is indicated in the colored legend.

References

    1. Health T. L. G. The landscape for rare diseases in 2024. Lancet Glob. Health 12, e341 (2024). - PubMed
    1. European Union. REGULATION (EC) No 141/2000 OF THE EUROPEAN PARLIAMENT AND OF THE COUNCIL of 16 December 1999 on orphan medicinal products. Off. J. Eur. Communities (2000).
    1. Nguengang Wakap S. et al. Estimating cumulative point prevalence of rare diseases: analysis of the Orphanet database. Eur. J. Hum. Genet. 28, 165–173 (2020). - PMC - PubMed
    1. eClinicalMedicine. Raising the voice for rare diseases: under the spotlight for equity. eClinicalMedicine 57, (2023). - PMC - PubMed
    1. Hartley T. et al. New Diagnostic Approaches for Undiagnosed Rare Genetic Diseases. Annu. Rev. Genomics Hum. Genet. 21, 351–372 (2020). - PubMed

Publication types

LinkOut - more resources