

Regional-specific trends of PM2.5 and O3 temperature sensitivity in the United States
- PMID: 39803003
- PMCID: PMC11717706
- DOI: 10.1038/s41612-024-00862-4
Regional-specific trends of PM2.5 and O3 temperature sensitivity in the United States
Abstract
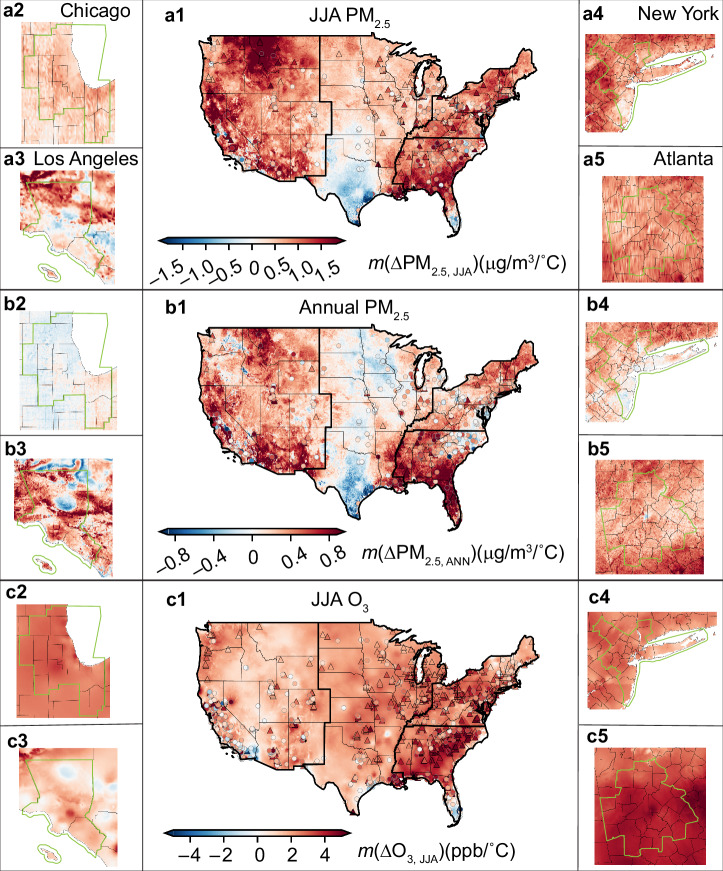
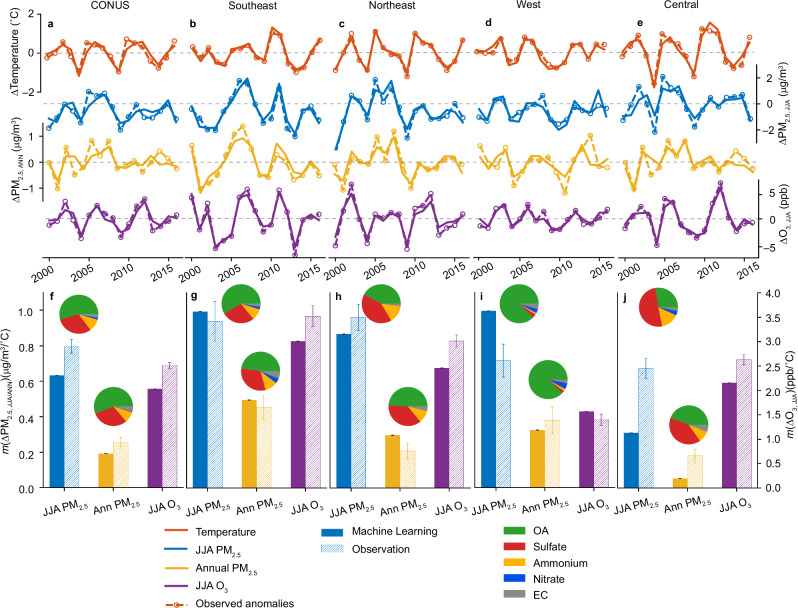
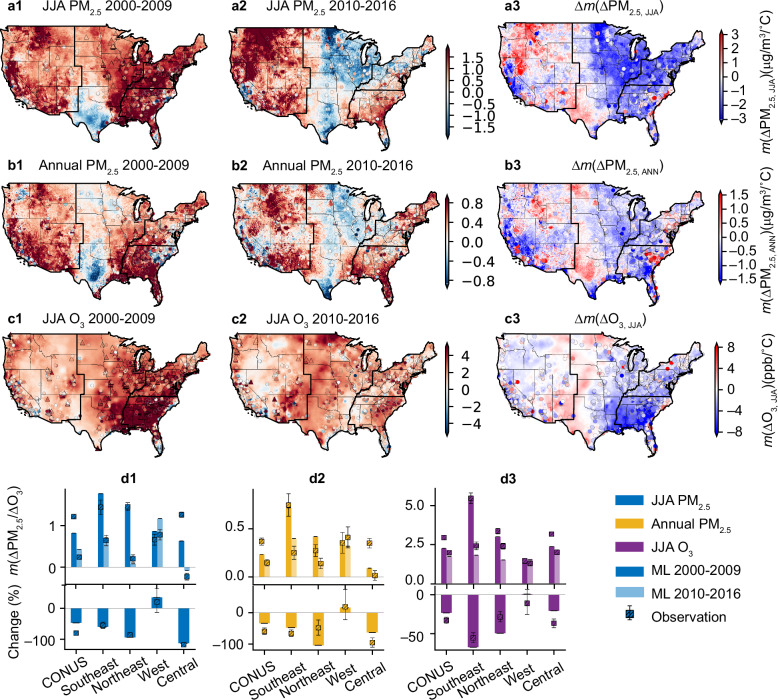
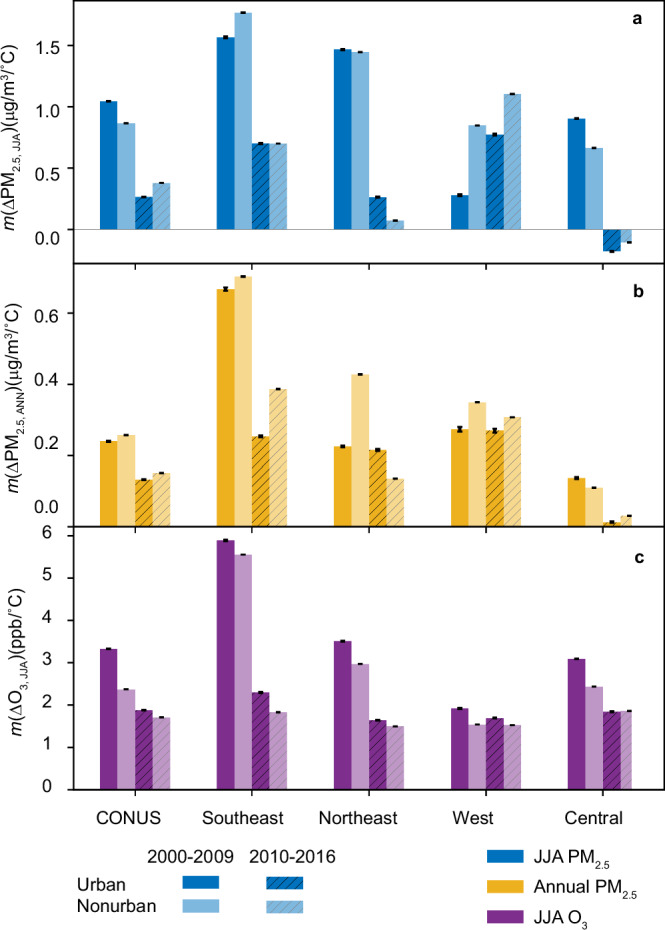
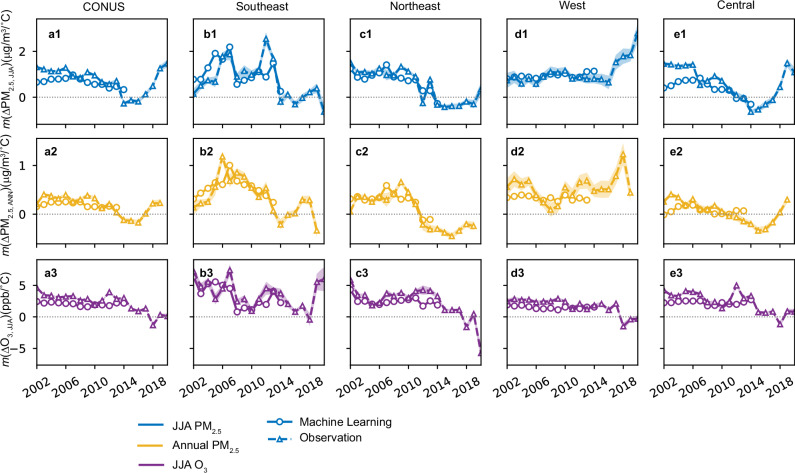
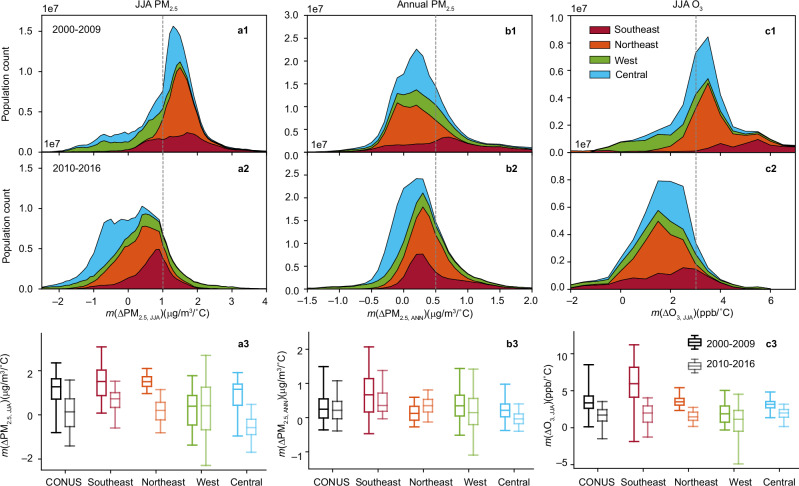
Climate change poses direct and indirect threats to public health, including exacerbating air pollution. However, the influence of rising temperature on air quality remains highly uncertain in the United States, particularly under rapid reduction in anthropogenic emissions. Here, we examined the sensitivity of surface-level fine particulate matter (PM2.5) and ozone (O3) to summer temperature anomalies in the contiguous US as well as their decadal changes using high-resolution datasets generated by machine learning. Our findings demonstrate that in the eastern US, stringent emission control strategies have significantly reduced the positive responses of PM2.5 and O3 to summer temperature, thereby lowering the population exposure associated with warming-induced air quality deterioration. In contrast, PM2.5 in the western US became more sensitive to temperature, highlighting the urgent need to manage and mitigate the impact of worsening wildfires. Our results have important implications for air quality management and risk assessments of future climate change.
Keywords: Climate sciences; Environmental sciences.
© The Author(s) 2025.
Conflict of interest statement
Competing interestsThe authors declare no competing interests.
Figures
Similar articles
-
Climate Penalty on Air Pollution Abated by Anthropogenic Emission Reductions in the United States.Res Sq [Preprint]. 2023 Aug 16:rs.3.rs-3245771. doi: 10.21203/rs.3.rs-3245771/v1. Res Sq. 2023. PMID: 37645994 Free PMC article. Preprint.
-
Air-quality-related health impacts from climate change and from adaptation of cooling demand for buildings in the eastern United States: An interdisciplinary modeling study.PLoS Med. 2018 Jul 3;15(7):e1002599. doi: 10.1371/journal.pmed.1002599. eCollection 2018 Jul. PLoS Med. 2018. PMID: 29969461 Free PMC article.
-
Air quality and climate connections.J Air Waste Manag Assoc. 2015 Jun;65(6):645-85. doi: 10.1080/10962247.2015.1040526. J Air Waste Manag Assoc. 2015. PMID: 25976481 Review.
-
The 2023 Latin America report of the Lancet Countdown on health and climate change: the imperative for health-centred climate-resilient development.Lancet Reg Health Am. 2024 Apr 23;33:100746. doi: 10.1016/j.lana.2024.100746. eCollection 2024 May. Lancet Reg Health Am. 2024. PMID: 38800647 Free PMC article. Review.
-
[Response of PM2.5 and O3 to Emission Reductions in Nanjing Based on Random Forest Algorithm].Huan Jing Ke Xue. 2023 Aug 8;44(8):4250-4261. doi: 10.13227/j.hjkx.202209163. Huan Jing Ke Xue. 2023. PMID: 37694620 Chinese.
Cited by
-
Impact of Climate Change and Air Pollution on Bronchiolitis: A Narrative Review Bridging Environmental and Clinical Insights.Pathogens. 2025 Jul 14;14(7):690. doi: 10.3390/pathogens14070690. Pathogens. 2025. PMID: 40732736 Free PMC article. Review.
References
-
- Costello, A. et al. Managing the health effects of climate change: Lancet and University College London Institute for Global Health Commission. Lancet373, 1693–1733 (2009). - PubMed
-
- Mora, C. et al. Global risk of deadly heat. Nat. Clim. Change7, 501–506 (2017).
Grants and funding
LinkOut - more resources
Full Text Sources