. 2025 Jan 6;8(1):5.
doi: 10.5334/joc.409. eCollection 2025.

How to Run Linear Mixed Effects Analysis for Pairwise Comparisons? A Tutorial and a Proposal for the Calculation of Standardized Effect Sizes

Affiliations

How to Run Linear Mixed Effects Analysis for Pairwise Comparisons? A Tutorial and a Proposal for the Calculation of Standardized Effect Sizes

Marc Brysbaert et al. J Cogn. .

Abstract

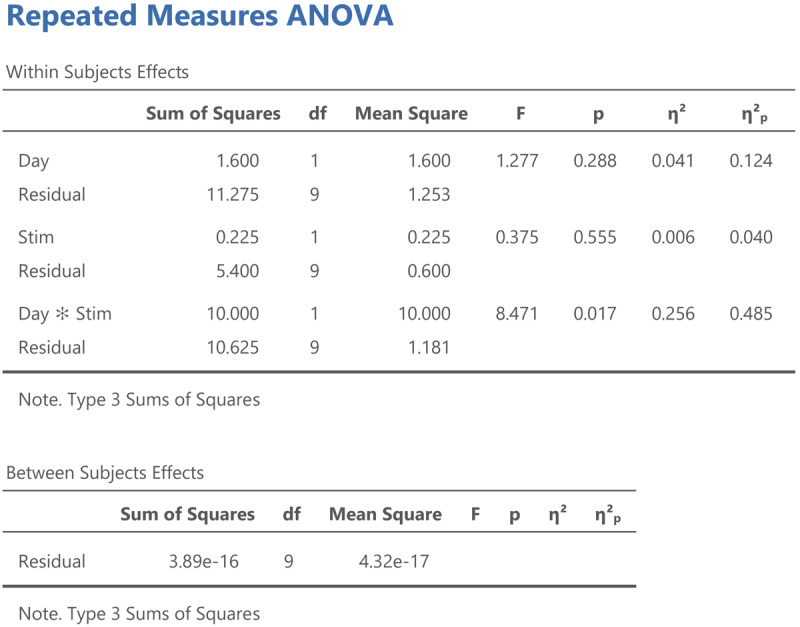
This tutorial provides guidelines for conducting linear mixed effects (LME) analyses for simple designs, aimed at researchers familiar with t-tests, analysis of variance (ANOVA) and linear regression. First, we compare LME analyses with traditional methods when participants are the only source of random variation. We show that LME analysis is more interesting as soon as you have more than one observation per participant per condition. The second section discusses studies where both participants and stimuli are used as sources of random variation, ensuring robust generalization beyond the specific stimuli tested. In our search for standardized effect sizes, we saw that partial eta squared is even less informative for LME than for ANOVA. We present eta squared within as an alternative, to be used in combination with the traditional measure eta squared (also in ANOVA). To facilitate implementation, we analyze toy datasets with R and jamovi. This tutorial gives researchers a good foundation for LME analyses of simple 2 × 2 designs and paves the way for tackling more complicated designs.

Keywords: Face perception; Mathematical modelling; Statistical analysis.


Conflict of interest statement

The authors have no competing interests to declare.

Figures

Violin plot of the data listed in Table 2
Figure 1
Violin plot of the data listed in Table 2.
jamovi output for the t-test of working memory capacity between two age groups
Figure 2
jamovi output for the t-test of working memory capacity between two age groups.
Output jamovi ANOVA between-groups analysis working memory capacity
Figure 3
Output jamovi ANOVA between-groups analysis working memory capacity.
Output jamovi linear regression analysis of between-groups example working memory
Figure 4
Output jamovi linear regression analysis of between-groups example working memory.
Output jamovi LME analysis of between-groups example working memory
Figure 5
Output jamovi LME analysis of between-groups example working memory.
Violin plot of the data shown in Table 6. Lines represent related observations
Figure 6
Violin plot of the data shown in Table 6. Lines represent related observations.
Output jamovi t-test longitudinal study working memory
Figure 7
Output jamovi t-test longitudinal study working memory.
Output jamovi ANOVA longitudinal study working memory
Figure 8
Output jamovi ANOVA longitudinal study working memory.
Output jamovi LME analysis longitudinal study working memory
Figure 9
Output jamovi LME analysis longitudinal study working memory.
Interaction between Day and Stimulus type. The figure includes the standard errors around the means (based on jamovi)
Figure 10
Interaction between Day and Stimulus type. The figure includes the standard errors around the means (based on jamovi).
Output jamovi ANOVA 2x2 repeated-measures design
Figure 11
Output jamovi ANOVA 2 × 2 repeated-measures design.
Jamovi output for an ANOVA on the participant centered values from Table 12
Figure 12
Jamovi output for an ANOVA on the participant centered values from Table 12.
Output jamovi LME analysis 2 × 2 repeated-measures design
Figure 13
Output jamovi LME analysis 2 × 2 repeated-measures design.
Average ratings of the young and old group per stimulus
Figure 14
Average ratings of the young and old group per stimulus.
Output jamovi LME analysis face rating study
Figure 15
Output jamovi LME analysis face rating study.
Figure of reading times as a function of Language and Background knowledge
Figure 16
Figure of reading times as a function of Language and Background knowledge.

References

    1. Austin, P. C., White, I. R., Lee, D. S., & van Buuren, S. (2021). Missing data in clinical research: a tutorial on multiple imputation. Canadian Journal of Cardiology, 37(9), 1322–1331. 10.1016/j.cjca.2020.11.010 - DOI - PMC - PubMed
    1. Baayen, R. H., Davidson, D. J., & Bates, D. M. (2008). Mixed-effects modeling with crossed random effects for subjects and items. Journal of Memory and Language, 59(4), 390–412. 10.1016/j.jml.2007.12.005 - DOI
    1. Baguley, T. (2009). Standardized or simple effect size: What should be reported? British Journal of Psychology, 100(3), 603–617. 10.1348/000712608X377117 - DOI - PubMed
    1. Bakeman, R. (2005). Recommended effect size statistics for repeated measures designs. Behavior Research Methods, 37, 379–384. 10.3758/BF03192707 - DOI - PubMed
    1. Bartos, F., Maier, M., Wagenmakers, E. J., Nippold, F., Doucouliagos, H., Ioannidis, J. P. A., Otte, W. M., Sladekova, M., Deressa, T. K., Bruns, S. B., Fanelli, D., & Stanley, T. D. (2024). Footprint of publication selection bias on meta-analyses in medicine, environmental sciences, psychology, and economics. Research Synthesis Methods. 10.1002/jrsm.1703 - DOI - PubMed

LinkOut - more resources