[Preprint]. 2024 Dec 30:2024.12.30.630772.
doi: 10.1101/2024.12.30.630772.

Molecular basis for the assembly of the dynein transport machinery on microtubules

Affiliations

Molecular basis for the assembly of the dynein transport machinery on microtubules

Qinhui Rao et al. bioRxiv. .

Abstract

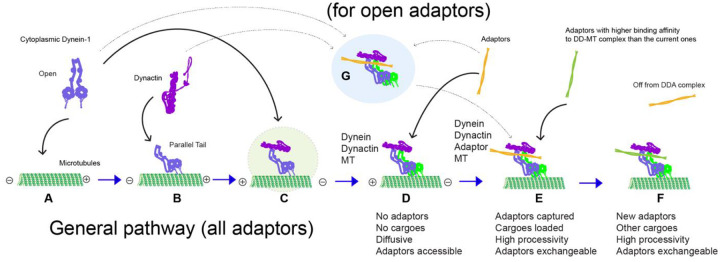
Cytoplasmic dynein-1, a microtubule-based motor protein, requires dynactin and an adaptor to form the processive dynein-dynactin-adaptor (DDA) complex. The role of microtubules in DDA assembly has been elusive. Here, we reveal detailed structural insights into microtubule-mediated DDA assembly using cryo-electron microscopy. We find that an adaptor-independent dynein-dynactin complex (DD) predominantly forms on microtubules in an intrinsic 2:1 stoichiometry, induced by spontaneous parallelization of dynein upon microtubule binding. Adaptors can squeeze in and exchange within the assembled microtubule-bound DD complex, which is enabled by relative rotations between dynein and dynactin, and further facilitated by dynein light intermediate chains that assist in an adaptor 'search' mechanism. Our findings elucidate the dynamic adaptability of the dynein transport machinery, and reveal a new mode for assembly of the motile complex.


Conflict of interest statement

Competing interests: Authors declare that they have no competing interests.

Figures

Extended Data Figure 1
Extended Data Figure 1. Microtubule pelleting assay reveal the formation of the DD-MT complex.
(A) Diagram of the microtubule pelleting assay procedure. (B) SDS-PAGE gel of dynein, dynactin, and dynein-dynactin complex bound to MTs in the presence of AMPPNP. (C) SDS-PAGE gel of dynein-dynactin complex bound to MTs under the salt concentration ranging from 50 mM to 1M in the presence of AMPPNP. (D) SDS-PAGE gel of dynein and dynein-dynactin complex bound to MTs in different nucleotide binding states. (E) Statistical analysis of the amount of dynein bound to MTs relative to dynein alone bound to MTs in the presence of ADP·Vi. Data are presented as mean ± s.d., analyzed by unpaired t-test with Welch’s correction. (F) SDS-PAGE gel showing dynein and dynein-dynactin complex from different species (pig, bovine, human) bound to MTs in the presence of AMPPNP. (G) Statistical analysis of the amount of dynein bound to MTs relative to dynein alone bound to MTs. Data are presented as mean ± s.d., analyzed by unpaired t-test with Welch’s correction. (p, pig; b, bovine; h, human). All SDS-PAGE gels are stained with simple blue. B, C, D, F, Gels are representative of n=3 independent experiments.
Extended Data Figure 2
Extended Data Figure 2. Data processing flow chart of DD-MT.
(A) Representative image of dynein-dynactin bound to MTs and workflow of cryo-EM image processing. (B) FSC curves of dynein tail and dynactin region, and dynein motors region reconstruction. Dynein-dynactin with adaptors (BicdR1, Trak2) datasets were processed similarly.
Extended Data Figure 3
Extended Data Figure 3. Dynein tail and dynactin interaction is facilitated by charge-charge interactions.
(A-B) Superimposition of DD and DDR complex. The DLIChelix is invisible in DD complex and is highlighted in DDR complex. (C) Surface electrostatics analysis of the dynein tail bound to dynactin, highlighting the positively charged adaptor-binding groove. (D-E) Two different views of electrostatic surface of the actin filament of dynactin. Circles indicate the interfaces corresponding to interactions with HB1/2 of the dynein tail in (G). (F-G) Two different views of electrostatic surface of the dynein tail. Circles indicate the interfaces corresponding to interactions with the dynactin actin filament in (E).
Extended Data Figure 4.
Extended Data Figure 4.. Interaction interfaces between dynein tail and dynactin actin filament part.
(A) Molecular model of the dynein tail interacting with dynactin. (B) Opposite view shows the interactions between dynein tail HB1/HB2 and ARP1/Actin. For simplicity, NDD domain of dynein tail has been eliminated. (C) Detailed interfaces of each heavy chain interacting with dynactin, interface 1 and 2, along with cartoon models showing the interfaces. (D) Structural alignment of four dynein tails bound to the actin filament, arrows indicate the movement of heavy chains A1 and B2 relative to two middles aligned heavy chains A2/B1.
Extended Data Figure 5
Extended Data Figure 5. Data processing flow chart of D-MT.
(A) Representative image of dynein bound to MTs and workflow of cryo-EM image processing. (B) FSC curves of motor domain and two-headed dynein reconstruction.
Extended Data Figure 6
Extended Data Figure 6. Cryo-EM structure of D-MT with two aligned motors.
(A) Two different views of the density map of the D-MT complex are shown (44, 792 particles). The side view shows the dynein tail with a dynamic region, the aligned AAA+ ring motors, the stalk, and the microtubule-binding domain (MTBD) of dynein. The dynamic region of the tail is highlighted in light purple. (B) A molecular model of dynein-B, extracted from the DDR-MT complex (PDB: 7Z8F), is fitted into the cryo-EM structure of the D-MT complex (A) using rigid-body fitting. The NDD and HB1–4 domains of the dynein heavy chain contribute to the dynamic region. (C) The MT is displayed as a density map, while dynein is represented as a molecular model. A top view shows the parallel tails and the direction of conformational signal transmission, as indicated by arrows, upon interaction between the MTBD and MT.
Extended Data Figure 7
Extended Data Figure 7. Surface electrostatics analysis of adaptors with domains corresponding to groove binding.
The figure shows the surface electrostatics of various adaptors, categorized by their domain types. CC1 box containing adaptors: BICDR1, BICD2, SPDL1, TRAK1/2, HAP1. HOOK domain containing adaptors: HOOK3, CCDC88B. EF hand domain containing adaptors: CRACR2A, RFIP3. RH domain containing adaptors: JIP3/4, RILP
Extended Data Figure 8
Extended Data Figure 8. Negative-staining EM analysis of dynein, dynactin, dynein-dynactin complex, and dynein-dynactin-adaptor complexes.
Representative 2D images of each sample and their corresponding populations are shown. The percentages indicate the proportion of dynein, dynactin, and dynein-dynactin-adaptor complexes observed in each condition. Scale bar, 20 nm.
Extended Data Figure 9
Extended Data Figure 9. Schematics of adaptors and their AlphaFold2 predicted structures.
(A) Domain structure of adaptors, showing the locations of the spindly motif, pointed end binding motif, HBS1, CC1 box, RH domain, HOOK domain, and EF hand domain. (B) CC1 box containing adaptors: BICDR1 (assumed open), BICD2 (C-terminal folded back), SPDL1 (C-terminal folded back), TRAK1/2, and HAP1. (C) RH domain containing adaptors: JIP3/4 and RILP. (D) HOOK domain containing adaptors: HOOK3 (assumed open) and CCDC88B. (E) EF hand domain containing adaptors: CRACR2A and RFIP3. Enlarged views of the autoinhibited structures of corresponding adaptors are enclosed in dashed boxes.
Extended Data Figure 10
Extended Data Figure 10. Binding affinity measurement of DD complex to MTs in different nucleotide binding states.
SDS-PAGE gels of dynein-dynactin complex bound to MTs in various nucleotide binding states, (A) Apo, (B) ADP, (C) AMPPNP, (D) ATP, (E) ADP·Vi, stained with simple blue. All dynein samples used in this assay are in a nucleotide-free condition (Apo). Gels are representative of n=3 independent experiments.
Extended Data Figure 11
Extended Data Figure 11. DDR complex enriched on MTs.
Two representative negative-staining EM images (n=50) of the DDR-MT complex without any purification process. DDR complexes on MTs are manually identified and highlighted with yellow circles. Dynein (blue circles), dynactin (magenta circles), and DDR complexes off MTs were picked using cryoSPARC and subsequently subjected to 2D averaging analysis for identification. Scale bar: 100 nm.
Extended Data Figure 12
Extended Data Figure 12. BicdR1 competes with Trak2 in pre-assembled DDK-MT complex.
Schematic representation of the adaptor competition assay showing BicdR1 competing with the pre-formed DDK-MT and Trak2 competing with the pre-formed DDR complex. SDS-PAGE gels stained with simple blue show the results of these competition assays. Competition assay with full-length Trak2 (Trak2(FL) (A), and truncated Trak2 (Trak2(Δ IH)) (B). S, supernatant; P, pellet. The Trak2 competed off from the DDK-MT complex is marked with green stars, while the newly bound BicdR1 in the DDKR-MT complex is marked with yellow stars. Gels are representative of n=3 independent experiments.
Extended Data Figure 13
Extended Data Figure 13. 3D classification analysis of DDR-MT and DDKR-MT complexes.
(A) 3D classification of DDR complexes showing two classes: DDR2 and DDR1, each representing 25% of the total particles. (B) 3D classification of DDKR complexes showing multiple subclasses of DDR2 and DDR1, with percentages indicating the proportion of each subclass. The averaged structure of DD-Trak2/BicdR1 is also shown, representing 4.3% of the total particles.
Fig. 1.
Fig. 1.. Cryo-EM structure of DD-MT complex.
(A) Schematic representation of the dynein transport machinery, illustrating dynein, dynactin, and adaptor interactions with cargo (top), and detailed domains of a classical adaptor interacting with dynein and dynactin components, including the spindly motif, pointed end binding motif, HBS1, and DLIC binding motif (bottom). (B) Representative micrographs (n=50 for each condition) of dynein, dynein-dynactin, and dynein-dynactin-BicdR1 complex bound to MTs in the presence of AMPPNP, with corresponding schematic diagrams depicting the assembly and interaction patterns of these complexes. (C) Overall architecture of the DD-MT complex (62,404 particles). (D) Density map of the dynein tail interacting with dynactin, with an empty groove indicated. (E) Molecular model of the dynein(tail)-dynactin complex, showing dynein (Dynein-A and Dynein-B) and dynactin.
Fig. 2.
Fig. 2.. Adaptor-binding groove within the DD-MT complex is dynamically open to accommodate all adaptors.
(A) A series of dynein-dynactin complex structures showing the dynamic adaptor-binding groove, ranging from tight (top) to loose (bottom). The distances surrounding two HBS1 sites, HBS1-A and HBS1-B, which mediate the interaction between the dynein heavy chain and the HBS1 of adaptors to regulate adaptor entry, were measured. (B) Dynamics analysis revealing a stable adaptor-binding groove within the DDR-MT complex. (C) Statistical analysis of the HBS1-A and HBS1-B distances in DDR-MT complex, and DD-MT complex in tight and loose states. (D-E) Microtubule pelleting assay measuring the binding of dynein-dynactin complex to various adaptors in the pre-MT and the post-MT conditions. Schematic representations of the pre-MT and post-MT processes (top), and SDS-PAGE gels stained with simple blue (bottom). Gels are representative of n=3 independent experiments.
Fig. 3.
Fig. 3.. Dynein-dynactin preferentially bind to MTs over adaptor proteins.
(A) Statistical analysis of interactions between dynein-dynactin and various adaptor proteins (BicdR1, HOOK3, BICD2, Trak2, RILP, SPDL1, JIP1, JIP3, and HAP1) using negative staining. (B) Ratio of DDR complex to total dynein in different nucleotide-binding states (Apo, AMPPNP, ADP·Vi, ADP, ATP) using negative staining. (C) Binding affinity of dynein-dynactin to BicdR1, with a dissociation constant (Kd) of 5.107 μM measured by using negative staining. (D) Measurements of the binding affinity of the dynein-dynactin complex to MTs across various nucleotide-binding states using MT pelleting assay, with the dissociation constants (Kd) listed for each state. A-D, Data are mean ± s.d. from n = 3 independent experiments. (E) Statistical analysis of DDR complex formation on and off microtubules, presented as particle numbers per image (n=50 images), analyzed by Mann-Whitney test. (F) Average expression levels of tubulin β (n=66) and adaptor proteins (BICDR1, n=5; BICD2, n=48; SPDL1, n=13; TRAK1, n=16; TRAK2, n=25; JIP3, n=21; JIP4, n=55; CCDC88B, n=38; RILP, n=26; HOOK3, n=57; CRACR2A, n=26; RFIP3, n=15) in human tissues and cells, data derived from ProteomicsDB, shown in Log10 parts per million (ppm) and presented as mean ± s.d..
Figure 4.
Figure 4.. DLIC-binding motif of adaptor is essential for adaptor recruitment.
(A-C) Schematic representations of BicdR1, HOOK3, and Trak2 adaptors showing their key domains and deletion constructs. Microtubule pelleting assays compare the binding of full-length (F.L.) and deletion constructs (ΔCC1, ΔHOOK, ΔIH, ΔIH+CC1) to the dynein-dynactin complex in pre-MT and post-MT conditions. SDS-PAGE gels stained with simple blue display binding interactions, quantified in bar graphs with statistical significance indicated (right panel). The Y-axis represents the relative amount of adaptor protein compared to each deletion construct: ΔCC1 for BicdR1, ΔHOOK for HOOK3, and ΔIH+CC1 for Trak2. Gels are representative of n=3 independent experiments, data are presented as mean ± s.d., and analyzed by unpaired t-test with Welch’s correction. (D) A proposed model illustrating the stages of adaptor recruitment by the dynein-dynactin complex: searching, capturing, and reorganizing, emphasizing the role of the DLIC-binding motif.
Fig. 5.
Fig. 5.. Adaptors compete for binding to the DD-MT complex.
(A) Density map of the dynein (tail)-dynactin-Trak2 complex (DDK-MT, 52, 920 particles), showing 100% occupancy by Trak2 (steel blue). (B) Density maps of the dynein (tail)-dynactin-BicdR1 complex (DDR-MT, 42, 951 particles), showing a distribution of 75% DDR2 and 25% DDR1. BicdR1-A and BicdR1-B are colored by yellow and magenta, respectively. DDR2 and DDR1 indicate two and one dimer of BicdR1 within DDR complex, respectively. (C) Density maps illustrating the competition results that excess BicdR1 incubating with the pre-assembled DDK-MT complex. The resulting binding distribution is 51.1% DDR2 (33, 721 particles), 44.6% DDR1 (29, 431 Particles), and 4.3% averaged binding of DDK1 and DDR1 (2, 837 Particles). The pie chart summarizes the proportions of these complexes. (D) Schematic representation of adaptor competition, showing that BicdR1 can compete Trak2 for binding to the dynein-dynactin complex.
Fig. 6.
Fig. 6.. Model illustrating dynein transport machinery assembly and adaptor binding.
General pathway for all adaptors (A-F, this study, black and blue arrows): (A) MT is available to bind open dynein transitioning from a phi-particle state. (B) Dynein adopts a parallel tail conformation upon binding to MTs. (C) Dynactin is recruited, forming a pseudo-intermediate DD-MT complex. (D) Fully assembled DD-MT complex with a molar ratio of 2:1, capable of recruiting adaptors for cargo transport. (E) Adaptors with higher binding affinity compete for binding to DD-MT, replacing current adaptors. (F) DDA complex with new adaptor assembled on MT for new cargo transport. Pathway for open adaptors (G to E, previous studies, dashed arrows): (G) DDA complex forms off MTs and becomes fully activated after MT binding. Blue arrows indicate DDA-MT complex formation in the general pathway.

References

    1. Reck-Peterson S. L., Redwine W. B., Vale R. D. & Carter A. P. The cytoplasmic dynein transport machinery and its many cargoes. Nat Rev Mol Cell Biol 19, 382–398, doi:10.1038/s41580-018-0004-3 (2018). - DOI - PMC - PubMed
    1. Canty J. T. & Yildiz A. Activation and Regulation of Cytoplasmic Dynein. Trends in Biochemical Sciences 45, 440–453, doi:10.1016/j.tibs.2020.02.002 (2020). - DOI - PMC - PubMed
    1. Raaijmakers J. A. & Medema R. H. Function and regulation of dynein in mitotic chromosome segregation. Chromosoma 123, 407–422, doi:10.1007/s00412-014-0468-7 (2014). - DOI - PubMed
    1. Zhang K. et al. Cryo-EM Reveals How Human Cytoplasmic Dynein Is Auto-inhibited and Activated. Cell 169, 1303–1314 e1318, doi:10.1016/j.cell.2017.05.025 (2017). - DOI - PMC - PubMed
    1. McKenney R. J., Huynh W., Tanenbaum M. E., Bhabha G. & Vale R. D. Activation of cytoplasmic dynein motility by dynactin-cargo adapter complexes. Science 345, 337–341, doi:10.1126/science.1254198 (2014). - DOI - PMC - PubMed

Publication types

LinkOut - more resources