[Preprint]. 2025 Jan 2:2025.01.02.631082.
doi: 10.1101/2025.01.02.631082.

Tissue-Specific Ablation of Liver Fatty Acid-Binding Protein Induces a Metabolically Healthy Obese Phenotype in Female Mice

Affiliations

Tissue-Specific Ablation of Liver Fatty Acid-Binding Protein Induces a Metabolically Healthy Obese Phenotype in Female Mice

Hiba Radhwan Tawfeeq et al. bioRxiv. .

Update in

Abstract

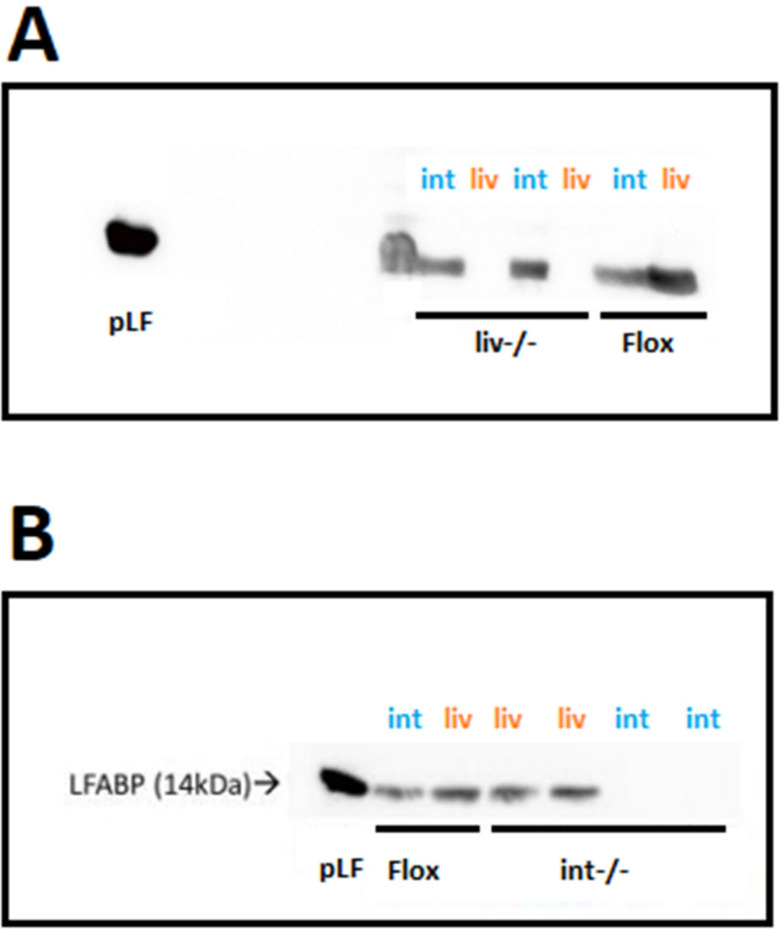
Background/objectives: Obesity is associated with numerous metabolic complications including insulin resistance, dyslipidemia, and a reduced capacity for physical activity. Whole-body ablation of liver fatty acid-binding protein (LFABP) in mice was shown to alleviate several of these metabolic complications; high fat (HF) fed LFABP knockout (LFABP-/-) mice developed higher fat mass than their wild-type (WT) counterparts but displayed a metabolically healthy obese (MHO) phenotype with normoglycemia, normoinsulinemia, and reduced hepatic steatosis compared with WT. LFABP is expressed in both liver and intestine, thus in the present study, LFABP conditional knockout (cKO) mice were generated to determine the contributions of LFABP specifically within the liver or the intestine to the whole body phenotype of the global knockout.

Methods: Female liver-specific LFABP knockout (LFABPliv-/-), intestine-specific LFABP knockout (LFABPint-/-), and floxed LFABP (LFABPfl/fl) control mice were fed a 45% Kcal fat semipurified HF diet for 12 weeks.

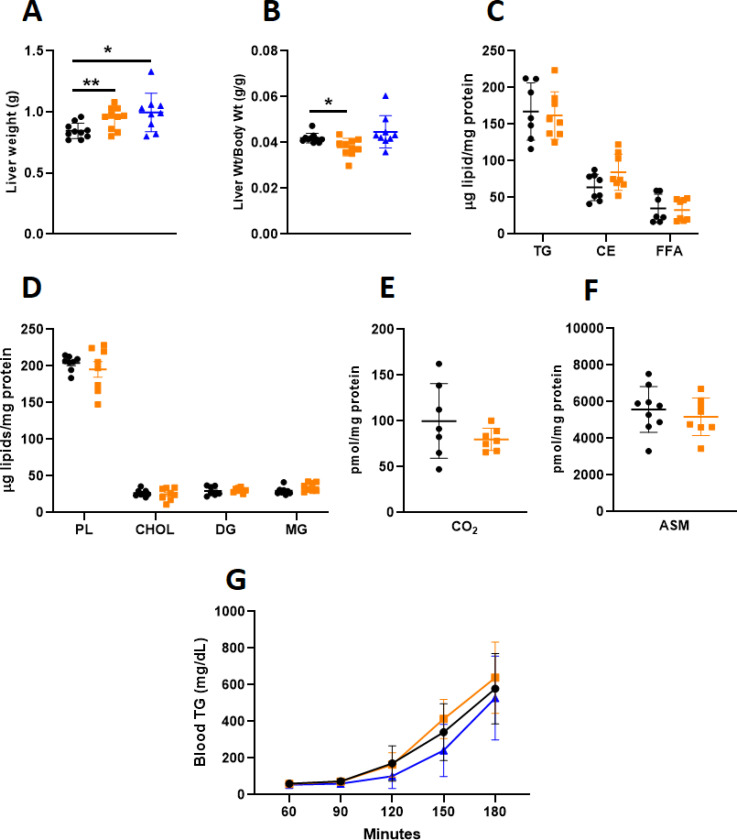
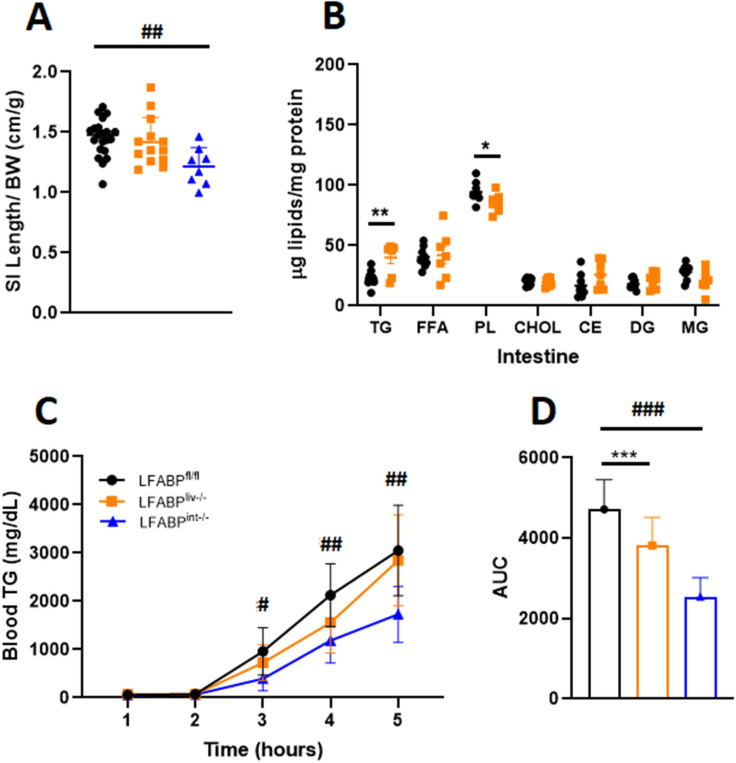
Results: While not as dramatic as found for whole-body LFABP-/- mice, both LFABPliv-/- and LFABPint-/- mice had significantly higher body weights and fat mass compared with LFABPfl/fl control mice. As with the global LFABP nulls, both LFABPliv-/- and LFABPint-/- mice remained normoglycemic and normoinsulinemic. Despite their greater fat mass, the LFABPliv-/- mice did not develop hepatic steatosis. Additionally, LFABPliv-/- and LFABPint-/- mice had higher endurance exercise capacity when compared with LFABPfl/fl control mice.

Conclusions: The results suggest, therefore, that either liver-specific or intestine-specific ablation of LFABP in female mice is sufficient to induce, at least in part, the MHO phenotype observed following whole-body ablation of LFABP.

Keywords: Liver fatty acid-binding protein; high-fat diet; liver; metabolically healthy obese; mouse; small intestine.


Conflict of interest statement

Conflicts of Interest: Authors declare no conflicts of interest.

Figures

Figure 1.
Figure 1.
Confirmation of the expression of LFABP in the liver and intestine of LFABPfl/fl, LFABPliv−/−, and LFABPint−/− mice. A, Western blot analysis confirms the ablation of liver-LFABP in LFABPliv−/− (liv−/−) mice; B, Western blot analysis confirms the ablation of intestine-LFABP in LFABPint−/− (int−/−) mice. int, intestine; LFABP, liver fatty acid-binding protein; LFABPfl/fl, floxed liver fatty acid-binding protein; LFABPint−/−, intestine-specific liver fatty acid-binding protein knockout; LFABPliv−/−, liver-specific liver fatty acid-binding protein knockout; liv, liver; pLF, purified liver fatty acid-binding protein.
Figure 2.
Figure 2.
Body weight, body weight gain, and fat mass % for LFABPfl/fl (), LFABPliv−/− () and LFABPint−/− () mice after 12 weeks of 45% Kcal HF feeding. A, Body weights (n = 8–10); B, Body weight gain (n = 8–10); C, Fat mass percentage (n = 8–9). Data are given as mean ± SD, analyzed using Student’s t-test. *, P < 0.05 and **, P < 0.01 for LFABPliv−/− versus LFABPfl/fl; #, P < 0.05, ##, P < 0.01 and ###, P < 0.001 for LFABPint−/− versus LFABPfl/fl in figure A. *, P < 0.05 and **, P < 0.01 for LFABP cKO mice versus LFABPfl/fl in figures B and C. LFABP, liver fatty acid-binding protein; LFABPfl/fl, floxed liver fatty acid-binding protein; LFABPint−/−, intestine-specific liver fatty acid-binding protein knockout; LFABPliv−/−, liver-specific liver fatty acid-binding protein knockout.
Figure 3.
Figure 3.
Food intake, intestinal transit times, RER and EE in LFABPfl/fl (), LFABPliv−/− () and LFABPint−/− () mice after 12 weeks of 45% Kcal HF feeding. A, 24-hour energy intake, feces excreted and energy absorbed (n = 4–10); B, intestinal transit time (n = 7–12); C, 24-hour RER (n = 7–10); B, EE (n = 5–7). Data are given as mean ± SD, analyzed using Student’s t-test. EE, Energy expenditure; LFABPfl/fl, floxed liver fatty acid-binding protein; LFABPint−/−, intestine-specific liver fatty acid-binding protein knockout; LFABPliv−/−, liver-specific liver fatty acid-binding protein knockout; RER, Respiratory exchange ratio.
Figure 4.
Figure 4.
Analyses of spontaneous activity and exercise endurance capacity for LFABPfl/fl (), LFABPliv−/− () and LFABPint−/− () mice after 12 weeks of 45% Kcal HF feeding. A, 24-hour spontaneous activity (n = 8–10); B, exercise endurance running time and distance (n = 7–10). Data are given as mean ± SD, analyzed using Student’s t-test. **, P < 0.01 for LFABP cKO mice versus LFABPfl/fl mice. AMB, ambulatory; LFABPfl/fl, floxed liver fatty acid-binding protein; LFABPint−/−, intestine-specific liver fatty acid-binding protein knockout; LFABPliv−/−, liver-specific liver fatty acid-binding protein knockout; TOT, total.
Figure 5.
Figure 5.
OGTT for fasted LFABPfl/fl (), LFABPliv−/− () and LFABPint−/− () mice after 12 weeks of 45% Kcal HF feeding. A, OGTT (n = 7–13); B, OGTT area under the curve (AUC) (n = 7–13) Data are given as mean ± SD for figure A and mean ± SE for figure B, analyzed using Student’s t-test. LFABP, liver fatty acid-binding protein; LFABPfl/fl, floxed liver fatty acid-binding protein; LFABPint−/−, intestine-specific liver fatty acid-binding protein knockout; LFABPliv−/−, liver-specific liver fatty acid-binding protein knockout; OGTT, Oral glucose tolerance test.
Figure 6.
Figure 6.
Liver weights and hepatic lipid handling in LFABPfl/fl (), LFABPliv−/− () and LFABPint−/− () mice after 12 weeks of 45% Kcal HF feeding. A, Liver weight (n = 9–10); B, liver weight/body weight ratio (n = 9–10); C, hepatic neutral lipids (TG, CE and FFA) levels (n = 7–8); D, hepatic lipid species (n = 6–8); E, FA oxidation rate, 14CO2 production (n = 8–9); F, FA oxidation rate, 14C-labeled ASMs (n = 10–11); G, blood VLDL-TG level (n = 5–14); Data are given as mean ± SD, analyzed using Student’s t-test. *, P < 0.05 and **, P < 0.01 for cKO LFABP versus LFABPfl/fl. ASM, Acid soluble metabolite; CHOL, cholesterol; CE, cholesteryl ester; DG, diglyceride; FA, fatty acid; LFABPfl/fl, floxed liver fatty acid-binding protein; LFABPint−/−, intestine-specific liver fatty acid-binding protein knockout; LFABPliv−/−, liver-specific liver fatty acid-binding protein knockout; MG, monoglyceride; PL, phospholipid; TG, triglyceride.
Figure 7.
Figure 7.
Intestinal lipid handling in LFABPfl/fl (), LFABPliv−/− () and LFABPint−/− () mice after 12 weeks of 45% Kcal HF feeding. A, Intestine length/BW ratio (n = 8–21); B, intestinal lipid species concentrations (n = 6–9); C, intestinal chylomicron secretion rates (blood TG levels) (n = 6–8); D, intestinal chylomicron secretion rates AUC (n = 6–8). Data are given as mean ± SD, analyzed using Student’s t-test. *, P < 0.05; **, P < 0.01 and ***, P < 0.001 for LFABPliv−/− versus LFABPfl/fl. #, P < 0.05; ##, P < 0.01 and ###, P < 0.001 for LFABPint−/− versus LFABPfl/fl. AUC, area under the curve; BW, body weight; CHOL, cholesterol; CE, cholesteryl ester; DG, diglyceride; FFA, free fatty acid; LFABPfl/fl, floxed liver fatty acid-binding protein; LFABPint−/−, intestine-specific liver fatty acid-binding protein knockout; LFABPliv−/−, liver-specific liver fatty acid-binding protein knockout; MG, monoglyceride; PL, phospholipid; TG, triglyceride; SI, Small intestine.
Figure 8.
Figure 8.
Tissue FA uptake after oral administration of 14C-oleic acid to 12-week HFD-fed LFABPfl/fl (), LFABPliv−/− () and LFABPint−/− () mice following an overnight fast. FA uptake into WAT, liver, P. Int, D. Int, gastrocnemius muscle, 14C-oleic acid appearance in the feces and the blood (n = 6–7). Data are given as mean ± SD, analyzed using Student’s t-test. *, P < 0.05 for LFABPliv−/− versus LFABPfl/fl. #, P < 0.05 for LFABPint−/− versus LFABPfl/fl. D. Int, distal intestine; LFABPfl/fl, floxed liver fatty acid-binding protein; LFABPint−/−, intestine-specific liver fatty acid-binding protein knockout; LFABPliv−/−, liver-specific liver fatty acid-binding protein knockout; P. Int, proximal intestine; WAT, white adipose tissue.
Figure 9.
Figure 9.
Relative quantitation of mRNA expression of genes involved in liver and intestinal lipid metabolism in 45% Kcal fat HF fed LFABPfl/fl and cKO mice. A, Expression of genes involved in hepatic FA/lipid uptake and FA transport (n = 4–9); B, Expression of genes involved in hepatic FA synthesis and oxidation (n = 4–9); C, Expression of genes involved in hepatic TG metabolism and expression of transcriptional genes (n = 4–9); D, expression of genes involved in intestinal lipid metabolic pathways (n = 5–6); Data are given as mean ± SD, analyzed using Student’s t-test. *, P < 0.05 for LFABPliv−/− versus LFABPfl/fl, #, P < 0.05 for LFABPint−/− versus LFABPfl/fl. LFABPfl/fl, floxed liver fatty acid-binding protein; LFABPint−/−, intestine-specific liver fatty acid-binding protein knockout; LFABPliv−/−, liver-specific liver fatty acid-binding protein knockout.
Figure 9.
Figure 9.
Relative quantitation of mRNA expression of genes involved in liver and intestinal lipid metabolism in 45% Kcal fat HF fed LFABPfl/fl and cKO mice. A, Expression of genes involved in hepatic FA/lipid uptake and FA transport (n = 4–9); B, Expression of genes involved in hepatic FA synthesis and oxidation (n = 4–9); C, Expression of genes involved in hepatic TG metabolism and expression of transcriptional genes (n = 4–9); D, expression of genes involved in intestinal lipid metabolic pathways (n = 5–6); Data are given as mean ± SD, analyzed using Student’s t-test. *, P < 0.05 for LFABPliv−/− versus LFABPfl/fl, #, P < 0.05 for LFABPint−/− versus LFABPfl/fl. LFABPfl/fl, floxed liver fatty acid-binding protein; LFABPint−/−, intestine-specific liver fatty acid-binding protein knockout; LFABPliv−/−, liver-specific liver fatty acid-binding protein knockout.

Similar articles

References

    1. Blüher M. Obesity: global epidemiology and pathogenesis. Nature reviews. Endocrinology 2019, 15, 288–298, doi:10.1038/s41574-019-0176-8. - DOI - PubMed
    1. Lottenberg A.M.; Afonso Mda S.; Lavrador M.S.; Machado R.M.; Nakandakare E.R. The role of dietary fatty acids in the pathology of metabolic syndrome. J Nutr Biochem 2012, 23, 1027–1040, doi:10.1016/j.jnutbio.2012.03.004. - DOI - PubMed
    1. Inoue Y.; Qin B.; Poti J.; Sokol R.; Gordon-Larsen P. Epidemiology of Obesity in Adults: Latest Trends. Curr Obes Rep 2018, 7, 276–288, doi:10.1007/s13679-018-0317-8. - DOI - PMC - PubMed
    1. Wycherley T.P.; Moran L.J.; Clifton P.M.; Noakes M.; Brinkworth G.D. Effects of energy-restricted high-protein, low-fat compared with standard-protein, low-fat diets: a meta-analysis of randomized controlled trials. Am J Clin Nutr 2012, 96, 1281–1298. - PubMed
    1. Ko C.W.; Qu J.; Black D.D.; Tso P. Regulation of intestinal lipid metabolism: current concepts and relevance to disease. Nat Rev Gastroenterol Hepatol 2020, 17, 169–183, doi:10.1038/s41575-019-0250-7. - DOI - PubMed

Publication types