[Preprint]. 2024 Mar 27:2024.03.21.586144.
doi: 10.1101/2024.03.21.586144.

BLOC1S1 control of vacuolar organelle fidelity modulates TH2 cell immunity and allergy susceptibility

Affiliations

BLOC1S1 control of vacuolar organelle fidelity modulates TH2 cell immunity and allergy susceptibility

Rahul Sharma et al. bioRxiv. .

Update in

Abstract

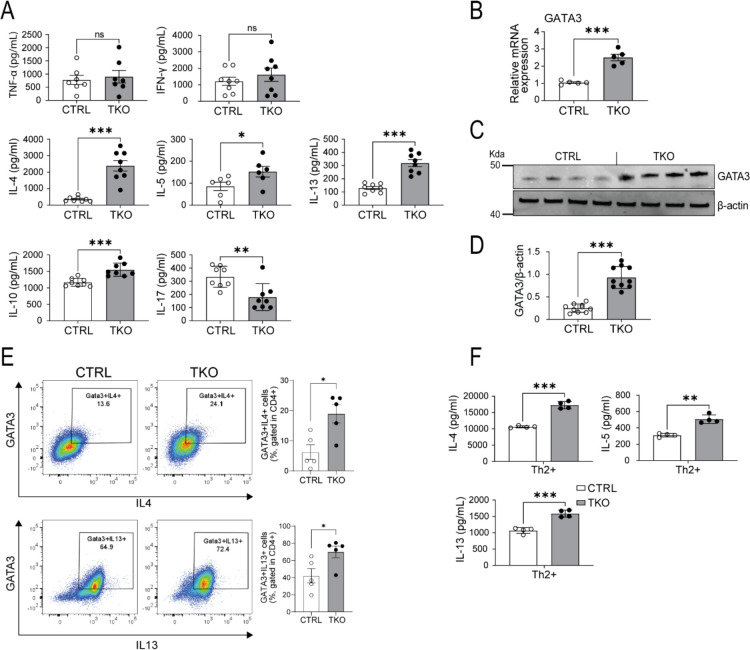
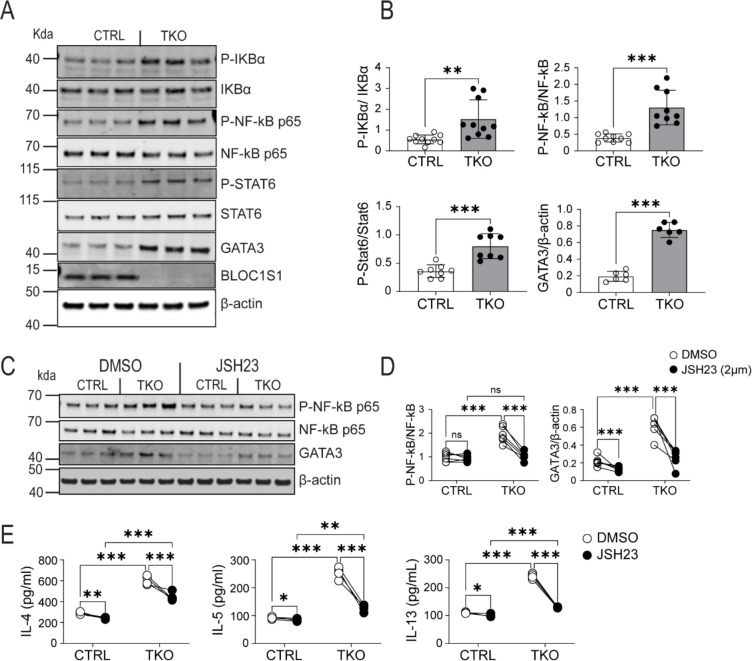
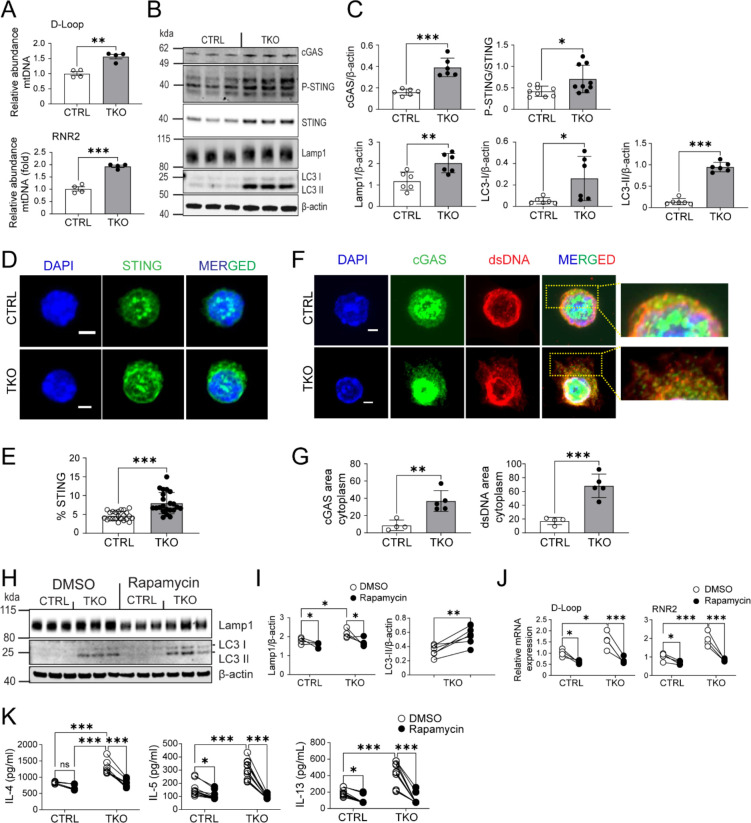
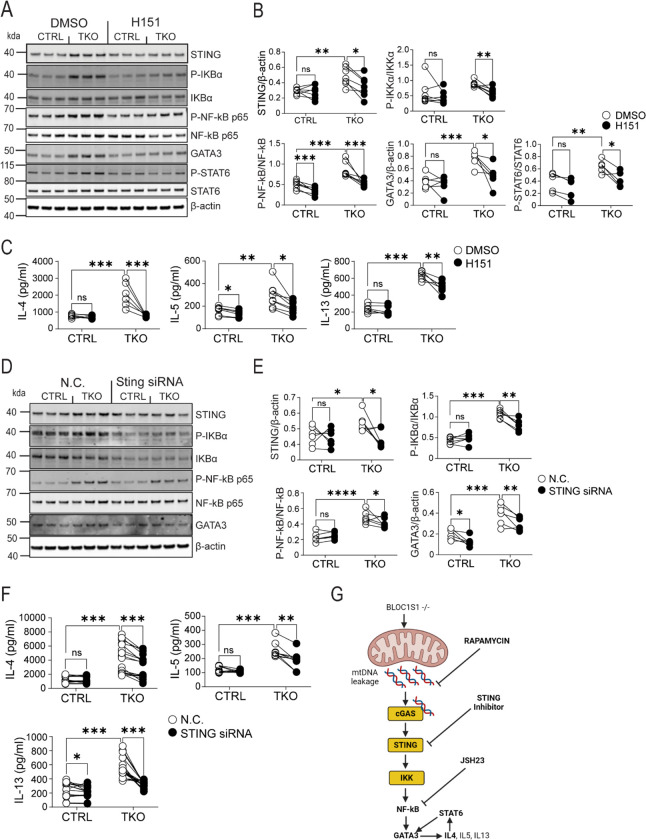
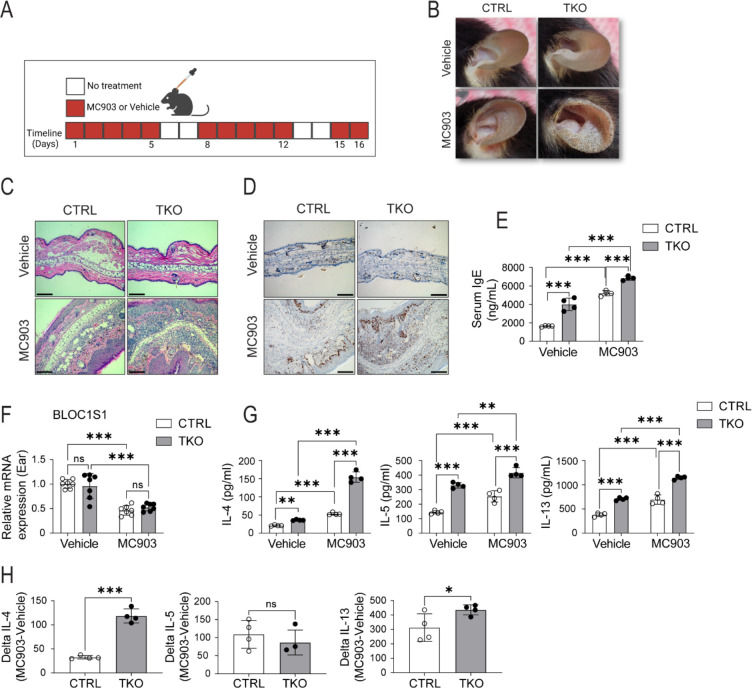
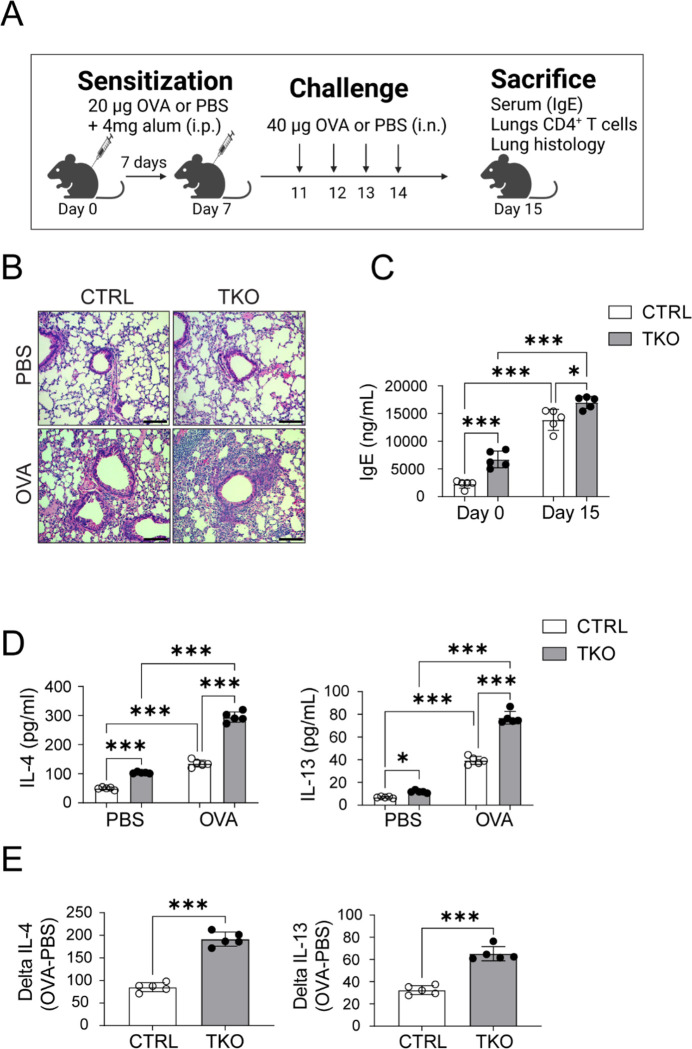
The levels of biogenesis of lysosome organelles complex 1 subunit 1 (BLOC1S1) control mitochondrial and endolysosome organelle homeostasis and function. Reduced fidelity of these vacuolar organelles is increasingly being recognized as important in instigating cell-autonomous immune cell activation. We reasoned that exploring the role of BLOC1S1 in CD4+ T cells, may further advance our understanding of regulatory events linked to mitochondrial and/or endolysosomal function in adaptive immunity. Transcript levels of the canonical transcription factors driving CD4+T cell polarization in response to activation showed that, the TH2 regulator GATA3 and phosphorylated STAT6 were preferentially induced in BLOC1S1 depleted primary CD4+ T (TKO) cells. In parallel, in response to both T cell receptor activation and in response to TH2 polarization the levels of IL-4, IL-5 and IL-13 were markedly induced in the absence of BLOC1S1. At the organelle level, mitochondrial DNA leakage evoked cGAS-STING and NF-kB pathway activation with subsequent TH2 polarization. The induction of autophagy with rapamycin reduced cytosolic mtDNA and reverses these TH2 signatures. Furthermore, genetic knockdown of STING and STING and NF-κB inhibition ameliorated this immune regulatory cascade in TKO cells. Finally, at a functional level, TKO mice displayed increased susceptible to allergic conditions including atopic dermatitis and allergic asthma. In conclusion, BLOC1S1 depletion mediated disruption of mitochondrial integrity to initiate a predominant TH2 responsive phenotype via STING-NF-κB driven signaling of the canonical TH2 regulatory program.


Figures

Figure 1.
Figure 1.. BLOC1S1 depleted CD4+ preferentially augments TH2 immune responsiveness
(A) TH1, TH2, Treg and TH17 associated cytokines released from CD4+ T cells isolated from the spleen of control (CTRL) and TKO mice, activated with antibodies directed against CD3 and CD28 for 3 days (n=7–8 per group). (B) qRT-PCR showing relative mRNA expression levels of GATA3 (n=5 per group). (C) Representative immunoblot analysis of GATA3 and β-actin. (D) Densitometry analysis of the relative protein levels of GATA3/β-actin in CD4+ T cell lysate from spleen of control and TKO mice (n=10 per group). (E) Representative flow-cytometric analysis of intracellular cytokines GATA3+IL4+ and GATA3+IL13+ in CD4+ T cells (n=5 per group). Values represent mean ± SEM.. (F) IL-4, IL-5 and IL-13 cytokine release in CD4+ isolated from the spleen of control and TKO mice, activated with αCD3 and αCD28, supplemented with TH2 differentiation cocktail for 3–4 days (n=4 per group). Values represent mean ± SEM. *P<0.05, *p<0.05, **p<0.01, ***p<0.001 vs. control mice using unpaired two-tailed student-t-test. FSC, forward scatter; SSC, side scatter.
Figure 2.
Figure 2.. BLOC1S1 deficiency results in enhanced IKK, NF-kB and STAT6 phosphorylation and GATA3 activity.
(A) Representative immunoblot for phospho-IκBα , IκBα, phospho-NF-κB p65, NF-κB p65, phospho-STAT6, STAT6, GATA3, BLOC1S1 and β-actin from splenic CD4+ T cells lysates from control and TKO mice. (B) Quantitation of the ratio of P-IκBα/IκBα, P-NF-κB p65/NF-κB p65, P-STAT6/STAT6 and GATA3/β-actin by densitometry analysis (n=6–10). (C) Representative immunoblot analysis of P-NF-κB P65, NF-κB p65, GATA3 and β-actin from contron and TKO CD4+ T cells incubated with either DMSO or 2 μM JSH23 for 12 hours. (D) Quantitation of the ratio of P-NF-κB p65/NF-κB p65 and GATA3/β-actin by densitometry analysis (n=5–6). (E) IL-4, IL-5 and IL-13 cytokine release in activated CD4+ T cells incubated with DMSO or JSH23 2uM for 12 hours (n=5–6). Values represent mean ± SEM. *p<0.05, **p<0.01, ***p<0.001 vs control mice by two-way ANOVA followed by the Tukey’s post hoc test or unpaired two-tailed student-t-test.
Figure 3.
Figure 3.. BLOC1S1 deficiency results in mtDNA release into cytosol and activation of cGAS-STING pathway.
(A) qRT-PCR showing relative mRNA expression levels of D-Loop and RNR2 in CD4+ T cells (n=4). (B) Representative immunoblot of cGAS, P-STING, STING, Lamp1, LC3 I/II and β-actin from CTRL and TKO CD4+ T cells. (C) Protein quantitation and ratio of cGAS/β-actin, P-STING/STING, Lamp1/β-actin, LC3 I/β-actin, LC3 II/β-actin and GATA3/β-actin by densitometry analysis (n=6–9). (D) Representative fluorescence images of STING (green) in activated CD4+ T cells. Nuclei were counterstained with 4’,6-diamidino-2-phenylinodole (DAPI) ( (blue). Scale bar = 2 μm. (E) Semiquantitative analysis of the mean intensity (%) of STING staining from CTRL and TKO CD4+ T cells (n=7 per group). (F) Representative fluorescence images of cGAS (green) and dsDNA (red) in activated CD4+ T cells. Nuclei were counterstained with DAPI (blue). Scale bar 2 μm. (G) Semiquantitave analysis of the Fluorescence area of cGAS and dsDNA staining in the cytoplasm (n=4–5 per group). (H) Representative immunblots for Lamp1, LC3I/II and β-actin from CTRL and TKO CD4+ T cells in response to either DMSO or 100 nM Rapamycin for 48 hours. (I) Protein densitometry ratio of Lamp1/β-actin and LC3-II/β-actin by densitometry analysis (n=5 per group). (J) qRT-PCR showing relative mRNA expression levels of D-Loop and RNR2 from CTRL and TKO CD4+ T cells following DMSO or Rapamycin 100nm incubation for 48 hours. (K) IL-4, IL-5 and IL-13 cytokine release in activated CD4+ T cells following DMSO or Rapamycin 100nM incubation (n=8–12 per group). Values represent mean ± SEM. *p<0.05, **p<0.01, ***p<0.001 vs control mice by two-way ANOVA followed by the Tukey’s post hoc test or unpaired two-tailed student-t-test.
Figure 4.
Figure 4.. STING knockdown resulted in reduced TH2 cytokines in BLOC1S1−/− CD4+ T cells.
(A) Representative immunoblots for STING, P-IκBα, IκBα, P-NF-κB p65, NF-κB p65, GATA3, P-STAT6, STAT6 and β-actin from CTRL and TKO CD4+ T cells following DMSO or H151 (500 nM) incubation for 48 hours. (B) Protein quantitation and ratio of STING/β-actin, P-IKBα/IKBα, P-NF-kB P65/NF-kB P65, GATA3/β-actin and P-STAT6/STAT6 by densitometry analysis (n=6–7 per group). (C) IL-4, IL-5 and IL-13 cytokine release in activated CD4+ T cells treated with either DMSO or H151 (500nM) (n=6–7 per group). (D) Representative immunoblots for STING, P-IκBα, IκBα, P-NF-κB p65, NF-kB p65, GATA3 and β-actin from CTRL and TKO CD4+ T cells incubated with negative control (N.C.) or with STING siRNA. (E) Protein quantitation and ratio of STING/β-actin, P-IκBα/IκBα, P-NF-κB P65/NF-κB P65 and GATA3/β-actin by densitometry analysis (n=6 per group). (F) IL-4, IL-5 and IL-13 cytokine release in activated CD4+ T cells incubated with either N.C. or STING siRNA (n=9–18 per group). (G) Schematic representation of proposed mechanistic pathway. Values represent mean ± SEM. *p<0.05, **p<0.01, ***p<0.001 vs control mice by two-way ANOVA followed by the Tukey’s post hoc test or unpaired two-tailed student-t-test.
Figure 5.
Figure 5.. Increased calcipotriol (MC903) induced atopic dermatitis in TKO mice.
(A) Daily study protocol for MC903 induced dermatitis (in red). (B) Gross appearance of Ethanol or MC903 application to CTRL and TKO mouse ears at day 12. (C) Representative H&E staining of ear sections at day 12. Scale bar = 100um. (D) Representative Ki67 staining of ear sections at day 12. Scale bar = 100um. (E) Plasma IgE levels from the mice following the topical application of ethanol or MC903 (n=4 per group). (F) qRT-PCR showing relative mRNA expression levels of BLOC1S1 from mourse ears in response to ethanol or MC903 (n=7 per group). (G) IL-4, IL-5 and IL-13 cytokine secreted levels at day 12 from CTRL and TKO CD4+ T cells isolated from auricular lymph nodes following ethanol or MC903 topical application (n=4 per group). (H) Delta IL-4, Delta IL-5 and Delta IL-13 cytokine values of CTRL and TKO CD4+ T cells in response to MC903 (n=4 per group). Values represent mean ± SEM. *p<0.05, **p<0.01, ***p<0.001 vs control mice by two-way ANOVA followed by the Tukey’s post hoc test or unpaired two-tailed student-t-test.
Figure 6.
Figure 6.. Increased ovalbumin induced airway inflammation in TKO mice.
(A) Daily protocol for ovalbumin induced airway inflammation in mice. (B) Representative H&E staining of lungs of PBS and Ovalbumin (OVA) administered CTRL and TKO mice. Scale bar = 100um. (C) Plasma IgE from the CTRL and TKO mice following PBS or OVA administration (n=5 per group). (D) IL-4 and IL-13 cytokine release from CD4+ T cells isolated from the lungs of CTRL and TKO mice in response to PBS or OVA administration (n=5 per group). (E) Delta IL-4 and Delta IL-5 levels (n=5 per group). Values represent mean ± SEM. *p<0.05, **p<0.01, ***p<0.001 vs control mice by two-way ANOVA followed by the Tukey’s post hoc test or unpaired two-tailed student-t-test.

Similar articles

References

    1. Makowski L., Chaib M., and Rathmell J. C.. 2020. Immunometabolism: From basic mechanisms to translation. Immunol Rev 295: 5–14. - PMC - PubMed
    1. Ryan D. G., and O’Neill L. A. J.. 2020. Krebs Cycle Reborn in Macrophage Immunometabolism. Annu Rev Immunol 38: 289–313. - PubMed
    1. Sack M. N. 2018. Mitochondrial fidelity and metabolic agility control immune cell fate and function. J Clin Invest 128: 3651–3661. - PMC - PubMed
    1. Roy D. G., Chen J., Mamane V., Ma E. H., Muhire B. M., Sheldon R. D., Shorstova T., Koning R., Johnson R. M., Esaulova E., Williams K. S., Hayes S., Steadman M., Samborska B., Swain A., Daigneault A., Chubukov V., Roddy T. P., Foulkes W., Pospisilik J. A., Bourgeois-Daigneault M. C., Artyomov M. N., Witcher M., Krawczyk C. M., Larochelle C., and Jones R. G.. 2020. Methionine Metabolism Shapes T Helper Cell Responses through Regulation of Epigenetic Reprogramming. Cell Metab 31: 250–266 e259. - PubMed
    1. Chen X., Lu Y., Zhang Z., Wang J., Yang H., and Liu G.. 2015. Intercellular interplay between Sirt1 signalling and cell metabolism in immune cell biology. Immunology 145: 455–467. - PMC - PubMed

Publication types