[Preprint]. 2024 Dec 30:2024.12.30.630680.
doi: 10.1101/2024.12.30.630680.

CEBPA repression by MECOM blocks differentiation to drive aggressive leukemias

Affiliations

CEBPA repression by MECOM blocks differentiation to drive aggressive leukemias

Travis J Fleming et al. bioRxiv. .

Update in

  • CEBPA repression by MECOM blocks differentiation to drive aggressive leukemias.
    Fleming T, Antoszewski M, Lambo S, Gundry M, Piussi R, Wahlster L, Shah SB, Reed F, Dong K, Paulo JA, Gygi S, Mimoso CA, Goldman S, Adelman K, Perry JA, Pikman Y, Stegmaier K, Barrachina MN, Machlus KR, Hovestadt V, Arruda A, Minden MD, Voit RA, Sankaran VG. Fleming T, et al. Blood. 2025 Sep 24:blood.2025028954. doi: 10.1182/blood.2025028954. Online ahead of print. Blood. 2025. PMID: 40991835

Abstract

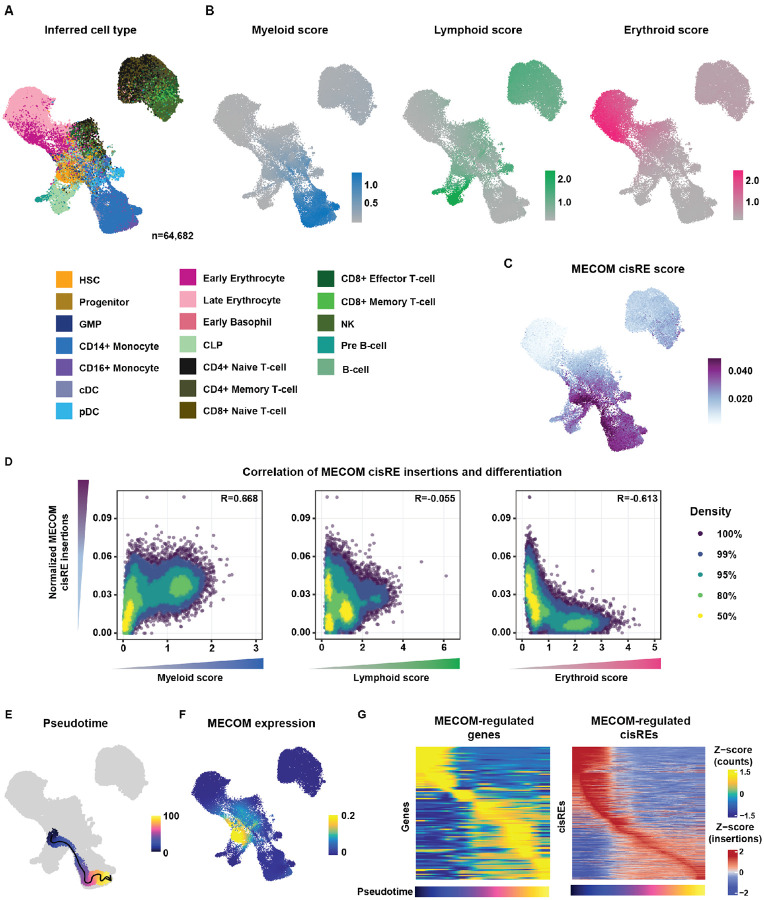
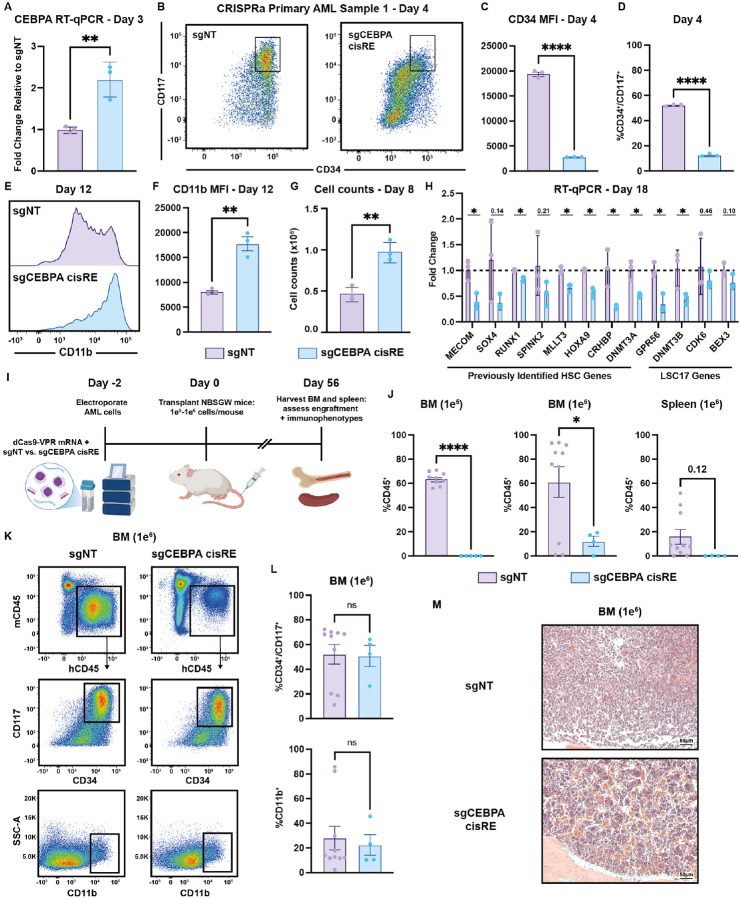
Acute myeloid leukemias (AMLs) have an overall poor prognosis with many high-risk cases co-opting stem cell gene regulatory programs, yet the mechanisms through which this occurs remain poorly understood. Increased expression of the stem cell transcription factor, MECOM, underlies one key driver mechanism in largely incurable AMLs. How MECOM results in such aggressive AML phenotypes remains unknown. To address existing experimental limitations, we engineered and applied targeted protein degradation with functional genomic readouts to demonstrate that MECOM promotes malignant stem cell-like states by directly repressing pro-differentiation gene regulatory programs. Remarkably and unexpectedly, a single node in this network, a MECOM-bound cis-regulatory element located 42 kb downstream of the myeloid differentiation regulator CEBPA, is both necessary and sufficient for maintaining MECOM-driven leukemias. Importantly, targeted activation of this regulatory element promotes differentiation of these aggressive AMLs and reduces leukemia burden in vivo, suggesting a broadly applicable differentiation-based approach for improving therapy.


Figures

Figure 1:
Figure 1:. FKBP12F36V degron facilitates rapid degradation of endogenous MECOM in AML cells.
(A) Schematic illustrating the gene-editing strategy to knock-in an FKBP12F36V degron, 2xHA tag, and eGFP at the C-terminus of the endogenous MECOM locus in human MUTZ-3 AML cells. (B) GFP expression assessed by flow cytometry in CD34+ vs. CD34 MUTZ-3 MECOM-FKBP12F36V cells. (C) Time course western blot analysis of MECOM protein levels in MUTZ-3 cells following treatment with dTAGV-1 (5–25nM) or DMSO. (D) Volcano plot showing changes in protein abundance in MUTZ-3 MECOM-FKBP12F36V cells treated for 2 hrs with 500nM dTAGV-1 vs. DMSO as assessed by mass spectrometry. n = 3 independent replicates. (E) MECOM ChIP-seq of MUTZ-3 MECOM-FKBP12F36V cells treated with 500nM dTAGV-1 vs. DMSO (n=3). Each row represents a single MECOM(HA)-bound peak. Heatmap is centered on ChIP-peak summits +/− 500bp. (F) Bivariate plot showing CD34 and CD14 expression levels in MUTZ-3 MECOM-FKBP12F36V cells treated with 500nM dTAGV-1 vs. DMSO. (G-H) Percentage of CD34+ and CD14+ cells as observed in Fig. 1F. n = 3 independent replicates, mean and SEM are shown. (I) Viable cell count by trypan blue exclusion of MUTZ-3 MECOM-FKBP12F36V cells treated with 500nM dTAGV-1 vs. DMSO. n = 3 independent replicates, mean and SEM are shown.
Figure 2:
Figure 2:. Multiomic profiling of MECOM-depleted cells reveals a predominantly repressive role at target sites.
(A) Schematic representation of experimental protocol for multiomic characterization of dTAGV-1 treated MUTZ-3 MECOM-FKBP12F36V cells. The CD34+, GFP+ MECOM-expressing population was pre-enriched via magnetic-activated cell sorting (MACS) prior to treatment with 500nM dTAGV-1 or DMSO. Cells were then harvested and processed for bulk RNA-seq, ATAC-seq, and Precision run-on sequencing (PRO-seq) to profile transcriptional and epigenetic changes. (B-C) Volcano plots representing changes in nascent gene expression assessed via PRO-seq in MUTZ-3 MECOM-FKBP12F36V cells treated with dTAGV-1 vs. DMSO for 1 and 4 hours. n = 3 independent replicates. (Table S4). (D) Volcano plot representing changes in gene expression assessed via bulk RNA-seq in MUTZ-3 MECOM-FKBP12F36V cells treated with dTAGV-1 vs. DMSO for 6 hours. n = 3 independent replicates (Table S3). (E) Volcano plot representing changes in chromatin accessibility as assessed by ATAC-seq in MUTZ-3 MECOM-FKBP12F36V cells treated with dTAGV-1 vs. DMSO for 6 hours. n = 3 independent replicates. Red data points represent chromatin peaks that are also bound by MECOM as assessed by MECOM-HA ChIP-seq. There are 837 of these sites that are schematically highlighted in the top right corner of the plot (Table S5). (F-G) Assessment of enhancer RNA (eRNA) transcription levels at 837 MECOM-bound differentially accessible peaks measured from PRO-seq data. (F) Average PRO-seq read density across all MECOM-regulated cisREs with +/− 2000bp on each side of the peak summit in dTAGV-1 vs. DMSO treated samples. (G) Box plot showing average PRO-seq read density in aggregate for each MECOM-regulated cisRE +/− 500bp on each side of the peak summit in dTAGV-1 vs. DMSO treated samples. Two-sided Student t test was used for comparisons. n = 3 independent replicates, ns, not significant. (H) Unbiased motif enrichment analysis of ATAC-seq differentially accessible peaks between dTAGV-1 and DMSO treated samples. (I) Venn diagram comparing gene expression and chromatin accessibility changes across sequencing modalities. Bulk RNA-seq differentially expressed genes (DEGs) from 6hr and 24hr dTAGV-1 treatment, PRO-seq DEGS from 4hr dTAGV-1 treatment, and genes in proximity (within 1 MB) to at least one MECOM-bound, differentially accessible ATAC-seq peak were overlapped to yield a consensus MECOM gene network consisting of 122 genes. Cutoffs for bulk RNA-seq and PRO-seq were p < 0.05 (Table S6–7). Peak-to-gene proximity was determined using the Genomic Regions Enrichment of Annotations Tool (GREAT). DAP, differentially accessible peak. (J) Schematic depiction of MECOM’s interaction with transcriptional co-repressor CtBP2 via MECOM’s PLDLS motif. This protein-protein interaction can be inhibited by a genetically-encoded 4x PLDLS peptide inhibitor (top) or if MECOM’s PLDLS motif is mutated to PLASS (bottom). (K) H3K27ac and CtBP2 ChIP-seq analysis. (Left) Heatmap displays CtBP2 ChIP-seq signal at MECOM-regulated cisREs in MUTZ-3 cells expressing a 4x-PLDLS peptide inhibitor of the MECOM-CtBP2 interaction compared to cells expressing 4x-PLASS control. (Right) Heatmap showing H3K27ac ChIP-seq signal at MECOM-regulated cisREs in MUTZ-3 MECOM-FKBP12F36V cells treated with 500nM dTAGV-1 or DMSO for 6 hours. (L-M) Experimental overview for lentiviral MECOM add-back rescue experiment. (L) MUTZ-3 MECOM-FKBP12F36V cells were transduced with lentiviruses constitutively expressing either WT MECOM (EVI1 isoform) or MECOM PLDLS>PLASS along with a TagRFP transduction reporter at high MOI. (M) CD34 expression assessed by flow cytometry as a function of treatment duration (500nM DMSO vs. dTAGV-1) (bottom). Histogram of CD34 expression at day 15 (top). Samples were transduced 48 hours prior to treatment. n = 3 independent replicates, mean and SEM are shown but many are hidden due to low variation between replicates.
Figure 3:
Figure 3:. Direct MECOM gene network is repressed in primary leukemia cells.
(A) UMAP of 40,866 cells derived from 11 patients with leukemias driven by MLL rearrangements sequenced using single cell RNA sequencing. UMAPs were colored from top to bottom by patient, whether MECOM is expressed, and MECOM expression counts per cell. (B) Same UMAPS as (A) colored by expression signatures of normal HSCs and normal monocytes derived from Lambo et al 2023 and MECOM-regulated genes identified to be activated after depletion of MECOM (Figure 2). (C) Quantification of the three signatures from (B) compared between MECOM positive leukemias (n=5) and MECOM negative leukemias (n=6). Significance was calculated using two sided Wilcoxon signed-rank tests corrected for multiple testing using BH. (D) Differential expression of all analyzed genes (n=28,113) between leukemias expressing MECOM and leukemias that did not express MECOM. Differential expression was performed using MAST using 10 iterations of 1000 randomly selected MECOM positive cells and 1000 randomly selected MECOM negative cells to prevent uninformative p-values. BH corrected p-values and log fold changes shown are the average of 10 iterations.
Figure 4:
Figure 4:. Direct MECOM chromatin network is repressed in primary leukemia cells.
(A) UMAP of 64,682 cells generated using scATAC-seq from remissions of pediatric AML patients (n=20). Cells were colored by predicted cell type derived using label transfer of matching scRNA-seq data. Labels were derived from Lambo et al 2023. (B) UMAP showing the same cohort as Fig. 4A colored by lineage scores. Lineage scores were calculated as the total insertions in 5000 accessible sites in each lineage, normalized to accessible sites in the other two lineages (accessible sites derived from Lambo et al 2023). (C) Cells colored by chromatin accessibility at MECOM-bound loci that were identified to increase in accessibility after depletion of MECOM. Scores were calculated by ATAC-seq reads at MECOM-bound loci divided by ATAC-seq reads in the TSS and corrected for Tn5 bias. Scores were scaled to the 99th quantile to reduce the effect of outliers. (D) Spearman correlation between lineage scores and MECOM cisRE scores. Each dot represents one cell, cells were colored by density. (E) UMAP showing a trajectory inferred using Monocle from inferred HSCs to inferred Monocytes. (F) UMAP showing the scaled expression of MECOM in counts from linked scRNA data across cells from remissions. (G) Heatmaps showing the scaled expression of MECOM-regulated genes (n=122) and cisREs (n=837) along the monocyte trajectory (pseudotime). Each column represents an aggregated minibulk from cells across the inferred pseudotime (100 bins total). Normalized gene expression scores are derived from linked scRNA samples, ATAC-seq signal was normalized by TSS insertions and Tn5 bias. Both gene expression and ATAC-seq signal were scaled across all cells in the pseudotime.
Figure 5:
Figure 5:. Functional CRISPR screening identifies CEBPA cisRE as a key regulator of myeloid differentiation in high-risk leukemia.
(A) Schematic overview of the CRISPR screens utilized to functionally interrogate MECOM-regulated cis-regulatory elements. An sgRNA oligo library was designed against MECOM-regulated elements (up to 5 sgRNAs per element, depending on availability of high quality sgRNAs-targeting sites) and packaged into a lentiviral vector. Two different populations of MUTZ-3 MECOM-FKBP12F36V cells were then transduced with this sgRNA library virus at an MOI of ~0.33; one population expressing dCas9-KRAB (CRISPRi screen) and another expressing dCas9-VPR (CRISPRa screen). Cells in the CRISPRi screen were treated with 500nM dTAGV-1 for the duration of the screen. After 14 days of in vitro culture, cells from the CRISPRi screen and CRISPRa screen were sorted for phenotypically rescued CD34+ cells (up-assay) and differentiated CD34 cells (down-assay), respectively. Genomically integrated sgRNAs were sequenced to assess relative sgRNA abundance. Both screens were performed with n = 3 independent replicates. (B-C) Volcano plots depicting sgRNA enrichment/depletion from sorted populations compared to plasmid library DNA (pDNA) (Table S8). The sgRNA library included sgRNAs targeting the transcription start sites (TSS) of VHL, ELOB, and ELOC (5 sgRNAs per gene) which form the E3 ubiquitin-ligase complex recruited by dTAGV-1. (D) Genome browser tracks at the CEBPA locus encompassing the +42kb cisRE. ATAC-seq tracks from MECOM-FKBP12F36V cell line models and MECOM ChIP-seq demonstrate increased chromatin accessibility upon dTAGV-1 treatment. Three top-scoring CEBPA cisRE-targeting sgRNAs were selected for single sgRNA validation experiments. (E) MUTZ-3 dCas9-KRAB cells were infected with sgRNA-expressing lentiviruses targeting either the CEBPA cisRE or a non-targeting (NT) sequence. 48 hours after transduction, cells were treated with 500nM dTAGV-1 vs. DMSO. (Top) Histogram shows CD34 expression at day 9. (Bottom) Percentage of CD34+ cells at day 9. n = 3 independent replicates, mean and SEM are shown. (F) RT-qPCR of CEBPA expression in dTAGV-1 treated cells 3 days post-treatment. Fold change represents ΔΔCt values compared to the sgNT condition. n = 3 independent replicates, mean and SEM are shown. Two-sided Student t test was used for comparisons. ****p < 0.0001. (G) MUTZ-3 dCas9-VPR cells were infected with sgRNA-expressing lentiviruses targeting either the CEBPA cisRE or a non-targeting (NT) sequence. (Top) Histogram shows CD34 expression at day 9. (Bottom) Percentage of CD34+ cells at day 9. n = 3 independent replicates, mean and SEM are shown. (H) RT-qPCR of CEBPA expression in all conditions 3 days post-transduction. Fold change represents ΔΔCt values compared to the sgNT condition. n = 3 independent replicates, mean and SEM are shown. Two-sided Student t test was used for comparisons. ****p < 0.0001.
Figure 6:
Figure 6:. CEBPA cisRE is necessary for differentiation of MECOM-driven AML cells.
(A) Primary MECOM+ AML cells were harvested from patients at diagnosis and cryopreserved (Table S9). Cells were thawed for short-term ex vivo culture and electroporated with CRISPR-Cas9 RNPs to induce genetic perturbations at the MECOM vs. AAVS1 locus +/− CEBPA +42kb cisRE. (B) Efficiency of gene editing in 3 biologically distinct primary AMLs at the AAVS1, MECOM, and CEBPA (cisRE) loci. Editing estimated using Sanger sequencing of amplicons followed by sequence trace decomposition analysis with ICE tool. For CEBPA cisRE, only deletions resulting from dual guide cleavage were counted. n = 3 technical replicates, mean and SEM are shown. (C-D) RT-qPCR of CEBPA and MECOM expression in all conditions 3 days post-electroporation. Fold change represents ΔΔCt values compared to the sgNT condition. n = 3 technical replicates, mean and SEM are shown. (E-G) Immunophenotypic analysis of primary leukemia sample (patient 1, Table S9) 6 days post-electroporation. (E) Bivariate plot showing CD34 and CD117 expression assessed by flow cytometry. Black box denotes CD34+/CD117+ subset. (F) Percentage of CD34+/CD117+ cells. (G) CD34 expression measured by mean fluorescence intensity (MFI). n = 3 independent replicates, mean and SEM are shown. Two-sided Student t test was used for comparisons. ****p < 0.0001. (H-I) Immunophenotypic analysis of primary leukemia sample (patient 2, Table S9) 8 days post-electroporation. (H) Histogram showing CD34 expression assessed by flow cytometry. (I) Percentage of CD34+ cells. n = 3 independent replicates, mean and SEM are shown. Two-sided Student t test was used for comparisons. ***p < 0.001. (J-K) Immunophenotypic analysis of primary leukemia (patient 3, Table S9) 8 days post-electroporation. (J) Histogram showing CD34 expression assessed by flow cytometry. (K) Percentage of CD34+ cells. n = 3 independent replicates, mean and SEM are shown. Two-sided Student t test was used for comparisons. ***p < 0.001.
Figure 7:
Figure 7:. Transient activation of CEBPA cisRE is sufficient to differentiate high-risk, stem cell-like AML cells.
(A) RT-qPCR of CEBPA expression 3 days post-electroporation. Fold change represents ΔΔCt values compared to the sgNT condition. n = 3 independent replicates, mean and SEM are shown. Two-sided Student t test was used for comparison. **p < 0.01. (B-D) Immunophenotypic analysis of primary leukemia sample (patient 1, Table S9) 4 days post-electroporation. (B) Bivariate plot showing CD34 and CD117 expression assessed by flow cytometry. Black box denotes CD34+/CD117+ subset. (C) CD34 expression measured by MFI. (D) Percentage of CD34+/CD117+ cells. n = 3 independent replicates, mean and SEM are shown. Two-sided Student t test was used for comparisons. ****p < 0.0001. (E-F) Immunophenotypic analysis of primary leukemia sample (patient 1, Table S9) 12 days post-electroporation (E) Histogram showing CD11b expression assessed by flow cytometry. (F) Percentage of CD11b+ cells. n = 3 independent replicates, mean and SEM are shown. Two-sided Student t test was used for comparison. **p < 0.01. (G) Viable cell counts by trypan blue exclusion in primary leukemia sample (patient 1, Table S9) 8 days post-electroporation. n = 3 independent replicates, mean and SEM are shown. Two-sided Student t test was used for comparison. **p < 0.01. (H) RT-qPCR data of a panel of established HSC genes and LSC17 genes 18 days post-electroporation demonstrating the robust differentiation of primary leukemia sample (patient 1, Table S9) following transient activation of CEBPA cisRE. n = 3 independent replicates, mean and SEM are shown. Two-sided Student t test was used for comparison. *p < 0.05. (I) Schematic of experiment to assess the in vivo impact of CEBPA cisRE activation of xenotransplanted primary leukemia sample (patient 1, Table S9). Cells were electroporated with mRNA encoding dCas9-VPR and two chemically synthesized sgRNAs targeting the CEBPA cisRE or a non-targeting sgRNA (sgNT). Cells recovered in ex vivo culture for 2 days post-electroporation and then injected via tail vein. All animals were sacrificed 56 days after transplant for analysis of leukemia burden in spleens and bone marrow. (J) Quantification of human cell chimerism (hCD45+) in the bone marrow of mice transplanted with 1e5-1e cells and spleens of mice transplanted with 1e cells. n = 4–10 xenotransplant recipients as shown, mean and SEM are shown. Two-sided Student t test was used for comparison. ****p < 0.0001, *p < 0.05. (K-L) Immunophenotypic analysis of the bone marrow of mice transplanted with 1e cells. Cells were labeled with cocktail of antibodies including mouse CD45, and human CD45, CD34, CD117, and CD11b. (K) Bivariate plots depicting gating strategy for quantification of engrafted leukemia stem/progenitor cells (CD34+/CD117+) and mature cells (CD11b+). Black boxes denote human cell subset (top), CD34+/CD117+ subset (middle), and CD11b+ subset (bottom). (L) Percentage of CD34+/CD117+ cells (top) and CD11b+ cells (bottom). n = 4–10 xenotransplant recipients as shown, mean and SEM are shown. Two-sided Student t test was used for comparison. ns, not significant. (M) Hematoxylin and eosin (H&E) staining of bone marrow of mice transplanted with 1e cells.

References

    1. Döhner H., Weisdorf D. J. & Bloomfield C. D. Acute myeloid leukemia. N. Engl. J. Med. 373, 1136–1152 (2015). - PubMed
    1. Klco J. M. et al. Functional heterogeneity of genetically defined subclones in acute myeloid leukemia. Cancer Cell 25, 379–392 (2014). - PMC - PubMed
    1. Papaemmanuil E. et al. Genomic classification and prognosis in acute myeloid leukemia. N. Engl. J. Med. 374, 2209–2221 (2016). - PMC - PubMed
    1. Kim D. D. H. et al. The 17-gene stemness score associates with relapse risk and long-term outcomes following allogeneic haematopoietic cell transplantation in acute myeloid leukaemia. EJHaem 3, 873–884 (2022). - PMC - PubMed
    1. van Galen P. et al. Single-cell RNA-seq reveals AML hierarchies relevant to disease progression and immunity. Cell 176, 1265–1281.e24 (2019). - PMC - PubMed

Publication types

LinkOut - more resources