[Preprint]. 2025 Jan 4:2025.01.04.631335.
doi: 10.1101/2025.01.04.631335.

Single-nucleus transcriptomics reveals time-dependent and cell-type-specific effects of psilocybin on gene expression

Affiliations

Single-nucleus transcriptomics reveals time-dependent and cell-type-specific effects of psilocybin on gene expression

Clara Liao et al. bioRxiv. .

Abstract

There is growing interest to investigate classic psychedelics as potential therapeutics for mental illnesses. Previous studies have demonstrated that one dose of psilocybin leads to persisting neural and behavioral changes. The durability of psilocybin's effects suggests that there are likely alterations of gene expression at the transcriptional level. In this study, we performed single-nucleus RNA sequencing of the dorsal medial frontal cortex of male and female mice. Samples were collected at 1, 2, 4, 24, or 72 hours after psilocybin or ketamine administration and from control animals. At baseline, major excitatory and GABAergic cell types selectively express particular serotonin receptor transcripts. The psilocybin-evoked differentially expressed genes in excitatory neurons were involved in synaptic plasticity, which were distinct from genes enriched in GABAergic neurons that contribute to mitochondrial function and cellular metabolism. The effect of psilocybin on gene expression was time-dependent, including an early phase at 1-2 hours followed by a late phase at 72 hours of transcriptional response after administration. Ketamine administration produced transcriptional changes that show a high degree of correlation to those induced by psilocybin. Collectively, the results reveal that psilocybin produces time-dependent and cell-type specific changes in gene expression in the medial frontal cortex, which may underpin the drug's long-term effects on neural circuits and behavior.

Keywords: Psychedelic; RNA sequencing; frontal cortex; inhibitory neurons; ketamine; pyramidal cells.


Figures

Fig. 1:
Fig. 1:. Single-nucleus RNA sequencing of mouse medial frontal cortex after psilocybin administration.
(a) Experimental workflow. (b) UMAP representation of the snRNA-seq data set including 122,685 nuclei from psilocybin-treated mice (range = 18,944 – 31,443 nuclei per time point; n = 17 animals) and 56,693 nuclei from the control mice (n = 8 animals). Color denotes the cell-type cluster. (c) Heatmap for the expression of cell-type-specific genes for the cell-type clusters. Dendrogram was generated by performing hierarchical clustering using expression profiles across all conditions. CPM, count per million. L6-CT, layer 6 corticothalamic. L5-PT, layer 5 pyramidal tract. L4/5-IT, layer 4/5 intratelencephalic. L4-IT, layer 4 intratelencephalic. L2/3-IT, layer 2/3 intratelencephalic. L5/6-IT, layer 5/6 intratelencephalic. CIN-VIP, cortical vasointestinal peptide-expressing interneurons. CIN-PV, cortical parvalbumin-expressing interneurons. CIN-SST, cortical somatostatin-expressing interneurons. OL, oligodendrocytes. AC, astrocytes. OPC, oligodendrocyte progenitor cells.
Fig. 2:
Fig. 2:. Cell-type specific expression of serotonin receptor transcripts in the mouse medial frontal cortex
(a) UMAP representation of the snRNA-seq data set. Blue circle, cell in control mice that expresses Htr1a. Gray circle, cell in control mice that does not express Htr1a. (b, c) Similar to (a) for Htr2a and Htr2c respectively. (d) The expression level of Htr1a for the 12 cell-type clusters. (e, f) Similar to (d) for Htr2a and Htr2c respectively. (g) Single-cell transcript counts summed from the mouse ACA, ALM, ORB, and PL-ILA regions, extracted from the SMART-Seq data set from Allen Institute. Slc17a7 and Gad1 are markers of excitatory and GABAergic neurons, respectively. Pvalb, Cck, Vip, Sst, and Ndnf are markers of subtypes of GABAergic neurons.
Fig. 3:
Fig. 3:. Psilocybin-induced transcriptional changes in frontal cortical excitatory neurons are involved in synaptic plasticity
(a) Schematic of the cortical microcircuit highlighting the PT and IT excitatory pyramidal neurons. (b) Differentially expressed genes (DEGs) identified by pseudobulk analysis for each time point for frontal cortical PT neurons and IT neurons. Each circle represents an individual gene. Red, upregulated with FDR < 0.05. Blue, downregulated with FDR < 0.05. (c) Top 15 terms from gene ontology enrichment analysis based on the DEGs, ranked based on the mean adjusted p-values across time points in both PT and IT neurons. n.p., not present. Grey, gene ontology enrichment analysis was not performed for time points with <100 DEGs with FDR < 0.05. (d) Expression levels of specific transcripts in L5-PT, L4/5-IT, L4-IT, L2/3-IT, L5/6-IT cell types following psilocybin administration, normalized to controls.
Fig. 4:
Fig. 4:. Psilocybin-induced transcriptional changes in frontal cortical GABAergic neurons contribute to mitochondrial function and metabolic processes
(a) Schematic of the cortical microcircuit highlighting the PV, SST, and VIP cell types that are grouped as cortical interneurons (CINs). (b) Differentially expressed genes (DEGs) identified by pseudobulk analysis for each time point for the CINs. Each circle represents an individual gene. Red, upregulated with FDR < 0.05. Blue, downregulated with FDR < 0.05. (c) Top 15 terms from gene ontology enrichment analysis based on the DEGs, ranked based on the mean adjusted p-values across time points in CINs. n.p., not present. Grey, gene ontology enrichment analysis was not performed for time points with <100 DEGs with FDR < 0.05. (d) Expression levels of specific transcripts in PV, SST, and VIP cell types following psilocybin administration, normalized to controls.
Fig. 5:
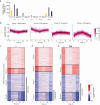
Fig. 5:. Early and late phases of transcriptional changes evoked by a single dose of psilocybin
(a) The number of DEGs (FDR < 0.05) identified by pseudobulk analysis for each time point for PT, IT, and CIN. (b) Time course of expression changes for DEGs for frontal cortical PT neurons belonging to each of the groups, identified via hierarchical clustering based on the temporal profile of expression changes (log2 fold change from control group at each of the 5 time points). Each line is an individual DEG. The lines are colored based on their proximity to the centroid of the group. (c) The heatmaps show the DEGs sorted based on hierarchical clustering, for frontal cortical PT neurons. Each row is an individual DEG. (d, e) Similar to (c) for frontal cortical IT neurons and CINs.
Fig. 6:
Fig. 6:. Similar sets of differentially expressed genes evoked by psilocybin and ketamine
(a) Experimental workflow. (b) UMAP representation of the snRNA-seq data set including 119,815 nuclei from psilocybin-treated mice (range = 21,542 – 28,008 nuclei per time point; n = 17 animals) and 56,693 nuclei from the control mice (n = 8 animals). Color denotes the cell-type cluster. (c) Correlation between psilocybin- and ketamine-evoked DEGs in the PT neurons (top row), IT neurons (middle row), and CINs (bottom row) at the different time points after drug administration. Dark gray circle, individual DEGs (FDR < 0.05 in either ketamine or psilocybin condition). Light gray circle, all other genes. Colored circles highlight specific example genes.

References

    1. Goodwin GM, et al. Single-Dose Psilocybin for a Treatment-Resistant Episode of Major Depression. N Engl J Med 387, 1637–1648 (2022). - PubMed
    1. Davis AK, et al. Effects of Psilocybin-Assisted Therapy on Major Depressive Disorder: A Randomized Clinical Trial. JAMA Psychiatry 78, 481–489 (2021). - PMC - PubMed
    1. Carhart-Harris R, et al. Trial of Psilocybin versus Escitalopram for Depression. N Engl J Med 384, 1402–1411 (2021). - PubMed
    1. Raison CL, et al. Single-Dose Psilocybin Treatment for Major Depressive Disorder: A Randomized Clinical Trial. JAMA 330, 843–853 (2023). - PMC - PubMed
    1. von Rotz R, et al. Single-dose psilocybin-assisted therapy in major depressive disorder: A placebo-controlled, double-blind, randomised clinical trial. EClinicalMedicine 56, 101809 (2023). - PMC - PubMed

Publication types

LinkOut - more resources