[Preprint]. 2025 Jan 3:2025.01.03.631111.
doi: 10.1101/2025.01.03.631111.

Convergent state-control of endogenous opioid analgesia

Affiliations

Convergent state-control of endogenous opioid analgesia

Blake A Kimmey et al. bioRxiv. .

Abstract

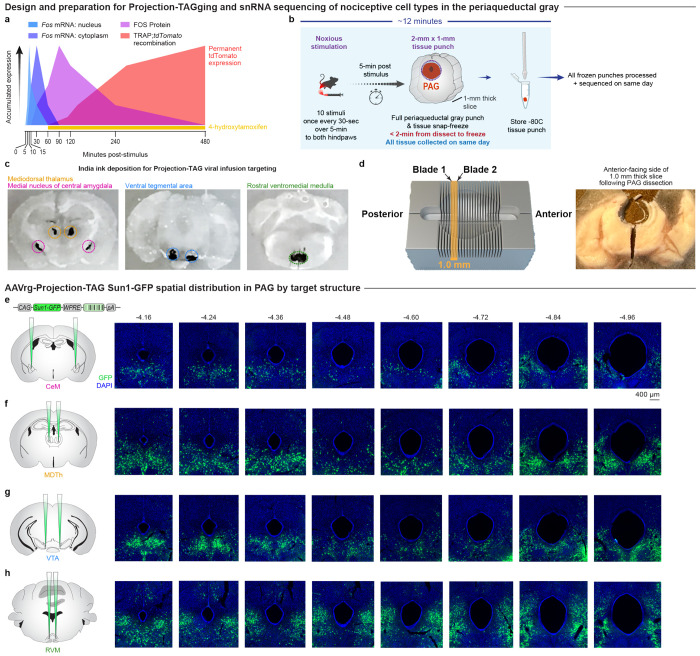
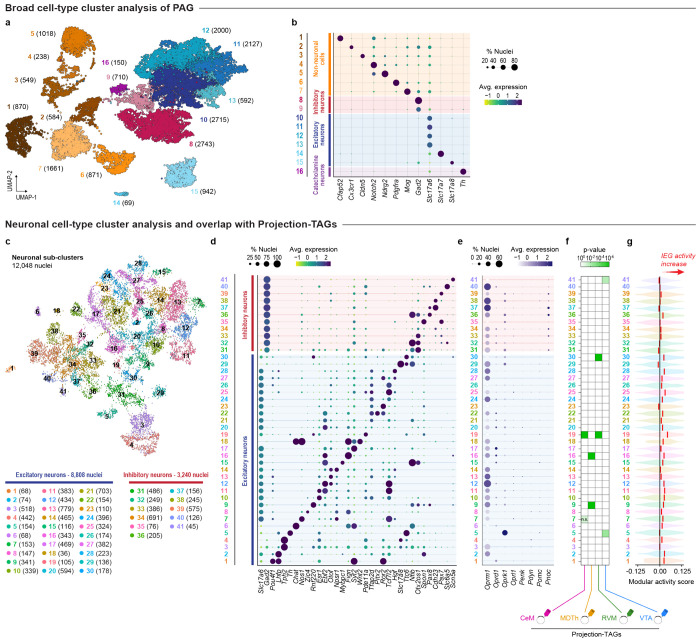
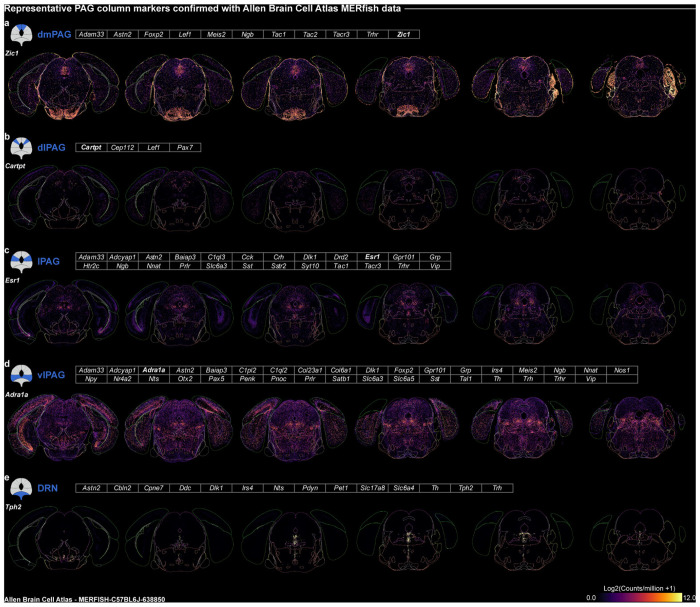
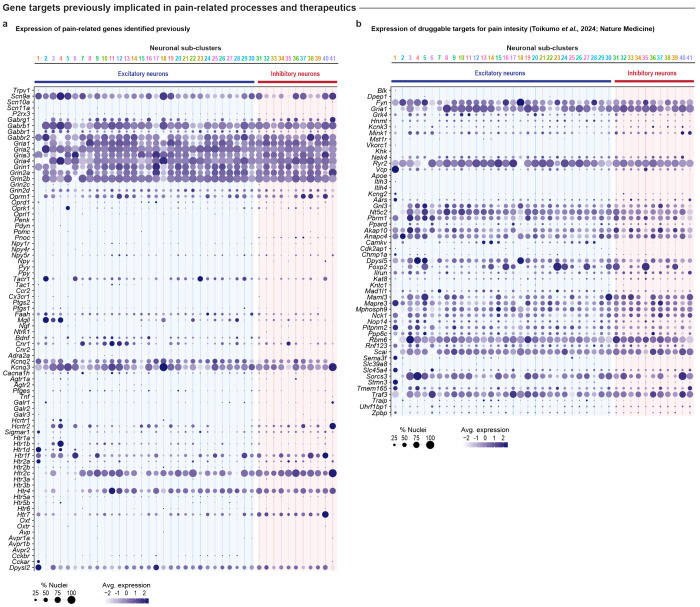
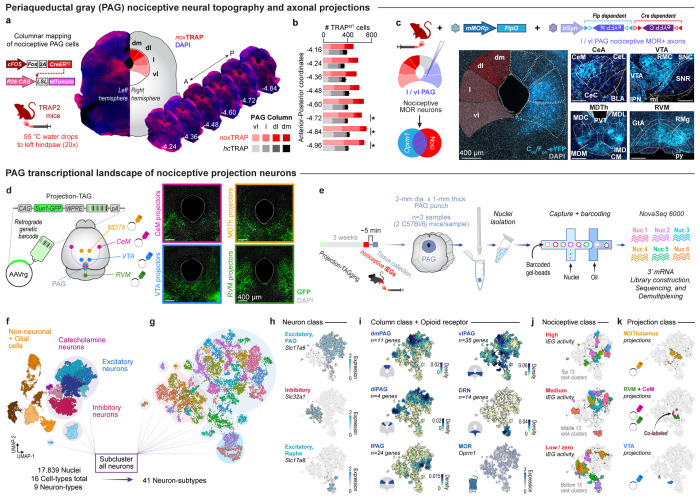
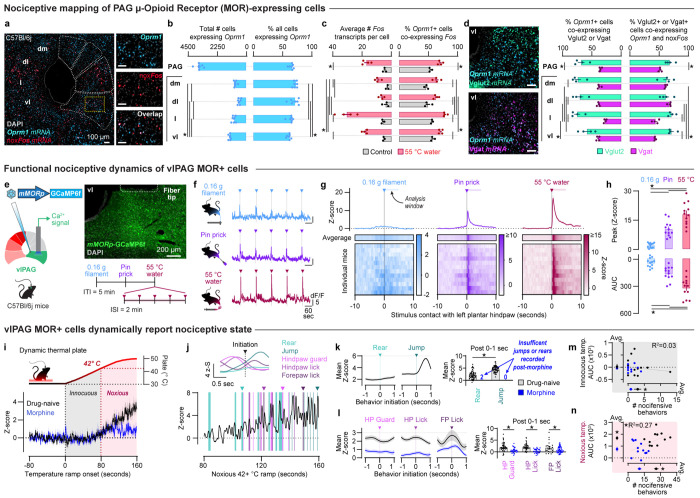
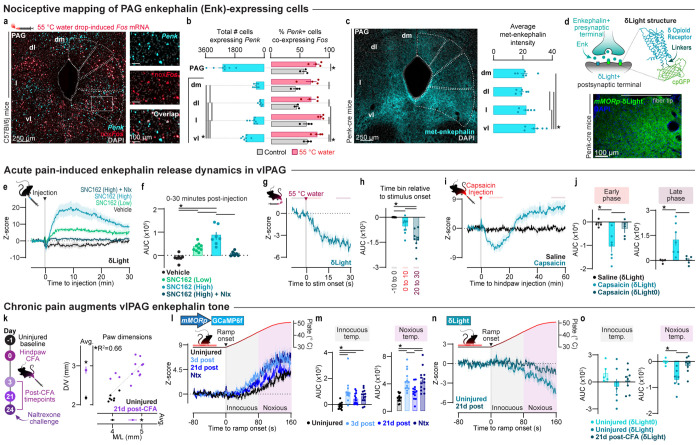
Pain is a dynamic and nonlinear experience shaped by injury and contextual factors, including expectations of future pain or relief1. While μ opioid receptors are central to the analgesic effects of opioid drugs, the endogenous opioid neurocircuitry underlying pain and placebo analgesia remains poorly understood. The ventrolateral column of the posterior periaqueductal gray is a critical hub for nociception and endogenous analgesia mediated by opioid signaling2. However, significant gaps remain in understanding the cell-type identities, the sub-second neural dynamics involved in pain modulation, the role of endogenous peptide neuromodulators, and the contextual factors influencing these processes. Using spatial mapping with single-nuclei RNA sequencing of pain-active neurons projecting to distinct long-range brain targets, alongside cell type-specific and activity-dependent genetic tools for in vivo optical recordings and modulation of neural activity and opioid peptide release, we identified a functional dichotomy in the ventrolateral periaqueductal gray. Neurons expressing μ opioid receptors encode active nociceptive states, whereas enkephalin-releasing neurons drive pain relief during recovery from injury, in response to learned fear predictions, and during placebo analgesia. Finally, by leveraging the functional effects of placebo analgesia, we used direct optogenetic activation of vlPAG enkephalin neurons to drive opioid peptide release, resulting in a robust reduction in pain. These findings show that diverse need states converge on a shared midbrain circuit that releases endogenous opioids with high spatiotemporal precision to suppress nociceptive activity and promote analgesia.


Conflict of interest statement

COMPETING INTERESTS G.C, K.D., C.R. are inventors on a provisional patent application through the University of Pennsylvania and Stanford University regarding the custom sequences used to develop, and the applications of mMORp and hMORp constructs (patent application number: 63/383,462 462 ‘Human and Murine Oprm1 Promoters and Uses Thereof’). B.C.R. receives research funding from Novo Nordisk and Boehringer Ingelheim and in-kind support from 10x Genomics and Oxford Nanopore Technologies that were not used in support of these studies.

Figures

Extended Data Figure 1.
Extended Data Figure 1.. Posterior vlPAG neurons are activated by acutely noxious stimulation and projects to other affective-motivational brain areas.
a. Representative 20x images of home cage TRAP (hcTRAP) and noxious 55 °C water-stimulated TRAP (noxTRAP) PAG slices at approximately A/P −4.60 relative to Bregma. b. Comparison of total TRAP-tdTomato (TRAPtdT) counts across all PAG columns combined between hcTRAP and noxTRAP groups. c. Comparison of total TRAPtdT counts for vlPAG, lPAG, dlPAG, and dmPAG, respectively, between hcTRAP and noxTRAP groups. d. Representative 4x images of brain areas with GFP+ axonal projections from nociceptive, Oprm1+ vlPAG neurons related to Figure 1c.
Extended Data Figure 2.
Extended Data Figure 2.. Details of tissue collection for single nucleus RNA sequencing and PAG Projection TAGging.
a. Time of Fos mRNA and FOS protein accumulation in the nucleus and cytoplasm of the cell used for designing tissue collection timing across all experiments. b. Timeline and schematic of tissue collection for single nucleus RNA sequencing of PAG. c. Example mouse used for establishing viral injection coordinates for each Projection-TAG; locations of India ink deposition are circled according to the Projection-TAG that would be injected into each region. d. Didactic for approximate location of 1-mm thick PAG slice collection in a brain sectioning matrix with example image of a punch made of the PAG after slicing and flash freezing. e-h. Representative 4x images of PAG demonstrating Sun1-GFP signal expressed by the AAVrg-CAG-Projection-TAG injected into medial nucleus of the central amygdala (CeM, e), mediodorsal thalamus (MDTh, f), ventral tegmental area (VTA, g), rostral ventromedial medulla (RVM, h).
Extended Data Figure 3.
Extended Data Figure 3.. Single nucleus RNA sequencing broad cell-type and neuronal cluster analyses.
a. Uniform Manifold Approximation and Projection (UMAP) of all nuclei (n=17,839) from the 3 noxious 55 °C water-stimulated samples (N=2 PAG punches per sample). b. Dotplot displaying major cell-type marker genes differentiating the broad cell-types. c. UMAP of neuronal nuclei (n=12,048) sub-clusters. d. Dotplot displaying a top gene differentiating each neuronal sub-cluster and categorization of each sub-cluster as excitatory or inhibitory neurons. e. Dotplot of opioid receptor and opioid peptide genes expressed in each neuronal sub-cluster. f. Heatmap of p-values demonstrating neuronal sub-clusters with significant levels of Projection-TAG barcode transcripts. g. Violin plot displaying the modular activity scores for immediate early gene expression across all neuronal sub-clusters.
Extended Data Figure 4.
Extended Data Figure 4.. Modular stratification of PAG columns for single nucleus RNA sequencing analysis.
a-e. Representative multiplexed error-robust fluorescence in situ hybridization (MERFISH) images from the Allen Brain Cell Atlas database (https://portal.brain-map.org/atlases-and-data/bkp/abc-atlas; MERFISH-C57BL6J-638850) demonstrating expression of select genes in dorsomedial (dm; a), dorsolateral (dl; b), lateral (l; c), and ventrolateral (vl; d) PAG columns in addition to the dorsal raphe nucleus (DRN; e). PAG column gene modules used to prepare density feature plots in Figure 1i are shown in table format.
Extended Data Figure 5.
Extended Data Figure 5.. Opioid receptor and peptide gene expression in PAG.
a-b. Representative MERFISH images from the Allen Brain Cell Atlas database (https://portal.brain-map.org/atlases-and-data/bkp/abc-atlas; MERFISH-C57BL6J-638850) demonstrating expression of opioid receptor genes (a) and opioid peptide precursor genes (b) across PAG columns and anterior-posterior coordinates.
Extended Data Figure 6.
Extended Data Figure 6.. Expression of pain-related and therapeutic gene targets in PAG.
a. Dotplot displaying top genes implicated in pain processes and their expression levels across all PAG neuronal sub-clusters. b. Dotplot displaying top genes identified as druggable targets for pain intensity by the Druggable Genome and Drug Gene Interaction Database and published as supplementary material in Toikumo et al., 2024, Nature Medicine, PMID: 38429522.
Extended Data Figure 7.
Extended Data Figure 7.. Oprm1 and Fos transcript levels by PAG column and treatment group.
a. Representative 20x fluorescence in situ hybridization images demonstrating mRNA transcripts for Oprm1 in a home cage control mouse and a noxious 55 °C water-stimulated mouse at approximately A/P −4.72 relative to Bregma. b. Comparison of Oprm1+ nuclei expressing low (1-4), moderate (5-9), high (10-14), and very high (15+) levels of Oprm1 transcript across all PAG columns between control and noxious 55 °C water-stimulated mice. c. Individual column comparisons of Oprm1 transcript levels within Oprm1+ nuclei between control and noxious 55 °C water-stimulated mice. d. Representative 20x fluorescence in situ hybridization images demonstrating mRNA transcripts for Fos in a home cage control mouse and a noxious 55 °C water-stimulated mouse at approximately A/P −4.72 relative to Bregma. e. Comparison of Fos transcript levels within Fos+ nuclei between control and noxious 55 °C water-stimulated mice. f. Individual column comparisons of Fos transcript levels within Fos+ nuclei between control and noxious 55 °C water-stimulated mice.
Extended Data Figure 8.
Extended Data Figure 8.. Nociceptive and opioid-related changes in vlPAG MOR+ population activity does not differ between sexes.
a. Representative 4x images of fiber placements and viral mMORp-GCaMP6f expression in right vlPAG related to Figure 2; white arrow in M1 denotes fiber tip location and yellow dashed circle indicates the cerebral aqueduct (aq). b. MOR+ population responses to light touch to the left hindpaw with a 0.16g von Frey filament across stimulus applications. c. Comparison of light touch-evoked MOR+ population response by sex. d. MOR+ population responses to noxious pin prick to the left hindpaw with a 25 gauge needle across stimulus applications. e. Comparison of noxious pin prick-evoked MOR+ population response by sex. f. MOR+ population responses to noxious 55 °C water to the left hindpaw across stimulus applications. g. Comparison of noxious 55 °C water-evoked MOR+ population response by sex. h. The dynamic thermal plate assay assesses changes in MOR+ population calcium-related responses across a range of temperatures, both innocuous (<42 °C) and noxious (≥42 °C), and treatment conditions (e.g. drug naïve vs. morphine-treated). i. Comparison of drug-naive bulk fluorescence (area under the curve, AUC; left) and total nocifensive behavior count (right) by sex at innocuous temperatures. j. Comparison of drug-naïve AUC (left) and total nocifensive behavior count (right) by sex at noxious temperatures. k. Comparison of morphine-treated AUC (10 mg/kg, i.p.; left) and total nocifensive behavior count (right) by sex at innocuous temperatures. l. Comparison of morphine-treated AUC (left) and total nocifensive behavior count (right) by sex at noxious temperatures. m. Detection of spontaneous calcium-related events in vlPAG was determined by calculating the median absolute deviation (MAD) of the recording baseline and using 3x MAD as the cutoff for event detection above noise. An example drug-naïve trace is shown. n. Calcium event transient detection in the same mouse treated with morphine (10 mg/kg, i.p.). o. Comparison of drug-naïve and morphine-treated events. p. Comparison of events detected in the drug-naïve condition by sex. q. Comparison of events detected in the morphine-treated condition by sex.
Extended Data Figure 9.
Extended Data Figure 9.. Enkephalinergic innervation of the PAG.
a. Representative 20x fluorescence in situ hybridization images demonstrating mRNA transcripts for Penk in a home cage control mouse and a noxious 55 °C water-stimulated mouse at approximately A/P −4.72 relative to Bregma. b. Comparison of Penk+ nuclei expressing low (1-4), moderate (5-9), high (10-14), and very high (15+) levels of Penk transcript across all PAG columns between control and noxious 55 °C water-stimulated mice. c. Individual column comparisons of Penk transcript levels within Penk+ nuclei between control and noxious 55 °C water-stimulated mice. d. Representative 4x images of met-enkephalin immunostaining in posterior PAG sections related to Fig. 3c. e. Retrograde-AAV mapping approach for identifying enkephalinergic inputs to vlPAG (left) and representative 20x viral expression in vlPAG (right). f. Detection of enkephalinergic (GFP-labeled; green) and non-enkephalinergic (mCherry-labeled; magenta) cells that project to vlPAG in the anterior cingulate cortex (ACC), medial nucleus of the central amygdala (CeM), ventromedial nuclei of the hypothalamus (VMH), ventral tegmental area (VTA), parabrachial nucleus (PBN), and rostral ventromedial medulla (RVM).
Extended Data Figure 10.
Extended Data Figure 10.. Details of δLight and δLight0 recording analysis and response to exogenous ligands.
a. Representative raw 465 nm (signal) and 405 nm (isosbestic) traces from a mouse expressing δLight in vlPAG that received an injection of the δ opioid receptor agonist SNC 162 (5.0 mg/kg, i.p.). b. Linear fit calculation using the entire 405 nm and 465 nm traces in the Photometry Modular Analysis Tool (pMAT), followed by subtraction of the fitted isosbestic from the excitation signal, revealed a persistent downward trend in the resultant ΔF/F trace. c. Non-linear, exponential fitting calculated using the pre-injection 405 nm and 465 nm traces, followed by subtraction of the fitted isosbestic from the excitation signal, mitigated the slow decay in δLight-related ΔF/F. d. Representative 20x fluorescence image demonstrating viral transduction of AAV1-hSyn-δLight0 and fiber optic tip location in vlPAG. e. Fluorescence responses of δLight0 to vehicle and SNC 162 (5.0 mg/kg, i.p.). f. Quantified δLight0 bulk fluorescence change (AUC) in response to either vehicle or the δ opioid receptor agonist SNC 162 (5.0 mg/kg, i.p.). g. Representative 20x image of AAV1-hSyn-δLight in vlPAG with fiber optic tip location noted. h. Average Z-scored responses to SNC 162 (5.0 mg/kg, i.p.) recorded from mice expressing δLight under the control of either the hSyn or mMOR promoter. i. Comparison of hSyn-δLight and mMORp-δLight fluorescence response to SNC 162. j. Average Z-scored responses to naloxone (4.0 mg/kg, i.p.) given 45 minutes after SNC 162 (5.0 mg/kg, i.p.) recorded from mice expressing δLight under the control of either the hSyn or mMOR promoter. k. Comparison of δLight bulk fluorescence response to naloxone by promoter.
Extended Data Figure 11.
Extended Data Figure 11.. Nociceptive changes in vlPAG enkephalin are the same across stimulus presentations and sex.
a. Comparison of noxious 55 °C water application to the hindpaw across each individual stimulus presentation. b. Comparison of δLight bulk fluorescence (AUC) in response to left plantar hindpaw capsaicin (10 μg) administration with respect to sex at early (5-15 min post-injection; left) and late (50-60 min post-injection; right) timepoints relative to injection onset. c. Innocuous (left) and noxious (right) temperature comparison of δLight bulk fluorescence by sex in the dynamic thermal plate assay.
Extended Data Figure 12.
Extended Data Figure 12.. Hindpaw saline injection does not substantially alter noxious thermal heat-related nociceptive responses in vlPAG MOR-expressing cells.
a. Timeline of dynamic thermal plate assay test days prior to and following hindpaw plantar injection of saline. b. Bulk calcium-related fluorescence in the vlPAG MOR+ population during the dynamic thermal plate assay at pre- and post-saline injection timepoints. c. Comparison of mMORp-GCaMP6f AUC at pre- and post-saline injection timepoints in the innocuous (left) and noxious (right) temperature ranges of the dynamic thermal plate assay. d. Noxious temperature range comparisons of Saline vs. CFA group AUC across each pre- and post-hindpaw injection timepoints.
Extended Data Figure 13.
Extended Data Figure 13.. vlPAG enkephalin release does not substantially differ across fear conditioning trials or by sex.
a. Didactic for the trace fear conditioning behavioral paradigm. b. Comparison of early (1-5) and late (6-10) trials during the initial tone presentations (Tone 1-5) within acquisition (left) and extinction (right) test days. c. Comparison of early and late trials during the final tone presentations (Tone 21-25) within acquisition (left) and extinction (right) test days. d. Comparison of the 5-second window prior to shock or omission during the trace period (Pre-shock) within acquisition (left) and extinction (right) test days, respectively. e. Comparison of the 5-second window immediately following the 2-second shock or equivalent period of shock omission (Post-shock and Post-omission) within acquisition (left) and extinction (right) test days, respectively. f. Average Z-scored mMORp-δLight fluorescence during trace fear conditioning acquisition in male and female mice. g. Comparison of δLight AUC at each trial phase period between sexes on the acquisition day. h. Average Z-scored mMORp-δLight fluorescence during trace fear conditioning extinction in male and female mice. i. Comparison of δLight AUC at each trial phase period between sexes on the extinction day.
Extended Data Figure 14.
Extended Data Figure 14.. Experimental setup for placebo analgesia conditioning.
a. Behavioral apparatus and equipment setup for placebo analgesia conditioning. The apparatus consists of two contiguous adjustable hotplate surfaces and a 2-chamber box with distinct visual cues. The hotplates are independently controlled via an Arduino microcontroller. Features of the setup are highlighted, showing overhead and front-facing camera views. Movement tracking was collected with the overhead camera and processed with Ethovision XT while nocifensive behaviors were quantified using the front-view camera in BORIS.
Extended Data Figure 15.
Extended Data Figure 15.. Placebo analgesia conditioning wanes in a sex-specific manner.
a. Comparison of male and female Side A preference across test days in the mMORp-GCaMP6f Control group. b. Comparisons of Side A preference during early (left) and late (right) Post-Test phases in the Control group. c. Comparison of male and female Side A preference across test days in the mMORp-GCaMP6f Conditioned group. d. Comparisons of Side A preference during early (left) and late (right) Post-Test phases in the Conditioned group. e. Comparison of latency to first entry into Side A (left) and duration of first Side A visit (left) by sex in the Control group. f. Comparison of latency to first entry into Side A (left) and duration of first Side A visit (left) by sex in the Conditioned group. g. Comparison of total number of nocifensive behaviors observed during the early (left) and late (right) Post-Test phases by sex in the Control group. h. Comparison of total number of nocifensive behaviors observed during the early (left) and late (right) Post-Test phases by sex in the Conditioned group. i. Average Z-scored mMORp-GCaMP6f bulk fluorescence traces for male and female mice in the Control group during the Post-Test. j. Comparison of bulk GCaMP6f fluorescence during the early (left) and late (right) Post-Test by sex in the Control group. k. Average Z-scored mMORp-GCaMP6f bulk fluorescence traces for male and female mice in the Conditioned group during the Post-Test. l. Comparison of bulk GCaMP6f fluorescence during the early (left) and late (right) Post-Test by sex in the Conditioned group.
Extended Data Figure 16.
Extended Data Figure 16.. Optogenetic stimulation of Penk+ neurons in vlPAG promotes sustained enkephalin release.
a. Representative 20x image of fiber optic tip location and viral expression of mMORp-δLight and Cre-dependent ChrimsonR in vlPAG of a Penk-Cre mouse. b. Average Z-scored mMORp-δLight traces surrounding 15 minutes of 10-Hz optogenetic stimulation in untreated and naloxone pre-treated (4.0 mg/kg, i.p.) conditions. c. Comparison of changes in δLight bulk fluorescence (AUC) across time windows prior to, during, and following optogenetic stimulation by drug treatment. d. Representative 20x image of fiber tip location and Cre-dependent ChRmine expression in a Penk-Cre mouse related to Figure 4r–s.
Extended Data Figure 17.
Extended Data Figure 17.. Fiber optic tip locations for all fiber photometry and optogenetics experiments.
a. Fiber optic tip locations for mice expressing mMORp-GCaMP6f in vlPAG by animal number, sex, and relevant experimental figure. Animals used in multiple figure panels are shown once for clarity. b. Fiber optic tip locations for mice expressing either hSyn-δLight or mMORp-δLight in vlPAG. Mice denoted with an arrowhead indicate inclusion in all listed figures. The mouse denoted with a star indicates histological verification of fiber optic tip placement is unavailable. c. Fiber optic tip locations for mice expressing hSyn-δLight0 or red-shifted opsins (i.e., ChrimsonR or ChRmine) in vlPAG.
Figure 1.
Figure 1.. Noxious stimulation recruits transcriptionally-defined opioidergic efferent circuits arising in the ventrolateral PAG.
a. Didactic (left) of noxious stimulus-induced targeted recombination in active populations (noxTRAP) procedure performed with TRAP2:Ai9 mice to permanently label nociceptive PAG cells with tdTomato fluorophore. The noxTRAP was achieved by repeated application of noxious 55° C water to the left hindpaw and administration of 4-hydroxy tamoxifen (4-OHT); unstimulated control mice received 4-OHT in the home cage (hcTRAP). Representative 4x images of anterior to posterior periaqueductal gray (PAG) sections demonstrating robust noxTRAP-related tdTomato labeling across columns of the PAG (right). b. Quantification of tdTomato-positive cells (TRAPtdT) within each PAG column between Control and 55° C water-stimulated groups; statistically significant between-groups comparisons are shown for the vl column. c. Methods for achieving intersectional labeling of nociceptive lPAG and vlPAG cells for output mapping (top). TRAP2 mice received a combination of AAVs expressing FlpO under control of the mMOR promoter and Cre/Flp-dependent eYFP under the hSyn promoter prior to the noxTRAP procedure (left). Representative 4x images (bottom right) demonstrate eYFP-expressing cells in blue in lPAG and vlPAG and their axonal projections in the medial nucleus of the central amygdala (CeM), ventral tegmental area (VTA), mediodorsal thalamic nuclei (MDTh), and rostral ventromedial medulla (RVM). d. Experimental design for injecting uniquely-barcoded retrograde-AAVs (i.e., Projection-TAGs) into four key nociceptive regions innervated by PAG: CeM, MDTh, VTA, and RVM (left). The Projection-TAG viruses also express nuclear localized Sun1-GFP in PAG in four separate mice (right). e. Three weeks after Projection-TAGging, mice received 55° C water drops to evoke noxious stimulus-related IEG expression in PAG followed by rapid dissection and tissue collection of the PAG using a 2-mm inner diameter micro-punch, followed by rapid freezing. Then, samples were prepared for single nucleus RNA sequencing. f. Uniform Manifold Approximation and Projection (UMAP) of all nuclei (left; n=17,839) captured by PAG punches in 16 unique clusters, 9 of which were neuronal. g. UMAP of the neuronal sub-clusters (right; n=41) separated into excitatory (blue shading) and inhibitory (red shading) classes. h. Feature plots of select genes representing PAG excitatory cell types (top; Vglut2), PAG inhibitory cell types (middle; Vgat), and dorsal raphe excitatory cell types (bottom; Vglut3). i. Density feature plots of gene groupings representative of each PAG column, dorsal raphe, and a feature plot of the μ opioid receptor (Oprm1). j. IEG expression was determined using a modular activity score and mapped to sub-clusters with high (top), medium (middle), and low or zero scores (bottom). k. Feature plots of neuronal sub-clusters containing Projection-TAGs.
Figure 2.
Figure 2.. The vlPAG MOR-expressing population represents pain and affective-motivational behavioral states.
a. Representative 20x fluorescence in situ hybridization images demonstrating mRNA transcripts for Fos (red) and Oprm1 (light blue) in vlPAG at approximately A/P −4.72 relative to Bregma. b. Quantification of total number of cells expressing Oprm1 transcript (left) and percent of all cells detected expressing Oprm1 (right) in the PAG and between columns. c. Full PAG and columnar comparisons of Fos transcripts per cell (left) and percent of Oprm1+ cells co-expressing Fos (right) between Control and 55° C water-stimulated mice. d. Representative 20x fluorescence in situ hybridization images demonstrating mRNA transcripts for Oprm1 (light blue), Vglut2 (green; left, top) and Vgat (magenta; left, bottom) in vlPAG at approximately A/P −4.72 relative to Bregma. Quantification of Oprm1+ cells co-expressing Vglut2 or Vgat (middle) and overlap of Vglut2 or Vgat with both Oprm1 and noxFos (right) with respect to the PAG and individual columns. e. Fiber photometry recordings were performed in the right vlPAG of mice expressing GCaMP6f under the mMOR promoter. A battery of 3 distinct stimuli were delivered to the left hindpaw; each stimulus was presented 5 times with a 2-miniuted inter-stimulus interval. f. Representative traces from a single mouse demonstrating innocuous and noxious stimulus-evoked transients. g. Group average traces and individual mouse heatmaps showing evoked responses to each stimulus modality (i.e., 0.16 g von Frey filament, 25-gauge needle tip, 55° C water drop). h. Comparison of peak Z-scores (top) and area under the curve (AUC; bottom) achieved with each stimulus type during the first 5 seconds after stimulus delivery. i. The dynamic thermal assay presents mice with a changing thermal surface (i.e., 30° C to 50° C, at 10°C/min) to assess changes in nociception and nociceptive activity of vlPAG MOR+ cells. Averaged traces in the drug-naïve and morphine-treated (10 mg/kg, i.p.) conditions are shown. j. A representative mouse displayed a range of affective-motivational self-attentive and escape-related behaviors that corresponded with unique changes in the bulk fluorescent signal during the noxious phase of the thermal ramp (bottom). Example behaviors that were mapped onto the calcium trace are denoted with arrowheads and plotted (top). k, l. Comparison of group averaged mean Z-score during the 1 second immediately following behavior onset for escape-related (k) and self-attentive behaviors (l). m. Correlation and separate comparisons of innocuous GCaMP6f signal AUC and nocifensive behaviors. n. Correlation and separate comparisons of noxious GCaMP6f signal AUC and nocifensive behaviors.
Figure 3.
Figure 3.. Rapid shifts in vlPAG enkephalin release define transitions from acute to protracted pain states.
a. Representative 20x fluorescence in situ hybridization images demonstrating mRNA transcripts for Penk (teal) and Fos (red) in vlPAG at approximately A/P −4.72 relative to Bregma. b. Quantification of total number of cells expressing Penk (left) and comparison of the percent of Penk+ cells co-expressing Fos between Control and 55° C water-stimulated mice (right) in the PAG and individual columns. c. Met-enkephalin immunoreactivity in PAG (left) and comparison on fluorescence intensity across PAG columns (right). d. Didactic for δLight function in vivo (top) and representative 20x image displaying mMORp-δLight expression (bottom). e. Averaged traces demonstrating agonist-induced changes in δLight fluorescence. f. Comparison of bulk fluorescence changes in δLight arising from vehicle, δ opioid receptor agonist SNC 162 (2.5 or 5.0 mg/kg, i.p.), or co-administration of SNC 162 (5.0 mg/kg, i.p.) with the antagonist naloxone (4.0 mg/kg, i.p.). g. Averaged δLight response to noxious 55° C water application to the left hindpaw. h. Comparison of δLight signal change across timepoints relative to onset of the 55° C water application. i. Averaged δLight responses to either saline or capsaicin (10 μg) to the left hindpaw. j. Comparison of δLight bulk fluorescence during the early (left; 5-15 min) and late (right; 50-60 min) timepoints relative to saline or capsaicin administration in mice expressing either δLight or the control sensor δLight0. k. Timeline for fiber photometry recordings before and after induction of bilateral hindpaw inflammatory pain with complete Freund’s adjuvant (CFA; left). Correlation and separate comparisons of CFA-inflamed and uninjured average paw depth (D/V) and width (M/L) at the time of perfusion approximately 28 days after hindpaw injections (right). l. Averaged mMORp-GCaMP6f recordings captured at multiple timepoints after CFA administration during the dynamic thermal plate assay. m. Comparison of bulk calcium-related fluorescence at innocuous (left) and noxious temperatures (right) of the thermal ramp. n. Averaged δLight traces recorded in the dynamic thermal plate assay at pre- and 3 weeks post-CFA timepoints. o. Comparison of bulk δLight fluorescence at innocuous (left) and noxious temperatures (right) of the thermal ramp.
Figure 4.
Figure 4.. Opposing pain expectancies converge on vlPAG opioidergic neurocircuitry that promotes pain relief.
a. The trace fear conditioning procedure involved two consecutive recording days. On the first, acquisition day, foot shock was preceded by a series of tones and a 20-second quiescent period. On the second, extinction day, a distinct context was used in which the tone and trace periods were not followed by shock. b. Group-averaged mMORp-δLight signal (left) and individual animal heatmaps (right) during the acquisition day of the trace fear conditioning protocol. c. Group-averaged mMORp-δLight signal (left) and individual animal heatmaps (right) during the extinction day of the trace fear conditioning protocol. d. Comparison of pre-tone, tone (i.e., tones 1-5 and 21-25), pre-shock, and post-shock 5-second windows between acquisition and extinction days. e. Timeline and experimental didactic for the placebo analgesia conditioning (PAC) assay. f. Comparison of preference for Side A across each session of the PAC assay between Control and Conditioned groups. g. Comparison of preference for Side A within the Post-Test of the PAC assay between Control and Conditioned groups. h. Comparisons of latency to enter Side A (left) and total duration of first visit to Side A (right) between Control and Conditioned groups. i. Nocifensive behavior counts and durations compared between Control and Conditioned groups during the early phase of the Post-Test (0-90 seconds; left column) and late phase of the Post-Test (90-180 seconds; right column). j. Averaged mMORp-GCaMP6f traces (left) and individual animal heatmaps (right) from Control and Conditioned groups during the Post-Test of the PAC assay. k. Comparisons of bulk GCaMP6f fluorescence between Control and Conditioned groups during the early Post-Test (left) and late Post-Test (right). l. Averaged mMORp-δLight traces (left) and individual animal heatmaps (right) from Control and Conditioned groups during the Post-Test of the PAC assay. m. Comparisons of bulk δLight fluorescence between Control and Conditioned groups during the early Post-Test (left) and late Post-Test (right). n. Experimental didactic for recording optically-evoked enkephalin release in vlPAG with δLight (left) and representative 20x image of δLight and Cre-dependent expression of the excitatory opsin ChrimsonR in vlPAG (right). o. Group-averaged δLight signal before, during, and after onset of 10 seconds of LED stimulation to activate ChrimsonR (left) and comparison of evoked enkephalin release at each timepoint (right). p. The dynamic thermal plate assay was used to assess the effect of unilateral optogenetic stimulation (10 Hz) of right vlPAG Penk cells on overall locomotor activity and nocifensive behaviors. Group-averaged distance travelled is plotted to compare movement across timepoints. q. Comparison of distance travelled during the stim period (left) between unstimulated and optogenetically-stimulated groups. Following optogenetic stimulation, the noxious temperature range of the thermal ramp was analyzed for comparison of distance travelled (left) and total nocifensive behaviors (right).

References

    1. Kimmey B. A., McCall N. M., Wooldridge L. M., Satterthwaite T. D. & Corder G. Engaging endogenous opioid circuits in pain affective processes. J Neurosci Res 100, 66–98 (2022). - PMC - PubMed
    1. Bagley E. E. & Ingram S. L. Endogenous opioid peptides in the descending pain modulatory circuit. Neuropharmacology 173, 108131 (2020). - PMC - PubMed
    1. Corder G., Castro D. C., Bruchas M. R. & Scherrer G. Endogenous and Exogenous Opioids in Pain. Annu Rev Neurosci 41, 453–473 (2018). - PMC - PubMed
    1. Carrive P. & Morgan M. M. Periaqueductal Gray. The Human Nervous System: Second Edition 393–423 (2004) doi: 10.1016/B978-012547626-3/50013-2. - DOI
    1. Linnman C., Moulton E. A., Barmettler G., Becerra L. & Borsook D. Neuroimaging of the periaqueductal gray: state of the field. Neuroimage 60, 505–22 (2012). - PMC - PubMed

Publication types