[Preprint]. 2025 May 23:2024.12.29.630675.
doi: 10.1101/2024.12.29.630675.

Organ injury accelerates stem cell differentiation by modulating a fate-transducing lateral inhibition circuit

Affiliations

Organ injury accelerates stem cell differentiation by modulating a fate-transducing lateral inhibition circuit

Erin N Sanders et al. bioRxiv. .

Abstract

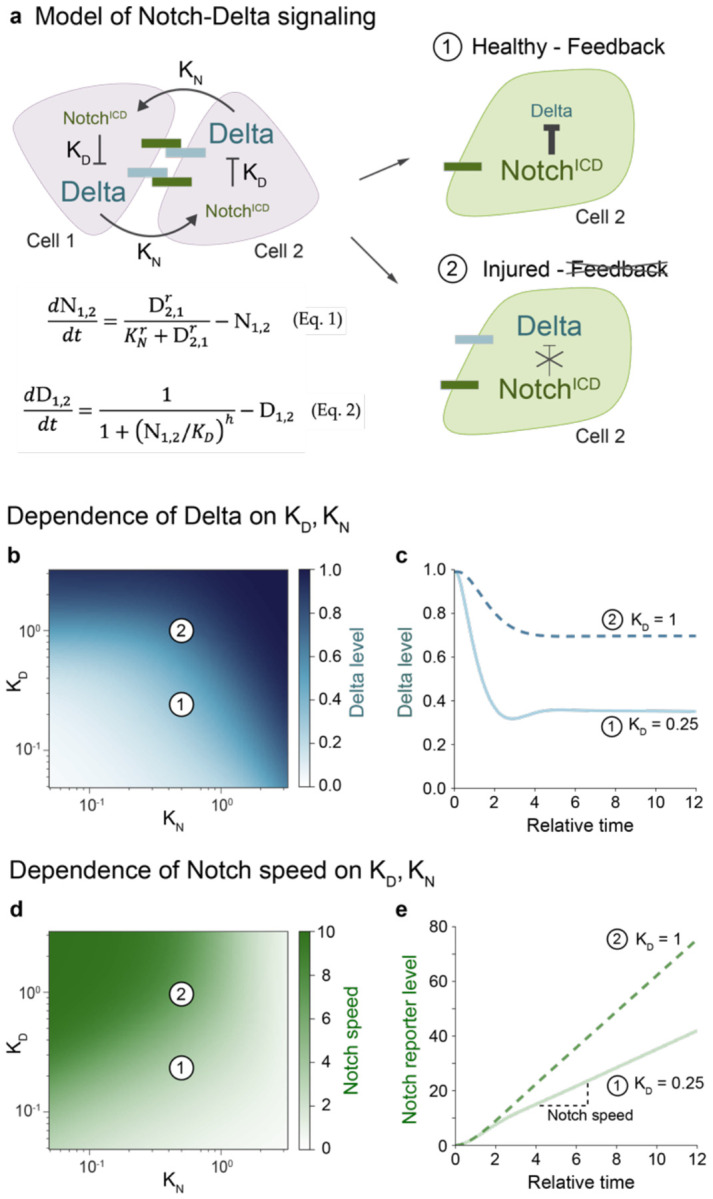
To rebuild tissue form and function, injured organs accelerate the differentiation of replacement stem cell progeny. Here we demonstrate that injury-induced factors open the throttle on faster differentiation by streamlining the archetypal signaling circuit that patterns cell fates. During normal turnover of the adult Drosophila intestine, fates are patterned by a conserved lateral inhibition circuit: In stem cell pairs, mutual activation of Notch receptor by Delta ligand feeds back to create opposing states of high Notch/low Delta and low Notch/high Delta; cells terminally differentiate once their Notch activity exceeds a fate-deciding threshold. After feeding flies a gut-damaging toxin, we perform in vivo imaging of real-time intestinal repair and trace Notch reporter dynamics in single cells. We find that tissue damage causes the speed of Notch signal activation to accelerate dramatically; faster activation expedites terminal differentiation by propelling cells past the critical Notch threshold more quickly. Combining single-cell analyses with dynamical modeling, we show that faster activation results from aberrant elevation of Delta ligand due to loss of time-delaying circuit feedback. Injury abolishes feedback via a cytokine-JAK-STAT relay from damaged cells to stem cells, causing stem cells to deactivate the Notch co-repressor that normally turns off Delta. Thus, organ injury unmasks latent plasticity in Notch-Delta lateral inhibition to propel the differentiation of new replacement cells. By unifying temporal and spatial fate control in a single, adaptable signaling circuit, organs tune stem cell dynamics to meet environmental challenges.


Figures

Figure 1:
Figure 1:. Notch-Delta signaling in the Drosophila adult midgut.
(a) Two-cell lateral inhibition through Notch-Delta signaling. Initially, both cells express Notch receptor (dark green) and Delta ligand (blue). Stochastic differences in the two cells’ signaling levels become amplified through a feedback circuit in which Notch-Delta trans-activation and release of the Notch intracellular domain (NotchICD) causes Delta to be downregulated (Fig S1a). Over time, this circuit resolves into opposing cell states of high Notch, low Delta and low Notch, high Delta. (b) Notch-Delta fate specification in the absorptive lineage. New mitotic stem cell daughters (pink) engage in mutual Notch-Delta signaling. Cell fate is determined by Notch activity: daughters that remain at sub-threshold Notch activity remain stem cells, while those that exceed the threshold differentiate into enteroblasts (early: light green; late: dark green). Enteroblasts progressively mature into terminal enterocytes (gray). The immature progenitor population (stem cells and enteroblasts) is marked by escargot (esg). (c) Tissue organization of Notch-Delta signaling. Small progenitor cells (esg>his2b::CFP, magenta) are interspersed among large enterocytes (outlined by ubi-E-cad::YFP, grayscale). Notch activity is visualized using the NRE-GFP::nls reporter (green; Fig S1b). Progenitors frequently form pairs of one GFP+ and one GFP cell (arrowheads). Both GFP+ and GFP cells are esg+, although GFP+ cells appear light green in the overlay. Scale bar, 10μm. (c’) Single-channel views of a representative cell pair (white box in c) demonstrate esg expression in GFP+ and GFP cells. Scale bars, 10μm.
Figure 2:
Figure 2:. Injury disrupts Notch-Delta lateral inhibition feedback to generate Delta-expressing enteroblasts.
(a-c) Notch signaling (NRE-GFP::nls) in progenitors (esg>his2b::CFP) from (a) healthy and (b) bleomycin-injured guts. Both conditions show bimodal NRElow and NREhi populations (solid lines: Gaussian mixture model (GMM) fits; dashed lines: classification thresholds). (c) Overlay shows injury increases the proportion of NREhi cells while maintaining GFP intensity ranges and thresholds. Healthy: n=5681 cells, N=6 guts from a single experiment. Injury: n=8819 cells, N=6 guts from a single experiment. (d-f) NRE-GFP::nls in mitotic (PH3+) cells shown as raincloud plots (top) and single-cell measurements (bottom) from (d) healthy and (e) injured guts. Dashed lines show classification thresholds from panels a-b. In both conditions, PH3+ cells match the NRElow peak distribution and classification (healthy: 98% NRElow; injured, 93% NRElow). (f) Overlay. Healthy: n=60 cells, N=27 guts, 7 independent replicates. Injury: n=83 cells, N=8 guts, 2 independent replicates. (As previously reported, injury sharply increases numbers of PH3+ cells per gut.,,,,,-) (g-h) Co-visualization of Notch signaling (NRE-GFP::nls, green) and Delta immunostain (blue) in esg>his2b::CFP progenitors (magenta). (g) In healthy guts, Delta+ cells typically lack GFP and pair with Delta, GFP+ cells. (h) In injured guts, many Delta+ cells show bright GFP and often form clusters with other Delta+, GFP+ as well as Delta+, GFP cells. Boxed regions shown at higher magnification with split channels. Arrows indicate Delta+, GFP+ cells; empty arrowheads indicate Delta+, GFP cells; filled arrowheads indicate Delta, GFP+ cells. Scale bars, 10μm. (i-k) Quantification of Delta and Notch signaling relationships. Notch signaling (NRE-GFP::nls) specifically in Delta+ cells from (i) healthy and (j) injured guts, as a proportion of all esg+ cells. Solid lines: GMM fits for all esg+ population. NRE-GFP::nls raw values and classification thresholds (dashed lines) differ from panels a-c due to use of a different imaging system (see Methods). Overlay of Delta+ cells from (i) healthy and (j) injured guts as a proportion of Delta+ cells only. Injury shifts Delta+ cells from predominantly NRElow (84%) to predominantly NREhi (62%) (p<0.0001). Healthy: n=478 esg+ cells, n=208 Delta+ cells; N=2 guts from a single experiment. Injured: n=823 esg+ cells, n=631 Delta+ cells; N=3 guts from a single experiment. p-value, two-sample K-S test. (l) Summary: Injury-induced disruption of Notch-Delta feedback to produce Delta-expressing enteroblasts. In healthy guts, mitotic stem cells (sc) express Delta and maintain low Notch activity, while Notch-Delta feedback drives differentiating enteroblasts (ebs) to the opposing state of high Notch activity and no Delta. In injury, differentiating enteroblasts maintain Delta despite acquiring high Notch. Gray shading indicates percent of signaling progenitors in each Notch/Delta state; green curves show GMM NRE-GFP::nls distributions (Fig 2a-c).
Figure 3:
Figure 3:. Disrupted Notch-Delta feedback can accelerate Notch signaling.
(a) Model schematic for Notch-Delta lateral inhibition., Two key parameters govern the system: KN (the threshold for Notch activation by Delta) and KD (the threshold for Delta inhibition by Notch). Cell 2 is initialized with slightly higher Notch activity. Outcomes 1 (high-Notch/low-Delta) and 2 (high-Notch/high-Delta) represent the dominant enteroblast states in healthy and injured guts, respectively. Equations 1-2 describe the time evolution of Notch activity and Delta levels. Hill coefficients r=h=2. (b-e) Model parameter space and dynamics. Parameter values for Point 1 (KN=0.5, KD=0.25); Point 2 (KN=0.5, KD=1). (b) Steady-state Delta level (t=10) as a function of KN and KD. While injury decreases KN and increases KD (see Results), only increased KD reproduces the high-Notch/high-Delta injury state. (c) Simulated time evolution of Delta levels for Points 1 and 2. See Fig. S4a for additional KD values. (d) Notch signaling speed as a function of KN and KD. Signaling speed is defined as the mean rate of Notch reporter accumulation from t=4 to t=10. Increased KD accelerates signaling speed. (e) Simulated time evolution of Notch reporter levels for Points 1 and 2. See Fig. S4b for additional KD values.
Figure 4:
Figure 4:. Real-time in vivo imaging reveals acceleration of Notch signaling dynamics in differentiating cells during injury.
(a) Windowmount setup for long-term imaging of actively feeding flies. A window cut in the dorsal cuticle enables the intact gut to be imaged in a near-native context for >20 hours. Flies receive nutrients and bleomycin (for injury condition) through a microcapillary feeder tube. (b) Design of the NRE>TransTimer dual-color kinetic reporter. NRE-GAL4 (Notch Response Element: c.f. Fig S1b) drives expression of UAS-TransTimer: a bicistronic cassette that encodes fast-folding, destabilized dGFP and slow-folding, stable RFP, separated by P2A. (c) Experimental timeline. Prior to imaging, flies are fed standard fly food either with or without 25 μg/mL bleomycin in yeast paste. During imaging, flies are fed 10% sucrose with or without 25 μg/mL bleomycin. (d-e) Wide-field, volumetric live imaging of NRE>TransTimer guts in (d) healthy and (e) injured conditions. Images are stack projections of single timepoints from 20.5-hour Windowmount movies. Dotted lines indicate gut boundaries. Individual NRE>TransTimer cells exhibit specific dGFP/RFP ratios that indicate distinct stages of differentiation. Numbered boxes mark Cells 1-4 analyzed in Panels f-i. Scale bars: 50 μm. See Movies 1 and 2. (f-i) Real-time dynamics of NRE>TransTimer in single differentiating cells. Images are zoomed-in stack projections showing single- and two-channel views of Cells 1-4 at the timepoints indicated. Corresponding traces show movie-normalized dGFP and RFP intensities over time (see Methods). In healthy-gut Movie 1, Cells 1-3 each exhibit a distinct phase of differentiation: NRE upregulation, sustained signaling, or downregulation. In injured-gut Movie 2, Cell 4 progresses through all phases within the same 20.5-hour imaging period. Scale bars: 5 μm. See Movies 3-6. (j) Injury accelerates the differentiation-associated Notch signaling program. During 20.5-hour movies, cells exhibiting both up- and downregulation of NRE>TransTimer are 2.2.-fold more abundant in injured guts than healthy guts (57% versus 25%, respectively). Data from N=2 healthy-gut movies (n=8/32 total cells) and N=3 injured-gut movies (n=53/93 total cells). (k-l) Injury increases real-time rates of single-cell Notch signaling. Each dot shows rate of dGFP intensity change during phases of (k) NRE>TransTimer upregulation and (l) downregulation. Medians: upregulation (injured: 0.034, healthy: 0.019), downregulation (injured: 0.021, healthy: 0.014). Data from N=2 healthy-gut movies (n=13 upregulating, 28 downregulating cells) and N=3 injured-gut movies (n=58 upregulating, 92 downregulating cells). Box plots show medians and quartiles. p-values from Mann-Whitney test.
Figure 5:
Figure 5:. Gro inactivation attenuates Notch-Delta feedback in injury.
(a) Co-visualization of Notch signaling (NRE-GFP::nls, green) and Delta immunostain (blue) in progenitor cells (esgts>his2b::CFP, magenta) from healthy control guts, uninjured guts with groRNAi (esgts>his2b::CFP, groRNAi), and injured control guts. Two RNAi constructs were used: groRNAi #1 – VDRC #KK110546; groRNAi #2 – BDSC #91407. In healthy control guts, cells express either GFP or Delta but rarely both. Knockdown of gro in uninjured guts causes cells to express both markers, mimicking the injury state. Boxed regions shown at higher magnification with split channels. Arrows indicate Delta+, GFP+ cells; empty arrowheads indicate Delta+, GFP cells; filled arrowheads indicate Delta, GFP+ cells. Scale bars, 10μm. (b) Notch signaling distributions (NRE-GFP::nls) of Delta+ progenitors from the same genotypes and conditions in panel a. In otherwise uninjured guts, esgts>groRNAi increases the proportion of NREhi cells (groRNAi #1 - 32%, #2 - 51%) compared to healthy controls (11%), reaching levels similar to injured controls (46%). Healthy control: n=1328 cells; N=7 guts. Injured control: n=2251 cells; N=6 guts. Uninjured groRNAi #1: n=4766 cells; N=14 guts. Uninjured groRNAi #2: n=6945 cells; N=14 guts. Samples are from 3 independent experiments. p-values from two-sample K-S test. See also Figures S2c, S5b. (c) Co-visualization of NRE-GFP::nls (green) and Delta immunostain (blue) in groWT-expressing progenitor cells from injured guts (esgts>his2b::CFP, UAS-groWT, magenta). Although some progenitors express Delta and not GFP, or GFP and not Delta, many still co-express these two markers. Arrows indicate Delta+, GFP+ cells; empty arrowheads indicate Delta+, GFP cells; filled arrowheads indicate Delta, GFP+ cells. Scale bars: 10 μm. (d) NRE-GFP::nls distributions of Delta+ progenitors from healthy control guts, injured control guts, and injured esgts>groWT guts. In injured esgts>groWT guts, the proportion of NREhi cells remains elevated (58% - injured groWT, 62% - injured control) compared to healthy controls (15%). Healthy control: n=821 cells; N=7 guts. Injured control: n=2814 cells; N=5 guts. Injured groWT: n=738 cells; N = 11 guts. Samples are from 3 independent experiments. p-values from two-sample K-S test. See also Figures S2d, S5c. (e) Co-visualization of NRE-GFP::nls (green) and Delta immunostain (blue) in injured-gut progenitor cells expressing constitutively active GroAA (esgts>his2b::CFP, UAS-groAA, magenta). Many progenitors exhibit either only GFP or only Delta, akin to healthy controls. Few cells still co-express Delta and GFP. Arrows indicate Delta+, GFP+ cells; empty arrowheads indicate Delta+, GFP cells; filled arrowheads indicate Delta, GFP+ cells. Scale bars: 10 μm. (f) NRE-GFP::nls distributions of Delta+ progenitors from healthy control guts, injured control guts, and injured esgts>groAA guts. In injured guts, GroAA reduces the proportion of NREhi cells (27% - injured groAA; 55% - injured control), approaching that of healthy controls (19%). Healthy control: n=1083 cells; N=5 guts. Injured control: n=2581 cells; N=5 guts. Injured groAA: n=2119 cells; N=11 guts. Samples are from 3 independent experiments. p-values from two-sample K-S test. See also Figures S2e, S5d. (g) Schematic of Gro function in healthy versus injury-disrupted lateral inhibition. In the absence of Notch activation (Notch OFF), Gro associates with Su(H) and H at Su(H) binding elements to repress Notch target genes including the E(spl)-C., Upon Notch activation (Notch ON), NotchICD displaces Gro and H, binding Su(H) to drive E(spl)-C expression. In healthy guts, released Gro then partners with Notch-induced E(spl)-C factors to repress Delta. In injured guts, by contrast, phospho-inactivation of Gro precludes its association with E(spl)-C factors, allowing sustained Delta expression in Notch-activated cells.
Figure 6.
Figure 6.. Loss of Notch-Delta feedback occurs through injury-induced activation of Domeless-JAK-STAT.
(a) Co-visualization of NRE-GFP::nls (green) and Delta immunostain (blue) in progenitor cells (esgts>his2b::CFP, magenta) from healthy control guts, injured guts with domeDN (esgts>his2b::CFP, domeDN), uninjured guts with the activated JAK allele hopTuml (esgts>his2b::CFP, hopTuml), and injured control guts. domeDN progenitors in injured guts often express either GFP or Delta but not both, similar to healthy control guts. By contrast, hopTuml progenitors in otherwise uninjured guts frequently express both GFP and Delta, akin to injured control guts. Arrows indicate Delta+, GFP+ cells; empty arrowheads indicate Delta+, GFP cells; filled arrowheads indicate Delta, GFP+ cells. Scale bars: 10 μm. (b) Notch signaling distributions (NRE-GFP::nls) of Delta+ progenitors from the same genotypes and conditions in panel a. In injured, esgts>domeDN guts, the proportion of NREhi cells is reduced compared to injured controls (injured domeDN – 14%, injured controls - 54%), approaching that of healthy controls (11%). In otherwise uninjured, esgts>hopTuml guts, the proportion of NREhi cells increased relative to healthy controls (uninjured hopTuml – 20%, healthy controls – 11%), remaining below injured controls (54%). Healthy control: n=3103 cells; N=19 guts. Injured control: n=6690 cells; N=14 guts. Injured domeDN: n=1648 cells; N=11 guts. Uninjured hopTuml: n=2121 cells; N=11 guts. Samples are from 3 independent experiments. p-values from two-sample K-S test. See also Figures S2f, S5e.
Figure 7:
Figure 7:. Notch-Delta fate signaling during healthy organ turnover and injury-induced regeneration.

References

    1. Biteau B. & Jasper H. EGF signaling regulates the proliferation of intestinal stem cells in Drosophila. Development 138, 1045–1055 (2011). - PMC - PubMed
    1. Zhou F., Rasmussen A., Lee S. & Agaisse H. The UPD3 cytokine couples environmental challenge and intestinal stem cell division through modulation of JAK/STAT signaling in the stem cell microenvironment. Developmental Biology 373, 383–393 (2013). - PMC - PubMed
    1. Tian A. et al. Intestinal stem cell overproliferation resulting from inactivation of the APC tumor suppressor requires the transcription cofactors Earthbound and Erect wing. PLoS Genetics 13, e1006870 (2017). - PMC - PubMed
    1. O’Brien L. E. Tissue Homeostasis and Non-Homeostasis: From Cell Life Cycles to Organ States. Annu. Rev. Cell Dev. Biol. 38, 395–418 (2022). - PMC - PubMed
    1. Rock J. R. et al. Notch-dependent differentiation of adult airway basal stem cells. Cell Stem Cell 8, 639–648 (2011). - PMC - PubMed

Publication types

LinkOut - more resources