. 2024 Jul 17:9:100085.
doi: 10.1016/j.jmccpl.2024.100085. eCollection 2024 Sep.

Cardiac-targeted delivery of a novel Drp1 inhibitor for acute cardioprotection

Affiliations

Cardiac-targeted delivery of a novel Drp1 inhibitor for acute cardioprotection

Jarmon G Lees et al. J Mol Cell Cardiol Plus. .

Abstract

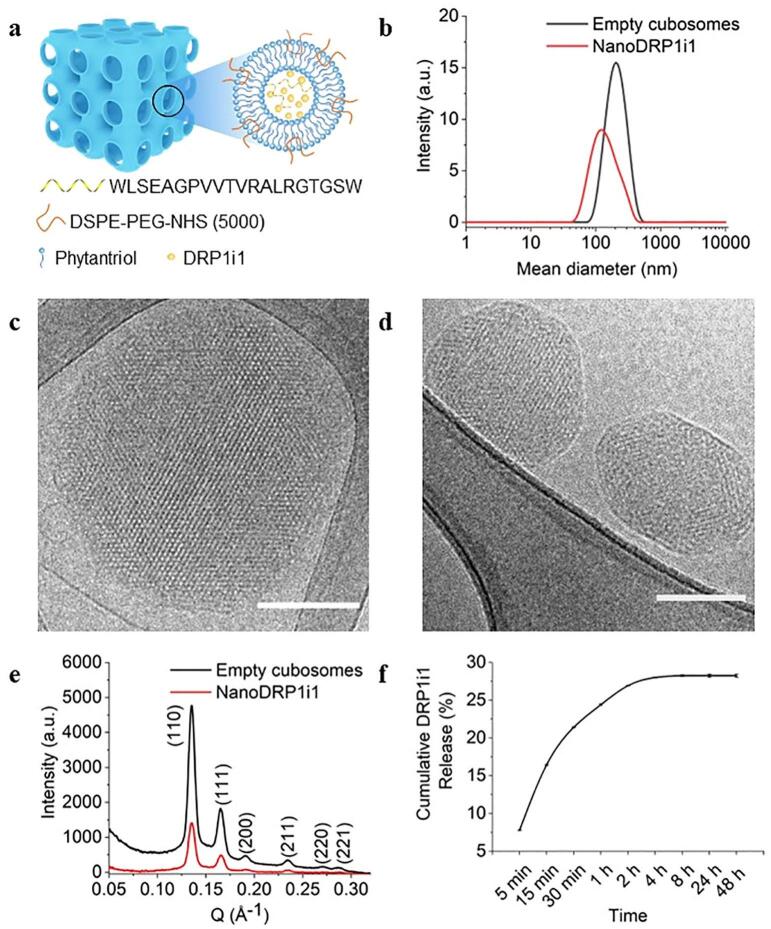
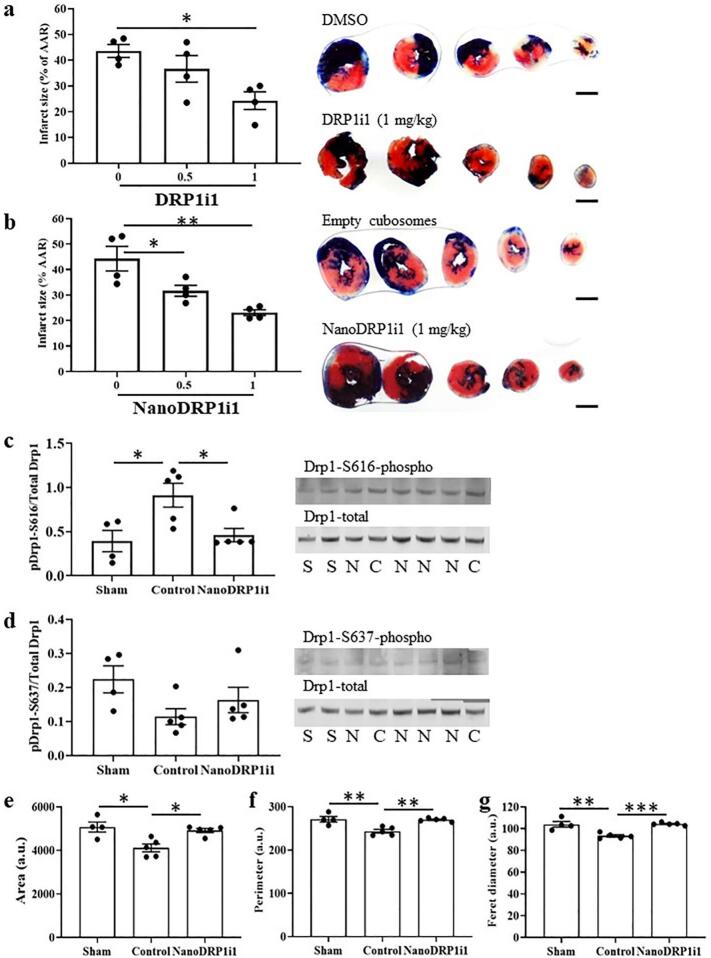
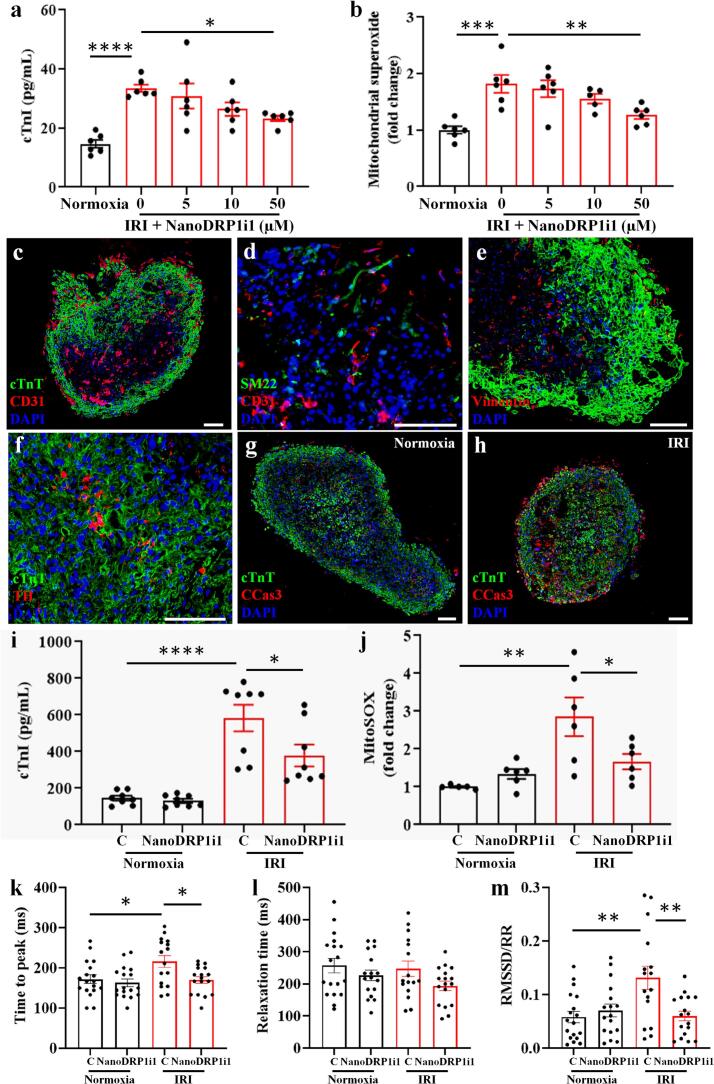
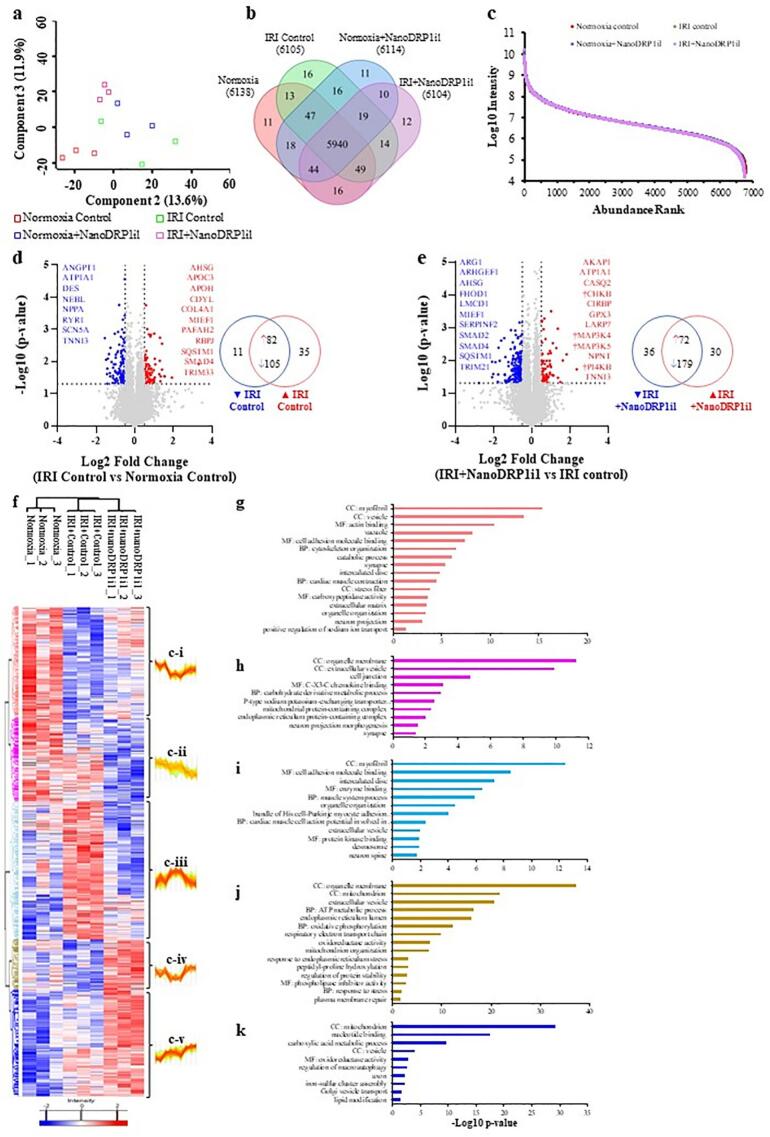
Dynamin-related protein 1 (Drp1) is a mitochondrial fission protein and a viable target for cardioprotection against myocardial ischaemia-reperfusion injury. Here, we reported a novel Drp1 inhibitor (DRP1i1), delivered using a cardiac-targeted nanoparticle drug delivery system, as a more effective approach for achieving acute cardioprotection. DRP1i1 was encapsulated in cubosome nanoparticles with conjugated cardiac-homing peptides (NanoDRP1i1) and the encapsulation efficiency was 99.3 ± 0.1 %. In vivo, following acute myocardial ischaemia-reperfusion injury in mice, NanoDRP1i1 significantly reduced infarct size and serine-616 phosphorylation of Drp1, and restored cardiomyocyte mitochondrial size to that of sham group. Imaging by mass spectrometry revealed higher accumulation of DRP1i1 in the heart tissue when delivered as NanoDRP1i1. In human cardiac organoids subjected to simulated ischaemia-reperfusion injury, treatment with NanoDRP1i1 at reperfusion significantly reduced cardiac cell death, contractile dysfunction, and mitochondrial superoxide levels. Following NanoDRP1i1 treatment, cardiac organoid proteomics further confirmed reprogramming of contractile dysfunction markers and enrichment of the mitochondrial protein network, cytoskeletal and metabolic regulation networks when compared to the simulated injury group. These proteins included known cardioprotective regulators identified in human organoids and in vivo murine studies following ischaemia-reperfusion injury. DRP1i1 is a promising tool compound to study Drp1-mediated mitochondrial fission and exhibits promising therapeutic potential for acute cardioprotection, especially when delivered using the cardiac-targeted cubosome nanoparticles.

Keywords: Cardiac organoids; Cubosome; Dynamin-related protein 1; Mitochondria; Myocardial ischaemia-reperfusion injury.


Conflict of interest statement

The authors declare that they have no known competing financial interests or personal relationships that could have appeared to influence the work reported in this paper.

Figures

Unlabelled Image
Graphical abstract
Fig. 1
Fig. 1
Characteristics of NanoDRP1i1. (a) Schematic representation of NanoDRP1i1. (b) Dynamic light scattering profiles of empty cubosomes and NanoDRP1i1. (c-d) Cryogenic transmission electron microscopy of empty cubosomes (c) and NanoDRP1i1 (d). Scale bar = 100 nm. (e) Small angle X-ray scattering profiles of empty cubosomes (black curve) and NanoDRP1i1 (red curve). (f) DRP1i1 release profile from NanoDRP1i1 obtained by ultraviolet/visible spectrophotometry at λ = 270 nm (n = 3 independent experiments). Data are shown as mean ± SEM. a.u. (arbitrary unit). (For interpretation of the references to colour in this figure legend, the reader is referred to the web version of this article.)
Fig. 2
Fig. 2
Acute cardioprotective effect of NanoDRP1i1 in mice subjected to 30 min of myocardial ischaemia and 2 h of reperfusion. (a-b) Infarct size, expressed as a percentage of the area at risk (AAR), in hearts administered DRP1i1 (a) or NanoDRP1i1 (b) at the time of myocardial reperfusion (n = 4 biological replicates). Scale bar = 2 mm. (c-d) Cardiac total and phosphorylated (Ser-616 (c) and Ser-637 (d)) Drp1 levels in mice subjected to sham surgery (S) or acute myocardial IRI and treated with empty cubosomes (control, C) or NanoDRP1i1 (1 mg/kg, N) at the time of myocardial reperfusion (n = 4–5 biological replicates). The size (e), perimeter (f) and ferret's diameter (g) of cardiomyocyte intermyofibrillar mitochondria in the left ventricular myocardium of mice subjected to sham surgery or acute myocardial IRI and treated with empty cubosomes (control) or NanoDRP1i1 (1 mg/kg) at the time of myocardial reperfusion (n = 4–5 biological replicates). Data are shown as mean ± SEM. *p < 0.05, **p < 0.01, ***p < 0.001 by one-way ANOVA with Bonferroni post-hoc test.
Fig. 3
Fig. 3
Mass spectrometry imaging of DRP1i1 distribution in mouse heart. (a) Mass spectrometry molecular ion of DRP1i1 detected at m/z 367, distinguishable from endogenous metabolite ions. (b-c) Concentration curve of DRP1i1 on mouse control tissue sections showing a linear concentration range between 0.25 and 50 pg/calibration spot (equating to 16.67–3333 ng/mg tissue) (n = 3–4 technical replicates). (d) Representative haematoxylin and eosin-stained heart sections of mice administered with empty cubosomes, 1 mg/kg of DRP1i1 encapsulated in cubosomes conjugated with scramble peptides or 1 mg/kg of NanoDRP1i1 intravenously at reperfusion following 30 min of myocardial ischaemia; and the corresponding mass spectrometry images showing the distribution and accumulation of DRP1i1 and heme B. Scale bar = 1000 μm.
Fig. 4
Fig. 4
NanoDRP1i1 protects human cardiac organoids from simulated IRI (60 min of simulated ischaemia and 24 h of simulated reperfusion). (a) Viability of cardiomyocyte organoids assessed by cardiac troponin I released (n = 6 organoids from 2 independent experiments). (b) Mitochondrial superoxide production of cardiomyocyte organoids assessed by MitoSOX Red indicator (n = 5–6 organoids from 2 independent experiments). Cardiomyocyte organoids were subjected to normoxia or simulated IRI conditions and treated with either empty cubosomes or NanoDRP1i1. (c-h) Representative images of multicellular cardiac organoids stained with cardiac troponin T (cTnT, a marker for cardiomyocytes) and CD31 (a marker for endothelial cells) (c), transgelin (SM22, a marker for smooth muscle cells) and CD31 (d), cTnT and Vimentin (a marker for mesenchymal cells and fibroblasts) (e), cTnT and tyrosine hydroxylase (TH, a marker for neurons) (f), and cTnT and cleaved caspase-3 (CCas3, a marker for cell death) (g-h). Scale bar = 100 μm. (i) Viability of multicellular cardiac organoids assessed by cardiac troponin I released (n = 8 organoids from 3 independent experiments). (j) Mitochondrial superoxide production of multicellular cardiac organoids assessed by MitoSOX Red indicator (n = 5–6 organoids from 3 independent experiments). (k-m) The contraction profile of multicellular cardiac organoids; time-to-peak (k), relaxation time (l), and beat rate variability calculated by the root mean square of successive differences normalized by the R-R interval (m) (n = 16–18 organoids from 5 independent experiments). Multicellular cardiac organoids were subjected to normoxia or simulated IRI conditions and treated with either empty cubosomes (C) or 50 μM of NanoDRP1i1. Data are shown as mean ± SEM. *p < 0.05, **p < 0.01, ***p < 0.001, ****p < 0.0001 by one-way ANOVA with Bonferroni post-hoc test. (For interpretation of the references to colour in this figure legend, the reader is referred to the web version of this article.)
Fig. 5
Fig. 5
Global proteome analysis of human cardiac organoids. (a) Principal component analysis of cardiac organoids (n = 3 organoids per group) with valid values of 70 % cutoff in at least one group. Based on the log2 intensity (LFQ) transformed value of all samples. Missing values are replaced by imputation from a normal distribution (downshift 1.8, width 0.3, Perseus). (b) Venn diagram of the number of proteins identified in each group. Use validation values column to determine unique/shared proteins for each group (n = 3 organoids). (c) Protein rank of distribution between each group's log10 intensity abundance (n = 3 organoids). (d) Volcano plot of IRI control versus normoxia control. Blue and red dots represent proteins that are downregulated and upregulated in the IRI group, respectively, with a p-value <0.05 and a log2 fold change <−0.5 (down in IRI group) or > 0.5 (up in IRI group) based on a Student's t-test. The venn diagram indicates unique and shared genes that are significantly upregulated or downregulated in the IRI group (n = 3 organoids). (e) Volcano plot of IRI + NanoDRP1i1 versus IRI control. Blue and red dots represent proteins that are downregulated and upregulated in the IRI + NanoDRP1i1 group, respectively, with a p-value <0.05 and a log2 fold change <−0.5 (down in IRI + NanoDRP1i1 group) or > 0.5 (up in IRI + NanoDRP1i1 group) based on a Student's t-test. The venn diagram indicates unique and shared genes that are significantly upregulated or downregulated in the IRI + NanoDRP1i1 group. † indicates specific kinases that are differentially expressed, unique and upregulated in the IRI + NanoDRP1i1 group compared to the IRI control (n = 3 organoids). (f-k) ANOVA analysis of the proteome of human cardiac organoids from normoxia, IRI and IRI + NanoDRP1i1 groups. (f) Clustered heatmap of z-score normalized proteins (p < 0.05 ANOVA) (n = 3 organoids per group). (g-k) gProfiler GO enrichment of biological process (BP), cell component/localization (CC), and molecular function (MF) (−log10 p values, term size 2–5000) in clusters c-i (g), c-ii (h), c-iii (i), c-iv (j) and c-v (k). (n = 3 organoids). (For interpretation of the references to colour in this figure legend, the reader is referred to the web version of this article.)
Fig. 6
Fig. 6
Phosphoproteomic analysis of human cardiac organoids. (a) Mean number of Phosphosite PTM peptide identifications only in each group (n = 3 organoids). 969 in normoxia, 1197 in normoxia+NanoDRP1i1, 1030 in IRI control, and 984 in IRI + NanoDRP1i1. (b) Violin plot of log2x phosphor-specific data distribution (pre-imputation). (c) Phosphoenrichment ANOVA analysis of cardiac organoids from normoxia, IRI control and IRI + NanoDRP1i1 groups, and gProfiler GO enrichment of biological process (BP), cell component/localization (CC), and molecular function (MF) in clusters p-i, p-ii, and p-iii (−log10 p values, term size 2–5000) (n = 3 organoids).

References

    1. Heidenreich P.A., Bozkurt B., Aguilar D., Allen L.A., Byun J.J., Colvin M.M., et al. 2022 AHA/ACC/HFSA Guideline for the Management of Heart Failure: executive summary: a report of the American College of Cardiology/American Heart Association Joint Committee on Clinical Practice Guidelines. Circulation. 2022;145(18) - PubMed
    1. Hausenloy D.J., Yellon D.M. Targeting myocardial reperfusion injury--the search continues. N Engl J Med. 2015;373(11):1073–1075. - PubMed
    1. Rosdah A.A., J K.H., Delbridge L.M., Dusting G.J., Lim S.Y. Mitochondrial fission - a drug target for cytoprotection or cytodestruction? Pharmacol Res Perspect. 2016;4(3) - PMC - PubMed
    1. Li A., Gao M., Jiang W., Qin Y., Gong G. Mitochondrial dynamics in adult cardiomyocytes and heart diseases. Front Cell Dev Biol. 2020;8 - PMC - PubMed
    1. Hu C., Huang Y., Li L. Drp1-dependent mitochondrial fission plays critical roles in physiological and pathological progresses in mammals. Int J Mol Sci. 2017;18(1):144. - PMC - PubMed

LinkOut - more resources