The immune-related gene CD5 is a prognostic biomarker associated with the tumor microenvironment of breast cancer
- PMID: 39804513
- PMCID: PMC11729608
- DOI: 10.1007/s12672-024-01616-7
The immune-related gene CD5 is a prognostic biomarker associated with the tumor microenvironment of breast cancer
Abstract
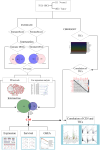
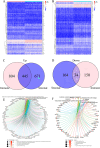
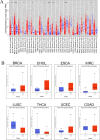
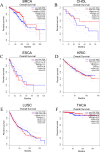
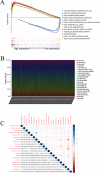
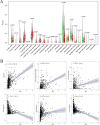
The occurrence and progression of breast cancer (BCa) are complex processes involving multiple factors and multiple steps. The tumor microenvironment (TME) plays an important role in this process, but the functions of immune components and stromal components in the TME require further elucidation. In this study, we obtained the RNA-seq data of 1086 patients from The Cancer Genome Atlas (TCGA) database. We calculated the proportions of tumor-infiltrating immune cells (TICs) and immune and stromal components using the CIBERSORT and ESTIMATE methods, and we screened differentially expressed genes (DEGs). Univariate Cox regression analysis of overall survival was performed on the DEGs, and a protein-protein interaction network of their protein products was generated. Finally, the hub gene CD5 was obtained. High CD5 expression was found to be associated with longer survival than low expression. Gene set enrichment analysis showed that DEGs upregulated in the high-CD5 expression group were mainly enriched in tumor- and immune-related pathways, while those upregulated in the low-expression group were enriched in protein export and lipid synthesis. TIC analysis showed that CD5 expression was positively correlated with the infiltration of CD8+ T cells, activated memory CD4+ T cells, gamma delta T cells, and M1 macrophages and negatively correlated with the infiltration of M2 macrophages. CD5 can increase anticancer immune cell infiltration and reduce M2 macrophage infiltration. These results suggest that CD5 is likely a potential prognostic biomarker and therapeutic target, providing novel insights into the treatment and prognostic assessment of BCa.
Keywords: Breast cancer; CD5; Tumor immune infiltrates; Tumor microenvironment.
© 2024. The Author(s).
Conflict of interest statement
Declarations. Ethics approval and consent to participate: Not applicable. Competing interests: The authors declare no competing interests.
Figures




Similar articles
-
CD52 Is a Prognostic Biomarker and Associated With Tumor Microenvironment in Breast Cancer.Front Genet. 2020 Nov 2;11:578002. doi: 10.3389/fgene.2020.578002. eCollection 2020. Front Genet. 2020. PMID: 33240323 Free PMC article.
-
[CD40LG is a novel immune- and stroma-related prognostic biomarker in the tumor microenvironment of invasive breast cancer].Nan Fang Yi Ke Da Xue Xue Bao. 2022 Sep 20;42(9):1267-1278. doi: 10.12122/j.issn.1673-4254.2022.09.01. Nan Fang Yi Ke Da Xue Xue Bao. 2022. PMID: 36210698 Free PMC article. Chinese.
-
A Novel Immune and Stroma Related Prognostic Marker for Invasive Breast Cancer in Tumor Microenvironment: A TCGA Based Study.Front Endocrinol (Lausanne). 2021 Nov 18;12:774244. doi: 10.3389/fendo.2021.774244. eCollection 2021. Front Endocrinol (Lausanne). 2021. PMID: 34867821 Free PMC article.
-
IRF7 as an Immune-Related Prognostic Biomarker and Associated with Tumor Microenvironment in Low-Grade Glioma.Int J Gen Med. 2021 Aug 12;14:4381-4393. doi: 10.2147/IJGM.S324307. eCollection 2021. Int J Gen Med. 2021. PMID: 34413671 Free PMC article.
-
Identify potential prognostic indicators and tumor-infiltrating immune cells in pancreatic adenocarcinoma.Biosci Rep. 2022 Feb 25;42(2):BSR20212523. doi: 10.1042/BSR20212523. Biosci Rep. 2022. PMID: 35083488 Free PMC article. Review.
References
-
- Siegel RL, Miller KD, Jemal A. Cancer statistics, 2020. CA Cancer J Clin. 2020;70(1):7–30. - PubMed
-
- Li X, Wenes M, Romero P, Huang SC, Fendt SM, Ho PC. Navigating metabolic pathways to enhance antitumour immunity and immunotherapy. Nat Rev Clin Oncol. 2019;16(7):425–41. - PubMed
-
- Bertucci F, Gonçalves A. Immunotherapy in breast cancer: the emerging role of PD-1 and PD-L1. Curr Oncol Rep. 2017;19(10):64. - PubMed
LinkOut - more resources
Full Text Sources
Research Materials
