. 2025 Jan 13;21(1):e1011451.
doi: 10.1371/journal.pgen.1011451. eCollection 2025 Jan.

Identification of novel genes responsible for a pollen killer present in local natural populations of Arabidopsis thaliana

Affiliations

Identification of novel genes responsible for a pollen killer present in local natural populations of Arabidopsis thaliana

Anthony Ricou et al. PLoS Genet. .

Abstract

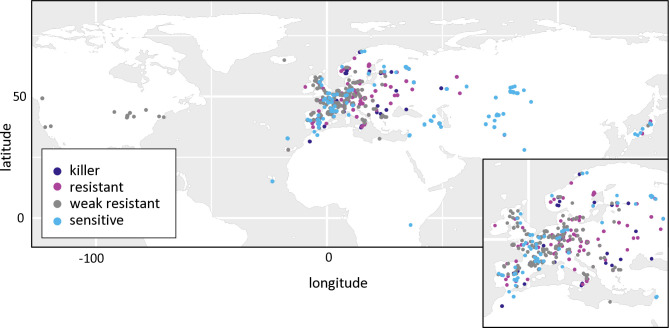
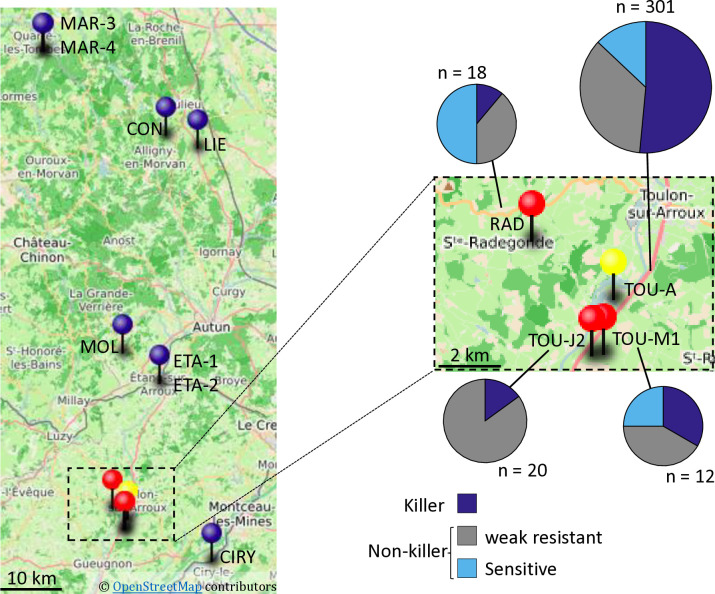
Gamete killers are genetic loci that distort segregation in the progeny of hybrids because the killer allele promotes the elimination of the gametes that carry the sensitive allele. They are widely distributed in eukaryotes and are important for understanding genome evolution and speciation. We had previously identified a pollen killer in hybrids between two distant natural accessions of Arabidopsis thaliana. This pollen killer involves three genetically linked genes, and we previously reported the identification of the gene encoding the antidote that protects pollen grains from the killer activity. In this study, we identified the two other genes of the pollen killer by using CRISPR-Cas9 induced mutants. These two genes are necessary for the killer activity that we demonstrated to be specific to pollen. The cellular localization of the pollen killer encoded proteins suggests that the pollen killer activity involves the mitochondria. Sequence analyses reveal predicted domains from the same families in the killer proteins. In addition, the C-terminal half of one of the killer proteins is identical to the antidote, and one amino acid, crucial for the antidote activity, is also essential for the killer function. Investigating more than 700 worldwide accessions of A. thaliana, we confirmed that the locus is subject to important structural rearrangements and copy number variation. By exploiting available de novo genomic sequences, we propose a scenario for the emergence of this pollen killer in A. thaliana. Furthermore, we report the co-occurrence and behavior of killer and sensitive genotypes in several local populations, a prerequisite for studying gamete killer evolution in the wild. This highlights the potential of the Arabidopsis model not only for functional studies of gamete killers but also for investigating their evolutionary trajectories at complementary geographical scales.


Conflict of interest statement

The authors have declared that no competing interests exist.

Figures

Fig 1
Fig 1. Schematic representation of the PK3 locus in diverse A. thaliana accessions (from [50]).
Names of killer and non-killer accessions are written in red and in black, respectively. Dashed lines indicate the limits in Sha and Mr-0 of the genetically determined PK3A, PK3B and PK3C intervals. In the killer alleles, PK3A and PK3C each contain at least one element required for the killer activity. In PK3B, APOK3 is the antidote gene, whose sequence differs between sensitive and resistant accessions. PK3 alleles are drawn to highlight synteny between protein coding genes, they are not to scale and TEs are not represented. Plain colored arrows represent coding genes with their orientations, each color refers to orthologs and paralogs of a same gene. Sequences homologous to APOK3 are in yellow. Genes studied in this work are framed in red on the Mr-0 allele. Gene labels correspond to the last three digits of AT3G62xxx gene identifiers in Col-0 (TAIR10).
Fig 2
Fig 2. Identification of the PK3 killer genes.
A & B. Structure of the candidate killer genes. Boxes represent coding sequences, lines represent introns and UTRs. Red and blue arrows indicate target sites of CrispR-Cas9 mutagenesis. The coding sequences of the mutants are given below the genes, with the predicted protein sequences. Modified residues are in red, deletions are indicated by dots, inserted nucleotides are in bold. A. Structure of KPOK3A (AT3G62460) Mr-0 gene. Indels that differentiate the Sha KPOK3A allele are represented above the gene. The mutants 460#1 and 460#2 have respectively a G deletion and a T insertion at 353 bp from the ATG, leading to proteins modified from amino acid 118 and stopped prematurely after 127 (for 460#1) and 151 (for 460#2) amino acids. B. Structure of APOK3-like (KPOK3C) Mr-0 gene. The part of the gene identical to the antidote gene APOK3 is in yellow. Purple stars indicate the positions of the S, D, and R residues specific for the functional form of the antidote. The mutant apok3-like#1, mutated in the region specific for KPOK3C, has a 2-bp (CC) deletion at 408 bp from the ATG, leading to a protein stopped after 135 amino acids. The mutants apok3-like#2 and kpok3c#3 are mutated in the region of KPOK3C that is identical to APOK3. apok3-like#2 has a 2-bp (GC) deletion at 858 bp from the ATG, leading to a protein modified from amino acid 263 and stopped after 286 amino acids. kpok3c#3 has a 3-bp deletion that does not result in a frameshift. The Mr-0 wild-type KPOK3C is shown at the bottom, the R263 residue, corresponding to the R105 residue of the functional form of the antidote, is in purple and bold. C. Percentages of plants homozygous for the Sha allele at the PK3 locus in selfed progenies of crosses between Sha and KO mutants of AT3G62460 (left panel) or of APOK3-like (KPOK3C) (right panel). Control: wild-type F1 sibling. The percentage expected in the absence of segregation distortion (25%) is indicated by a dotted line on each panel. n: number of F2 plants genotyped for each cross. *** p < 0.001; NS, not significant. Complete data are shown in S1 and S2 Tables.
Fig 3
Fig 3. Expression of KPOK3A and KPOK3C and complementation of incomplete killer alleles.
A. Simplified representation of Sha, Mr-0 and the recombinant alleles Rec4 and Rec5. Mr-0 alleles are drawn in red and Sha alleles in black. In contrast with the heterozygote Mr-0/Sha, there is no bias in the selfed progenies of the heterozygotes Rec4/Sha or Rec5/Sha, because Rec4 and Rec5 lack the Mr-0 allele of KPOK3A and KPOK3C, respectively. B. Expression of KPOK3A. KPOK3A PCR amplification of cDNA from buds of plants with different allelic forms of the gene (Mr-0 like, in red, or not, in black). cDNAs were synthetized from 0.2 μg of total RNA; 30 PCR cycles. The primers used were defined on sequences that were invariant between the genotypes tested. TUB4 (AT5G44340) was used as control. gDNA: Mr-0 genomic DNA. L: GeneRuler 50 bp DNA Ladder (Thermo Scientific). C. Expression of KPOK3C. KPOK3C PCR amplification of cDNA from buds of different killer accessions. cDNAs were synthetized from 1 μg of total RNA; 28 PCR cycles for TUB4 and 32 PCR cycles for KPOK3C. TOU-A: TOU-A1-111; TOU-M: TOU-M1-3. D. Sequences of the 90 bp upstream of the ATG of KPOK3A in Sha and Col-0, and in Mr-0 and Bur-0. The putative TATA box is written in red. E. Pollen viability (Alexander coloration of anthers, viable pollen is colored in red and dead pollen appears blue) of plants Rec4xSha (a) and Rec4xSha transformed with the KPOK3A Mr-0 allele (b). Scale bars: 200μM. F. Percentages of plants homozygous for the Sha allele at the PK3 locus in selfed progenies of Rec4 x Sha plants transformed with the KPOK3A Mr-0 allele. The percentage expected in the absence of segregation distortion (25%) is indicated by a dotted line. n: number of F2 plants genotyped for each cross. *** p < 0.001; ** p < 0.01; NS, not significant. Complete data are shown in S3 Table. G. KPOK3C PCR amplification of cDNA from buds (as in C) of three independent T1 (Rec5 x Sha) plants transformed with KPOK3C and showing no bias at the PK3 locus in their progenies (T#3, T#4 and T#6: (Rec5 x Sha)_KPOK3C#3, #4 and #6 respectively, Table 2). ShaL3H: heterozygous Sha/Mr-0 for the PK3 locus and Sha for the rest of the nuclear genome.
Fig 4
Fig 4. Structure and cellular localization of the killer proteins.
A. Schematic representation of the two Mr-0 killer proteins compared to APOK3. The homologous regions between the proteins are represented by identical colored boxes with the percentages of identity indicated between proteins within the dotted lines. APOK3 represents the two identical copies of the antidote present in Mr-0. Light blue: 32-amino acid mitochondria-targeting peptide. White boxes represent protein regions with no sequence homology between them. The three HEAT motifs present in APOK3 and KPOK3C are represented by horizontal lines. Dotted boxes indicate predicted NYN domains. Red arrows show the positions of the CRISPR-Cas9 induced mutations. Purple stars indicate the positions of the residues specific for the antidote form of APOK3. B. Mitochondrial colocalization of KPOK3A fused to mTurquoise2 (KPOK3A-Turq, cyan) with APOK3 fused to RFP (APOK3-RFP, magenta). C. Localization of KPOK3C fused to citrine2 (KPOK3C-Citr, yellow). The square frames an example of a mitochondria surrounded by KPOK3C-Citr, while open circles frame examples of apparently colocalized KPOK3C-Citr and APOK3-RFP. D. Cytosolic localization of KPOK3C deprived of its N-terminal part, fused to citrine2 (ΔKPOK3C-Citr, yellow): the citrine2 fluorescence is not associated to RFP-marked mitochondria. Fluorescence was assessed in leaf epidermal cells. Brightness and contrast have been adjusted for clarity. Scale bars: 10 μm.
Fig 5
Fig 5. KO mutations in both antidote genes turns the Mr-0 allele into a suicidal allele.
A. Pollen viability of the double mutant apok3-1 apok3-2 compared to the wild-type (ShaL3M), and of the hybrid between this mutant and Sha compared to the wild-type hybrid (ShaL3M x Sha). Scale bars: 200μM. B. Percentages of plants homozygous for the Mr-0 allele at the PK3 locus in selfed progenies of hybrids between Ct-1 and plants with the Mr-0 allele, either wild-type or with one or both apok3 KO mutations. The percentage expected in the absence of segregation distortion (25%) is indicated by a dotted line. n: number of F2 plants genotyped for each cross. *** p < 0.001; NS, not significant. Complete data are shown in S4 Table.
Fig 6
Fig 6. Behavior of accessions with the TAC form of the antidote in crosses with Mr-0.
Percentages of plants homozygous for the allele with the TAC form of APOK3 in selfed progenies of hybrids with Mr-0. The percentage expected in the absence of segregation distortion (25%) is indicated by a dotted line. Sha is given as a sensitive control (data from S13 Table). n: number of F2 plants genotyped for each cross. *** p < 0.001; ** p< 0.01; * p < 0.05; NS, not significant. Complete data are shown in S5 Table.
Fig 7
Fig 7. Global diversity of the PK3 alleles among 728 natural accessions.
A. Distribution of the different forms of the three PK3 genes. B. Simplified haplotypes observed, with their frequencies among the 728 accessions and predicted behaviors. Complete data are presented in S7 Table.
Fig 8
Fig 8. Phylogenetic tree of KPOK3A sequences.
The sequence from A. suecica was used as an outgroup. Colors indicate the type of KPOK3A as defined by the indels in the promoter and intron. The symbol at each leaf indicates the associated functional type of APOK3: sensitive (TTT), weak resistant (TAC), or resistant (AAC); filled symbol indicates the presence of KPOK3C in the accession.
Fig 9
Fig 9. Geographic distribution of predicted PK3 behaviors in the global collection.
Predicted behaviors of the accessions (S7 Table) were plotted on the world map in R using the ggplot2 package and its world shape file as the basemap. Each dot represents one accession, with predicted behaviors indicated by the dot color. Europe is enlarged in the inset for better resolution.
Fig 10
Fig 10. PK3 in local Burgundy populations.
A. Geographical location of the populations studied. Blue pins: populations without killer haplotypes; red and yellow (TOU-A) pins: populations with both killer and non-killer haplotypes. The map was created using uMap (https://umap.openstreetmap.fr/en/about/); GPS data are from Brachi et al. [48]. A close up on the populations where killer haplotypes were found is shown on the right, with pie charts representations of the distribution of PK3 haplotypes within the populations (Complete data in S11 and S12 Tables).
Fig 11
Fig 11. PK3 behavior in Burgundy accessions.
A. Validation of the behavior of killer alleles from Burgundy accessions in crosses with Sha. B. Validation of the behavior of sensitive alleles from Burgundy accessions in crosses with Mr-0. C. PK3 effect in crosses between accessions of local populations carrying sensitive and killer alleles. Each panel shows the percentages of plants homozygous for the sensitive allele in the progenies of reciprocal crosses between accessions carrying sensitive and killer alleles (dark grey, the sensitive accession is the female parent; light grey, the sensitive is the male parent). The percentage expected in the absence of segregation distortion (25%) is indicated by a dotted line on each panel. The names of the accessions with killer and sensitive alleles are written in red and in black, respectively. n: number of F2 plants genotyped for each cross. All segregations significantly differ from the expected ones with a pvalue < 0.001, except those marked with * (p < 0.05), ** (p < 0.01), or NS (not significant). Complete data are shown in S13–S15 Tables.

Similar articles

Cited by

References

    1. Halpern ME. Barbara McClintock on Defining the Unstable Genome. Genetics. 2016;204: 3–4. doi: 10.1534/genetics.116.194092 - DOI - PMC - PubMed
    1. Ross L. From Mendel’s laws to non-Mendelian inheritance. Nat Rev Genet. Nature Publishing Group; 2024;: 1–1. doi: 10.1038/s41576-024-00753-7 - DOI - PubMed
    1. Zanders SE. What can we learn from selfish loci that break Mendel’s law? Plos Biology. Public Library of Science; 2022;20: e3001700. doi: 10.1371/journal.pbio.3001700 - DOI - PMC - PubMed
    1. Courret C, Wei X, Larracuente AM. New perspectives on the causes and consequences of male meiotic drive. Current Opinion in Genetics & Development. 2023;83: 102111. doi: 10.1016/j.gde.2023.102111 - DOI - PMC - PubMed
    1. Bravo Núñez MA, Nuckolls NL, Zanders SE. Genetic Villains: Killer Meiotic Drivers. Trends Genet. 2018;34: 424–433. doi: 10.1016/j.tig.2018.02.003 - DOI - PMC - PubMed

Substances

LinkOut - more resources