. 2025 Jan 13;21(1):e1012811.
doi: 10.1371/journal.ppat.1012811. eCollection 2025 Jan.

Genomic exploration of the journey of Plasmodium vivax in Latin America

Affiliations

Genomic exploration of the journey of Plasmodium vivax in Latin America

Margaux J M Lefebvre et al. PLoS Pathog. .

Abstract

Plasmodium vivax is the predominant malaria parasite in Latin America. Its colonization history in the region is rich and complex, and is still highly debated, especially about its origin(s). Our study employed cutting-edge population genomic techniques to analyze whole genome variation from 620 P. vivax isolates, including 107 newly sequenced samples from West Africa, Middle East, and Latin America. This sampling represents nearly all potential source populations worldwide currently available. Analyses of the genetic structure, diversity, ancestry, coalescent-based inferences, including demographic scenario testing using Approximate Bayesian Computation, have revealed a more complex evolutionary history than previously envisioned. Indeed, our analyses suggest that the current American P. vivax populations predominantly stemmed from a now-extinct European lineage, with the potential contribution also from unsampled populations, most likely of West African origin. We also found evidence that P. vivax arrived in Latin America in multiple waves, initially during early European contact and later through post-colonial human migration waves in the late 19th-century. This study provides a fresh perspective on P. vivax's intricate evolutionary journey and brings insights into the possible contribution of West African P. vivax populations to the colonization history of Latin America.


Conflict of interest statement

The authors have declared that no competing interests exist.

Figures

Fig 1
Fig 1. Geographic origin of the 620 human P. vivax isolates and two African great apes P. vivax-like isolates.
Distribution of the samples studied per region: Central America (n = 16, light blue), South America (n = 111, dark blue), Europe (n = 1), West Africa (n = 18, light green), East Africa (n = 115, dark green), Middle East (n = 62, orange), South Asia (n = 91, light red), East Asia (n = 7, dark red), Southeast Asia (n = 183, pink), and Oceania (n = 18, purple). The circle size is proportional to the sample size in log10 units. The countries included in the sampling effort are differentiated by varying shades of gray.: darker gray for countries where new samples were sequenced and lighter gray for countries where already published samples were used. Country names highlighted in bold indicate that new genomes were sequenced in this study. In brackets, the number of samples from the literature is listed first, followed by the number of newly sequenced samples. The chimpanzee pictogram indicates the two great apes P. vivax-like samples studied. PNG: Papua New Guinea. The base layer of the map was made with Natural Earth (naturalearthdata.com).
Fig 2
Fig 2. Worldwide genetic structure of P. vivax.
(a) Principal component analysis of 619 modern P. vivax strains and the Ebro ancient DNA sample from Spain, showing the first three PCs based on the genotype likelihood of 105,527 unlinked SNPs (see S2 Fig for more details). (b) Maximum likelihood (ML) tree of the 620 P. vivax individual genomes obtained with IQ-TREE [32] based on a general time reversible model of nucleotide evolution [33], as determined by ModelFinder [34]. The ML tree includes two P. vivax-like strains from African great apes indicated by an asterisk (*) used to locate the root. Note that the length of the outgroup branch was truncated. Black dots at nodes correspond to highly supported nodes (SH-aLRT ≥ 80% and UFboot ≥ 95%). The reference mark (※) highlight a Brazilian P. vivax isolate, discussed in the text. (c) Individual genetic ancestry assuming K = 4 and K = 9 distinct genetic clusters estimated using PCAngsd (see S5 Fig for the other K values). (d) Geographic distribution of the population average genetic ancestry proportions at K = 9 estimated using PCAngsd. PNG: Papua New Guinea. The base layer of the map was made with Natural Earth (naturalearthdata.com).
Fig 3
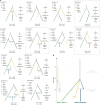
Fig 3. Population graphs describing the genetic relationships and admixture proportions between P. vivax populations.
(a) Population tree estimated using TreeMix for a subset of 18 P. vivax populations with two migration edges (orange arrows) and rooted using the two P. vivax-like genomes indicated with the asterisk (*). The scale bar shows ten times the mean standard error (s.e.) of the covariance matrix. The migration weight is indicated as a percentage in orange on the arrows. (b) Network topology of a subset of 18 P. vivax populations with the highest posterior probability obtained with AdmixtureBayes, rooted with the two P. vivax-like genomes (*). The branch length indicates the genetic divergence between populations (measured by drift), multiplied by 100. The percentages in the nodes are the posterior probability that the true graph has a node with the same descendants. For each admixture event (indicated by the dotted arrows) the percentages illustrate the admixture proportion. PNG: Papua New Guinea.
Fig 4
Fig 4. Coalescent-based inference of the demographic history of P. vivax populations.
(a) The variation in effective population (Ne) size was estimated using Relate (axes are log10 transformed). The period highlighted by the blue rectangle corresponds to the diversification of the Latin American populations. (b) Comparison between the inverse coalescence rates (ICR) and inverse cross-coalescence rates (ICCR) from Relate between Latin America (Colombia on top, French Guiana below) and Eurasia/Africa (left to right: Thailand, Papua-New-Guinea, Mauritania) provides a formal estimate of their split time [46]. The axes are log10 transformed. The periods highlighted by the colored rectangles correspond to the divergence time (Tdiv) between populations and are also specified in the panels. (c) Comparison of the ICR and ICCR between Latin America (Colombia on top, French Guiana below) and Ebro. The 95% confidence interval resulting from 100 bootstraps inferred using Colate is indicated by the envelope surrounding the estimate line. The black dot indicates Ebro sampling time. Axes are in log10 scale units. The period highlighted by the light-yellow rectangles corresponds to the divergence time (Tdiv) between the American populations and Ebro and is specified. PNG: Papua New Guinea.
Fig 5
Fig 5. Most likely P. vivax colonization history scenarios of Latin America inferred using the Approximate Bayesian Computation Random Forest approach.
(a) Twelve colonization scenarios were tested. Distinct solid colored lines correspond to populations with distinct effective size parameters (labels starting with “N”) and horizontal dashed lines represent admixture events with a contribution ra and 1-ra from each of the two contributors. Time parameters of the different events are displayed along the vertical line on the right of each scenario (labels starting with “t”, not to scale). The parameters of each scenario are characterized by probabilistic distributions detailed in S3 Table. Under each scenario is the mean percentage of RF classification votes ± standard deviation (SD) and the mean type II error ± SD. The three most supported scenarios (scenarios 6, 4 and 8, with 46.0% of the total votes) are highlighted by dotted-line rectangles. (b) The best-supported scenario (scenario 6) in the DIYABC-RF analysis, scaled to relative time-parameter estimates (converted to years assuming a generation time of 5.5 generations/year). On the left, each time parameter estimate is indicated by the mean (circle), median (diamond), and 90% confidence intervals (colored bars). Here, the results are only shown considering the Colombian population as a Latin America representative population. Results considering the French Guiana population were very similar (see S4 Table).

Similar articles

Cited by

References

    1. Battle KE, Lucas TCD, Nguyen M, Howes RE, Nandi AK, Twohig KA, et al.. Mapping the global endemicity and clinical burden of Plasmodium vivax, 2000–17: a spatial and temporal modelling study. The Lancet. 2019;394: 332–343. doi: 10.1016/S0140-6736(19)31096-7 - DOI - PMC - PubMed
    1. McGregor I, Krotoski WA. Discovery of the hypnozoite and a new theory of malarial relapse. Trans R Soc Trop Med Hyg. 1985;79: 1–11. doi: 10.1016/0035-9203(85)90221-4 - DOI - PubMed
    1. White NJ. Determinants of relapse periodicity in Plasmodium vivax malaria. Malar J. 2011;10: 297. doi: 10.1186/1475-2875-10-297 - DOI - PMC - PubMed
    1. World Health Organization. World malaria report 2022. 2022 Dec. https://www.who.int/publications/i/item/9789240064898
    1. Gerszten E, Allison MJ, Maguire B. Paleopathology in South American Mummies: A Review and New Findings. Pathobiology. 2012;79: 247–256. doi: 10.1159/000334087 - DOI - PubMed

LinkOut - more resources