. 2025 Mar;12(9):e2410889.
doi: 10.1002/advs.202410889. Epub 2025 Jan 13.

Traditional Chinese Medicine Borneol-Based Polymeric Micelles Intracerebral Drug Delivery System for Precisely Pathogenesis-Adaptive Treatment of Ischemic Stroke

Affiliations

Traditional Chinese Medicine Borneol-Based Polymeric Micelles Intracerebral Drug Delivery System for Precisely Pathogenesis-Adaptive Treatment of Ischemic Stroke

Yanan Wang et al. Adv Sci (Weinh). 2025 Mar.

Abstract

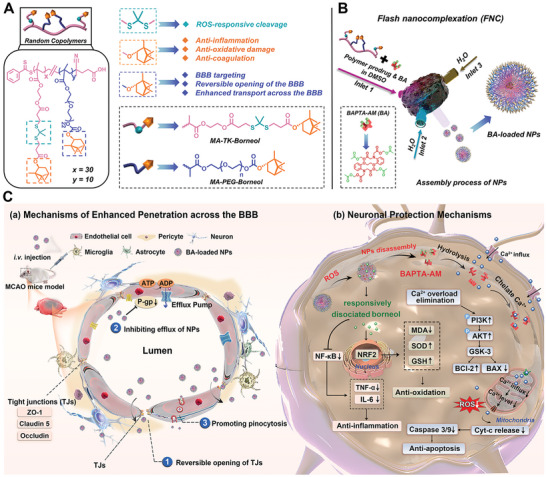
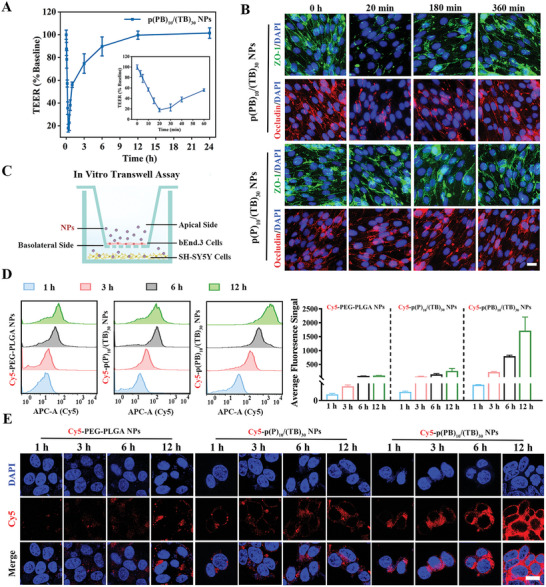
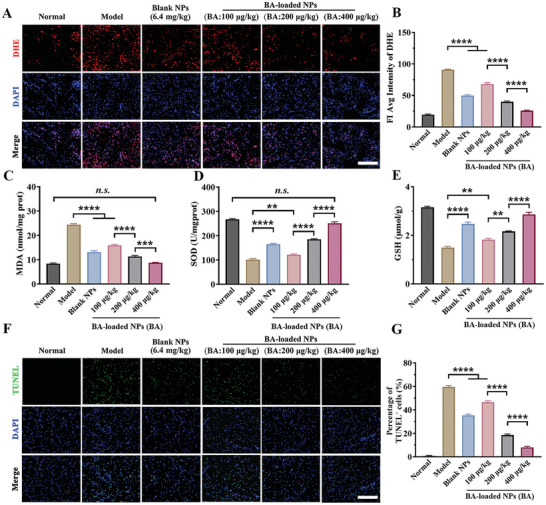
The scarcity of effective neuroprotective agents and the presence of blood-brain barrier (BBB)-mediated extremely inefficient intracerebral drug delivery are predominant obstacles to the treatment of cerebral ischemic stroke (CIS). Herein, ROS-responsive borneol-based amphiphilic polymeric NPs are constructed by using traditional Chinese medicine borneol as functional blocks that served as surface brain-targeting ligand, inner hydrophobic core for efficient drug loading of membrane-permeable calcium chelator BAPTA-AM, and neuroprotective structural component. In MCAO mice, the nanoformulation (polymer: 3.2 mg·kg-1, BAPTA-AM: 400 µg·kg-1) reversibly opened the BBB and achieved high brain biodistribution up to 12.7%ID/g of the total administered dose after 3 h post single injection, effectively restoring intracellular Ca2+ and redox homeostasis, improving cerebral histopathology, and inhibiting mitochondrial PI3K/Akt/Bcl-2/Bax/Cyto-C/Caspase-3,9 apoptosis pathway for rescuing dying neurons (reduced apoptosis cell from 59.5% to 7.9%). It also remodeled the inflammatory microenvironment in cerebral ischemic penumbra by inhibiting astrocyte over-activation, reprogramming microglia polarization toward an anti-inflammatory phenotype, and blocking NF-κB/TNF-α/IL-6 signaling pathways. These interventions eventually reduced the cerebral infarction area by 96.3%, significantly improved neurological function, and restored blood flow reperfusion from 66.2% to ≈100%, all while facilitating BBB repair and avoiding brain edema. This provides a potentially effective multiple-stage sequential treatment strategy for clinical CIS.

Keywords: BAPTA‐AM; ROS‐responsive; blood‐brain barrier; borneol; ischemic stroke.


Conflict of interest statement

The authors declare no conflict of interest.

Figures

Scheme 1
Scheme 1
A schematic representation depicting A) the chemical structure of p(PB)10/(TB)30 polymer and the functions of different structures; B) the FNC setup for the preparation of BA‐loaded NPs. The inlet 1 was designated for feeding the polymer and BAPTA‐AM dissolved in DMSO (organic phase), while inlets 2 and 3 were utilized for feeding water (aqueous phase), and C) their BBB‐penetrating and therapeutic mechanisms in a middle cerebral artery occlusion (MCAO) mouse model.
Figure 1
Figure 1
Preparation and characterization of BA‐loaded NPs. A) The polymer prodrug's chemical structure and the FNC setup for preparation of NPs. The inlet 1 was designated for feeding the polymer and BAPTA‐AM dissolved in DMSO (organic phase), while inlets 2 and 3 were utilized for feeding water (aqueous phase). B) The effect of the total volumetric flow rate on the size distribution of NPs. The organic phase's volumetric flow rate ratio to the aqueous phase was set at 1:9. C) The effect of the mass ratio of the polymer with BA on average size and LC. The volumetric flow rate in inlet 1, 2, and 3 was set at 2, 9, and 9 mL·min−1, respectively. D) Stability of BA‐loaded NPs incubated in stimulated physiological PBS medium (10 mM, pH 7.4) at 25 °C. E) The ζ‐potential of blank NPs and BA‐loaded NPs. Representative transmission electron microscope (TEM) image and quantitative particle diameter distribution results of F) blank NPs and G) BA‐loaded NPs. Scale bar: 100 nm. H) A schematic diagram of the mechanism of responsive dissociation of borneol from hydrophobic block under ROS stimulation. I) Conversion of polymer to polymeric fragments under the action of 0.5 mM H2O2 analyzed by 1H NMR spectra. The inset only showed partial chemical shifts between 1.5 and 1.9 ppm. J) Size distributions of BA‐loaded NPs after exposure to PBS medium (pH 6.5) with or without 500 µM H2O2. K) Drug release profiles of formulation in PBS (pH 6.5 or 7.4) and PBS (pH 6.5) containing 500 µM H2O2. n = 3. Data are shown as mean ± SEM.
Figure 2
Figure 2
p(PB)10/(TB)30 NPs reversibly open tight junctions (TJs) and promote transport across the BBB. A) Changes in the transmembrane resistance (TEER) value of BBB‐mimic bEnd.3 monolayers at different time points after incubation with p(PB)10/(TB)30 NPs. n = 3. B) Representative fluorescent image of the variations in ZO‐1 proteins and Occludin proteins over time in BBB‐mimic bEnd.3 monolayers, following incubation with p(PB)10/(TB)30 NPs or p(P)10/(TB)30 NPs. Scale bar: 20 µm. n = 6. C) Scheme of an in vitro transwell study on co‐culture of bEnd.3 cells (up) and SH‐SY5Y cells (down). NPs were added to the upper BBB‐mimic bEnd.3 monolayer. D) The cell uptake results of Cy5‐labaled NPs in SH‐SY5Y cells after crossing the BBB‐mimic bEnd.3 monolayers, assessed using flow cytometry. n = 3. E) The cell uptake results of Cy5‐labaled NPs in SH‐SY5Y cells after crossing the BBB‐mimic bEnd.3 monolayers, assessed using confocal microscopy imaging. Scale bar: 10 µm. n = 6. Data are shown as mean ± SEM.
Figure 3
Figure 3
The cytoprotective effects of formulations. A) The quantitative flow cytometry results for intracellular ROS levels in glutamate‐induced injured SH‐SY5Y cells with various treatments. n = 3. B) The quantitative flow cytometry results of intracellular Ca2+ levels in a glutamate‐induced excitotoxicity acute neuronal cell injury model (injured SH‐SY5Y cells) with various treatments. n = 3. C) Semi‐quantitative results and D) fluorescence images of JC‐1 aggregate/JC‐1 monomer to represent mitochondrial membrane potential (MMP). n = 6. Scale bar: 50 µm. n = 6. E) The intracellular ATP levels of injured SH‐SY5Y cells after treatment with various formulations. n = 3. F) The cell viability recovery of injured SH‐SY5Y cell following (F) 12 h and G) 24 h of treatments. n = 3. Immunofluorescent results of co‐staining pan‐microglia marker (Iba1) and H) M1‐microglia marker (iNOS) or I) M2‐microglia marker (Arg‐1) for evaluating the M1 or M2 phenotype polarization of microglia (BV2 cells). Scale bar: 100 µm. n = 6. Data are shown as mean ± SEM.
Figure 4
Figure 4
Brain‐targetability and in vivo distribution of p(PB)10/(TB)30 in the MCAO mice. A) Ex vivo fluorescence image of Cy5‐p(PB)10/(TB)30 NPs and Cy5‐p(P)10/(TB)30 NPs in the whole brain. B) The semi‐quantitative fluorescent intensity of Cy5‐p(PB)10/(TB)30 NPs and Cy5‐p(P)10/(TB)30 NPs in brains. n = 3. C) Fluorescence imaging of major organs and D) the quantified fluorescence intensity. n = 3. E) The quantitative fluorescent intensity results in the brain tissue homogenate from mice treated with Cy5‐p(PB)10/(TB)30 NPs and Cy5‐p(P)10/(TB)30 NPs. ID/g represented percent injected dose per gram of organ, which indicated the localization ratio in brain. n = 3. Data are shown as mean ± SEM.
Figure 5
Figure 5
BA‐loaded NPs improved neurological function recovery in MCAO mice. A) The typical TTC staining images of the brain slices of normal mice and MCAO mice with treatments, white indicated infarcted areas, while non‐infarcted areas were red. B) Quantitative results of cerebral infarct volume (ratio of white infarcted areas to the entire cerebral area) in different groups. n = 5. C) H&E staining of the brains from each treatment. Scale bar: 50 µm. Red arrows indicate neuronal shrinkage, and green arrows indicate the regions of vacuolization. D) Representative Nissl staining of brain sections. Scale bar: 50 µm, n = 3. LFB staining of brain sections. Scale bar: 100 µm, n = 3. E) Immune‐fluorescent staining of NeuN of brain tissue sections. Scale bar: 100 µm. Data are shown as mean ± SEM.
Figure 6
Figure 6
BA‐loaded NPs reduce brain tissue infarction and promote blood flow recovery in MCAO mice. A) (i) T2‐weighted magnetic resonance (MRI) imaging and (ii) their corresponding false color scans. B) the semi‐quantitative infarct volume results (hypersignal area in MRI imaging) of MCAO mice from each group. n = 3. C) Color‐coded laser speckle images that reflect blood flow reperfusion. D) Semi‐quantitative analysis of blood flow ratio at different time points in ischemic lesions. n = 3. Data are shown as mean ± SEM.
Figure 7
Figure 7
Neuroprotection of BA‐loaded NPs from cerebral I/R injury in MCAO mice. A) DHE staining for evaluating the superoxide in brain of MCAO mice, and B) the semi‐quantitative results. Scale bar: 200 µm. n = 6. C) The MDA, D) SOD, and E) the GSH levels in tissue homogenate. n = 8‐12. F) Representative images of TUNEL staining for evaluating the apoptotic cells, scale bar: 200 µm, and G) the semi‐quantitative results of TUNEL‐positive cell proportion. n = 6. Data are shown as mean ± SEM.
Figure 8
Figure 8
BA‐loaded NPs inhibit the progression of neuroinflammation and modulate the cerebral inflammatory microenvironment in MCAO mice. A) Immunofluorescence staining images of GFAP‐labeled activated astrocytes in cerebral penumbra from MCAO mice with different treatments. n = 5 Scale bar: merge (100 µm), magnify (50 µm). B) Representative immunofluorescent results of pan‐microglia marker (Iba1) and pro‐inflammatory M1‐microglia marker (CD16/32) for evaluating the M1 phenotype polarization of microglia in MCAO mice with different treatments. Scale bar: 50 µm. n = 6. C) Representative immunofluorescent results of pan‐microglia marker (Iba1) and pro‐inflammatory M2‐microglia marker (CD206) for evaluating the M2 phenotype polarization of microglia in MCAO mice with different treatments. Scale bar: 50 µm. n = 6. Protein expression abundance of D) NF‐κB, E) TNF‐α, and F) IL‐6 in cerebral tissue homogenate. n = 3. Lane 1, Normal group; Lane 2, Model group, Lane 3, Blank NPs‐treated group; Lane 4, 5, and 6 was BA‐loaded NPs‐treated group at BA dose of 100, 200, and 400 µg·kg−1. G) Representative immunofluorescent results of CD31, a biomarker for endothelial cells, for evaluating the recovery of microvessel endothelium in MCAO mice with different treatments. Scale bar: merge (200 µm), magnify (100 µm). n = 6. Data are shown as mean ± SEM.
Figure 9
Figure 9
BA‐loaded NPs promote BBB remodeling after stroke. A) Representative immunofluorescent results of key TJs’ complex proteins, ZO‐1, in MCAO mice with different treatments. Scale bar: 20 µm. n = 6. B) Immunofluorescent results of key TJs’ complex proteins, Occudin, in MCAO mice with different treatments. Scale bar: 20 µm. n = 6. The representative western blot analysis of the TJ's complex proteins C) ZO‐1, D) Occludin, and E) Claudin‐5 and their semi‐quantitative results. n = 3. Lane 1, Normal group; Lane 2, Model group, Lane 3, Blank NPs‐treated group; Lane 4, 5, and 6 was BA‐loaded NPs‐treated group at BA dose of 100, 200, and 400 µg·kg−1. F) Representative immunofluorescent results of AQP4 in MCAO mice with different treatments. Scale bar: merge (200 µm), magnify (100 µm). n = 6. Data are shown as mean ± SEM.
Figure 10
Figure 10
BA‐loaded NPs alleviate the cerebral stroke by inhibiting the mitochondrial apoptosis pathway. The representative western blots and semi‐quantitative results of A) p‐Akt and Akt, B) p‐PI3K and PI3K, C) BCl‐2, D) Bax, E) Cyt‐C, F) Cleaved Capase‐9; G) Cleaved Capase‐3; H) Pro Capase‐3. n = 3. Lane 1, Normal group; Lane 2, Model group, Lane 3, Blank NPs‐treated group; Lane 4, 5, and 6 was BA‐loaded NPs‐treated group at BA dose of 100, 200, and 400 µg·kg−1. I) Treatment mechanism diagram of the formulations. Data are shown as mean ± SEM.

Similar articles

Cited by

References

    1. a) Patel P., Yavagal D., Khandelwal P., J. Am. Coll. Cardiol. 2020, 75, 1844; - PubMed
    2. b) Saini V., Guada L., Yavagal D. R., Neurol. 2021, 97, S6. - PubMed
    1. Fanning J. P., Campbell B. C. V., Bulbulia R., Gottesman R. F., Ko S. B., Floyd T. F., Messé S. R., Nat. Rev. Dis. Prim. 2024, 10, 3. - PubMed
    1. Qin C., Yang S., Chu Y. H., Zhang H., Pang X. W., Chen L., Zhou L. Q., Chen M., Tian D. S., Wang W., Signal Transduction Targeted Ther. 2022, 7, 215. - PMC - PubMed
    1. a) Guan X., Zhu S., Song J., Liu K., Liu M., Xie L., Wang Y., Wu J., Xu X., Pang T., Cell Rep. Med. 2024, 5, 101522; - PMC - PubMed
    2. b) Shi K., Tian D. C., Li Z. G., Ducruet A. F., Lawton M. T., Shi F. D., Lancet Neurol. 2019, 18, 1058. - PubMed
    1. Lin W., Zhao X. Y., Cheng J. W., Li L. T., Jiang Q., Zhang Y. X., Han F., Pharmacol. Ther. 2023, 251, 108541. - PubMed

LinkOut - more resources