. 2025 Feb 17;64(8):e202407359.
doi: 10.1002/anie.202407359. Epub 2025 Jan 28.

Digital and Tunable Genetically Encoded Tension Sensors Based on Engineered Coiled-Coils

Affiliations

Digital and Tunable Genetically Encoded Tension Sensors Based on Engineered Coiled-Coils

Shuhong Liu et al. Angew Chem Int Ed Engl. .

Abstract

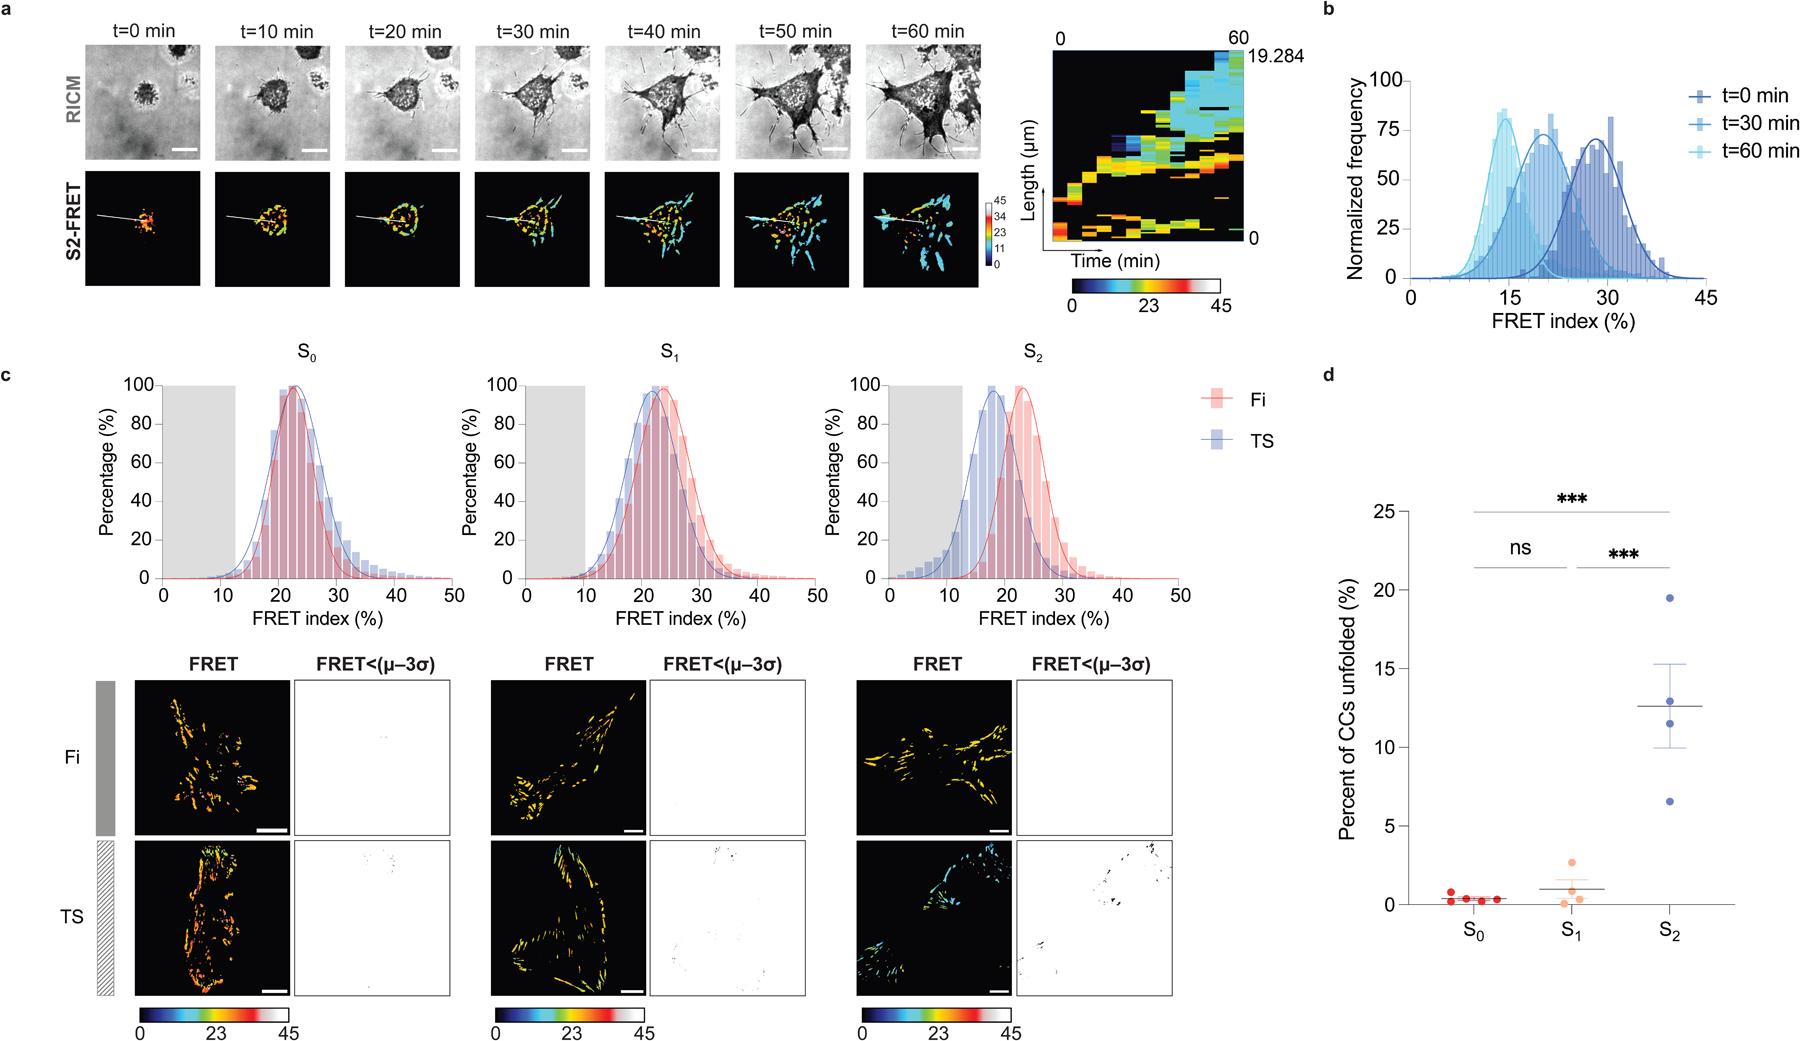
Genetically encoded tension sensors (GETSs) allow for quantifying forces experienced by intracellular proteins involved in mechanotransduction. The vast majority of GETSs are comprised of a FRET pair flanking an elastic "spring-like" domain that gradually extends in response to force. Because of ensemble averaging, the FRET signal generated by such analog sensors conceals forces that deviate from the average, and hence it is unknown if a subset of proteins experience greater magnitudes of force. We address this problem by developing digital GETSs comprised of coiled-coils (CCs) with tunable mechanical thresholds. We validate the mechanical response of CC digital probes using thermodynamic stability prediction, AlphaFold2 modeling, steered molecular dynamics simulations, and single-molecule force spectroscopy. Live cell measurements using optimized CC tension sensors that are inserted into vinculin demonstrate that 13 % of this mechanosensor experiences forces >9.9 pN within focal adhesions. This reveals greater magnitudes of vinculin force than had previously been reported and demonstrates that CC tension sensors enable more facile and precise tension measurements in living systems.

Keywords: FRET; biophysics; biosensors; protein engineering.


Conflict of interest statement

Conflict of Interest

The authors declare no conflict of interest.

Figures

Figure 1
Figure 1
Molecular design of CC library based on folding energy and structure prediction. (a) Amino acid sequences of CC serine mutants. (b) CC-S0 sequence shown in helical wheel diagram. Mutants were designed by replacing leucine to serine at “a”, “d” positions. (c) BUDE energy score of CC serine mutants. (d) Illustration of predicted structures for CC-S0, CC-S1, CC-S2, CC-S4 and CC-S7 using AlphaFold2. Confidence score for the prediction is color coded as shown in the legend at the bottom right. Values of 90 and greater are shown in dark blue and indicate high confidence in the predicted structure. plDDT =predicted local distance difference test.
Figure 2
Figure 2
Ensemble FRET measurements in cell. (a) RICM images (top), acceptor channel images (middle, gray), and FRET index images (bottom, RGB) of MEF cells express CC library. Top three rows of images demonstrate cells transfected with force insensitive constructs, and bottom three rows show cells transfected with tension sensor constructs. The scale bar=10 μm. (b) Quantification of FRET index comparing Fi and TS constructs among the CC library. Error bars represent SD. Each data represents an average FRET index of individual cell (n=58, 52, 78, 88, 55 for Fi and n =45, 67, 45, 54, 51 for TS, pooled from five individual experiments). *** p <0.001, **** p <0.0001, unpaired t-test, two-tailed, assuming equal SD. (c) Plot of ΔFRET for each sequence of CC library analyzed from a data set of (b). ΔFRET=MeanFi - MeanTS, mean data were analyzed from five individual experiment. Error bars represent SEM. *** p <0.001, one-way ANOVA. (d) Quantification of FRET for TS-S0 and opt-VinTS expressed in HEK 293 and collected from cell lysate (n=3). Error bars represent SD. SD=1.0 % and 2.6 %, respectively. p =0.0037, unpaired t-test, two-tailed, assuming equal SD. (e) Probability of probe opening considering P(Fi-S0) =1, P(Fi-S7) =0 (R2 =0.8603, SDslope =0.004, SDY-intersept=0.014). Error bars represent SD. Areas filled with blue represents 95 % confidence intervals. Note that the goodness of fit was derived from the variance of the FRET values for the Fi-S7 and Fi-S0. (f) Representative FRET index images (left) converted to opening probe density (right) for Fi-S2 and TS-S2 using equation adopted from (e).
Figure 3
Figure 3
Steered molecular dynamics (SMD) predicts works required to unfold CCs. (a) Representative snapshots from a SMD simulation to unfold CC-S0, with increasing N-C distance (d =15, 50, 70 Å). The protein is rendered in New Cartoon, with residues on the coiled-coil interacting surface rendered in vDW representation. The carbon of Leu is in cyan and the carbon of Asn is in green. (b) The potential of mean force (PMF) as a function of N-C distance for CC library (left). The PMF is obtained by combining the accumulated works of 10 replicas of SMD simulations according to Jarzynski Equality. The data of all 10 replicas is shown in Figure S7. The total work needed to unfold each CC (right), measured as the potential energy of the point when the force drops to nearly 0 pN (<5 pN), is linearly decreasing as we increase the number of serine mutations.
Figure 4
Figure 4
Single-molecule force calibration of CC-S0 and CC-S2. (a) Illustration of optical tweezer set up with CC domain tethered between two polystyrene beads. A 2326 bp dsDNA is added as linker. Channel 1: SA beads in 1X PBS; channel 2, 4, and 5: 1X PBS; channel 3: DBCO beads incubated with CC-DNA in 1X PBS; channel 6: output to waste. (b,c) Ensemble F-D curves fit by WLC with closing and opening contour lengths for CC-S0 and CC-S2, respectively. The F-D unfolding and refolding curves for CC-S0 and CC-S2 constructs came from n =13 and 17 and n=7 and 9 trajectories, respectively. The loading rate was 50 nm/sec. (d,e) Representative unfolding and refolding F-D curves for CC-S0 and CC-S2. (f,g) Histograms plotting the unfolding (red) and refolding forces (blue) for CC-S0 and CC-S2 with corresponding colored dotted lines depicting a Gaussian distribution based on the mean and standard deviation. F1/2 values of S0 and S2 constructs (black dotted lines) was calculated from the instersection probabilities of Frefolding and Funfolding.
Figure 5
Figure 5
CCTS offers improved S/N for mapping vinculin tension in focal adhesions. (a) Time lapse video mapping vinculin tension using TS-S2 in RICM (top) and FRET (bottom) channels. The figure also shows a kymograph for the line scan indicated in the image. The scale bar=10 μm. (b) Histogram analysis of single cell FRET from (a) as a function of time. For t =0 min the mean FRET= 28 %, t =30 min mean FRET =20 %, and for t =60 min mean FRET= 15 %. (c) Pixel by pixel histogram analysis for FRET signal in cells expressing Fi-S0, Fi-S1 and Fi-S2 (blue), TS-S0, TS-S1 and TS-S2 (red) (bin size =4, gray area is where FRET TS <FRET Fiμ−3σ). The data was obtained from at least n =50 cells. Representative FRET and thresholded FRET<FRET μ−3σ binary images (black: FRET<FRETμ−3σ) for cells expressing Fi-S0, Fi-S1 and Fi-S2 (top), TS-S0, TS-S1 and TS-S2 (bottom). (d) Plot quantifying % of pixels with CCTS probes unfolded using the FRET < FRETμ−3σ for S0, S1 and S2 (n=5,4 and 4, respectively). Error bars represent the SEM. SEM=0.11 %, 0.60 % and 2.67 %, respectively. *** p <0.001, ns p=0.9520, one-way ANOVA.
Scheme 1
Scheme 1
CC-based digital GETS. (a) Hypothetical plots comparing the response of analog (left) and digital (right) sensors. (b) Helical wheel and arrow diagrams of parallel (top) and antiparallel (bottom) CCs. Gray arrow indicates donor-acceptor distance at rest (drest) for each geometry. Note that a smaller drest is most desirable to maximize FRET change in response to force. (c) Design of CC tension sensor (CCTS) to detect forces transmitted across protein of interest (POI). When F is lower than the threshold, the probe shows high FRET signal, but when F exceeds the threshold, the CC unfolds and the probe shows low FRET signal. (d) Plasmid maps showing the design of the CCTS inserted between vinculin head (Vh) and tail (Vt) domains (left) and force insensitive control construct with CCTS attached at the C-terminus of vinculin (right). D=donor and A=acceptor.

Similar articles

Cited by

References

    1. Vining KH, Mooney DJ, Nat. Rev. Mol. Cell Biol 2017, 18, 728–742. - PMC - PubMed
    1. Lange JR, Fabry B, Exp. Cell Res 2013, 319, 2418–23. - PMC - PubMed
    1. Liu Y, Blanchfield L, Ma VP-Y, Andargachew R, Galior K, Liu Z, Evavold B, Salaita K, Proceedings of the National Academy of Sciences. 2016, 113, 5610–5615. - PMC - PubMed
    1. Grashoff C, Hoffman BD, Brenner MD, Zhou R, Parsons M, Yang MT, McLean MA, Sligar SG, Chen CS, Ha T, Schwartz MA, Nature 2010, 466, 263–266. - PMC - PubMed
    1. Stabley DR, Jurchenko C, Marshall SS, Salaita KS, Nat. Methods 2011, 9, 64–7. - PubMed

LinkOut - more resources