. 2025 Jan 13;16(1):547.
doi: 10.1038/s41467-024-54643-x.

Robust collection and processing for label-free single voxel proteomics

Affiliations

Robust collection and processing for label-free single voxel proteomics

Reta Birhanu Kitata et al. Nat Commun. .

Abstract

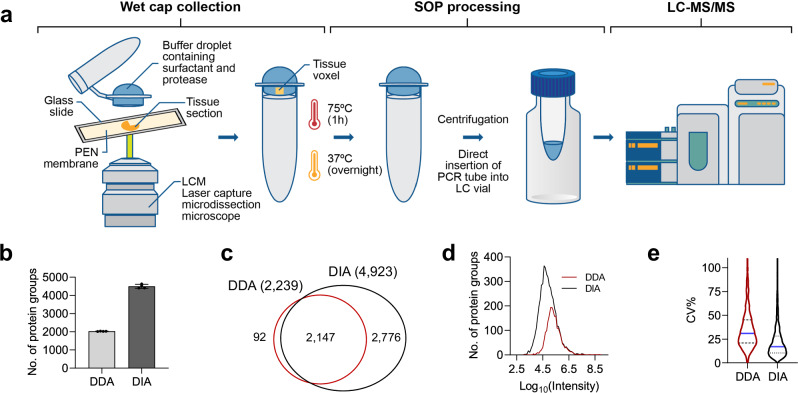
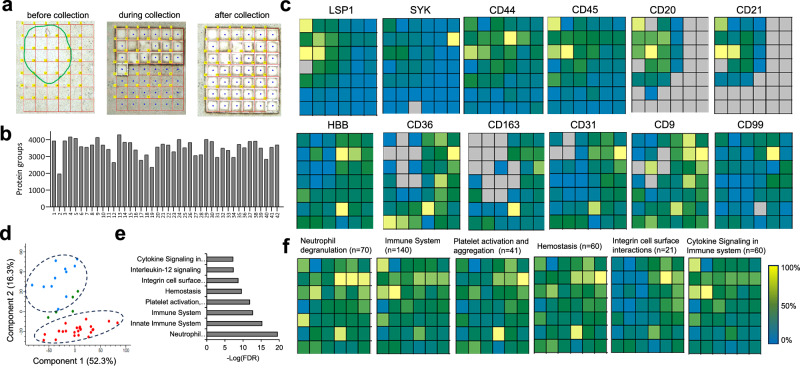
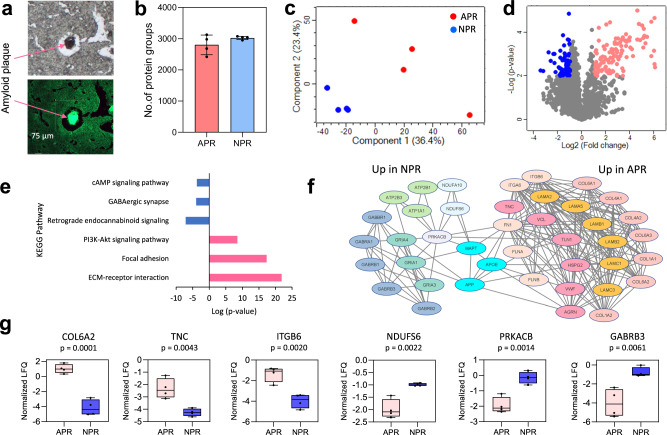
With advanced mass spectrometry (MS)-based proteomics, genome-scale proteome coverage can be achieved from bulk tissues. However, such bulk measurement lacks spatial resolution and obscures tissue heterogeneity, precluding proteome mapping of tissue microenvironment. Here we report an integrated wet collection of single microscale tissue voxels and Surfactant-assisted One-Pot voxel processing method termed wcSOP for robust label-free single voxel proteomics. wcSOP capitalizes on buffer droplet-assisted wet collection of single voxels dissected by LCM to the tube cap and SOP voxel processing in the same collection cap. This method enables reproducible, label-free quantification of approximately 900 and 4600 proteins for single voxels at 20 µm × 20 µm × 10 µm (~1 cell region) and 200 µm × 200 µm × 10 µm (~100 cell region) from fresh frozen human spleen tissue, respectively. It can reveal spatially resolved protein signatures and region-specific signaling pathways. Furthermore, wcSOP-MS is demonstrated to be broadly applicable for OCT-embedded and FFPE human archived tissues as well as for small-scale 2D proteome mapping of tissues at high spatial resolutions. wcSOP-MS may pave the way for routine robust single voxel proteomics and spatial proteomics.


Conflict of interest statement

Competing interests: The authors declare no competing interest.

Figures

Fig. 1
Fig. 1. Schematic diagram of the wcSOP-MS workflow.
a There are three steps for wcSOP-MS: wet cap collection, SOP processing, and LC-MS/MS analysis. A tissue slide mounted on PEN membrane is cut by laser and a single tissue voxel is catapulted to a dome-shaped PCR tube cap prefilled with a cocktail of buffer containing DDM surfactant for tissue lysis and a mixture of Lys-C and trypsin protease for protein digestion. Single voxels are incubated at 75 °C for 1 h (tissue lysis and protein denaturation) and 37 °C for overnight (protein digestion) on the cap at a hanging droplet position to have full interaction between the voxel and the cocktail buffer. After voxel processing, the digested peptides are transferred to the bottom of the tube by centrifugation at 2000 × g for 5 min. Prior to LC-MS analysis, the cap of the PCR tube is removed, and the tube is inserted into a sample vial to avoid sample transfer loss. Single voxels are analyzed by using a standard LC-MS platform for quantitative proteomic analysis. The freely-available open-source MaxQuant and DIA-NN software tools are used for DDA and DIA label-free quantitation, respectively. b Comparison of the number of identified protein groups (No. of protein groups) between DDA and DIA for single spleen tissue voxels at a size of 200 µm × 200 µm × 10 µm (n = 3 biological replicates; data are presented as mean values ± SD). c Venn diagram of protein overlap between DDA and DIA for single spleen tissue voxels at a size of 200 µm × 200 µm × 10 µm. d Proteome dynamic range for DDA and DIA quantification of single spleen tissue voxels at a size of 200 µm × 200 µm × 10 µm. e Comparison of the coefficient of variations (CVs) in protein abundance between DDA and DIA for analysis of single spleen tissue voxels at a size of 200 µm × 200 µm × 10 µm with 4 biological replicates. Source data are provided as a Source Data file.
Fig. 2
Fig. 2. wcSOP-MS analysis of different sizes of single voxels from red and white pulp regions of fresh frozen human spleen tissue.
a The number of identified unique peptides and protein groups at different sizes of single voxels (n = 4 biological replicates for 200 µm and n = 3 biological replicates for the other sizes; data are presented as mean values ± SD). b Proteome dynamic range from DIA quantification of single voxels at different sizes against the largest voxel size of 40,000 µm2. c PCA analysis of the commonly expressed protein abundance between single voxels from the red and white pulp regions at different sizes. d Volcano plots between single voxels from the red and white pulp regions at different sizes (DEP%: the percentage of the number of differentially expressed over total proteins). The number of down/up regulated protein groups from the red pulp region: 2/45 for 400 µm2, 815/373 for 2500 µm2, 1151/1347 for 10,000 µm2, and 2447/1361 for 40,000 µm2. DEPs are displayed with blue and red dots for upregulated proteins in white and red pulp regions, respectively (two-sided t-test, FDR < 0.05, s0 = 0.1, n = 4 biological replicates for 200 µm and n = 3 biological replicates for the other sizes). e Correlation analysis of the protein abundance ratio of the red over white pulp regions for differentially expressed proteins (DEPs) from small single voxels with the largest single voxels at 40,000 µm2. Single voxels at 400 µm2 (20 µm × 20 µm equivalent to 1 cell region), 2500 µm2 (50 µm × 50 µm equivalent to 6 cell region), 10,000 µm2 (100 µm × 100 µm equivalent to 25 cell region) and 40,000 µm2 (200 µm × 200 µm equivalent to 100 cell region) with a thickness of 10 µm were collected, processed, and analyzed using wcSOP-DIA MS with 4 biological replicates per condition. Source data are provided as a Source Data file.
Fig. 3
Fig. 3. Functional analysis of single voxel proteomics data from the largest voxels (voxel size: 200 µm × 200 µm × 10 µm).
a Differentially expressed CD protein markers between the red and white pulp regions (two-sided t-test, FDR < 0.05, s0 = 0.1, n = 4 biological replicates). b Enriched signaling pathways between the red and white pulp regions (FDR < 0.05). c Antibody-based CODEX image of human spleen tissue slide to validate label-free DIA MS quantitation: CD8 (yellow), CD20 (red), CD4 (green), and CD163 (cyan). Prior to image data generation, CODEX imaging was extensively optimized with multiple combinations of antibodies on human spleen tissue slides to ensure high reproducibility. Source data are provided as a Source Data file.
Fig. 4
Fig. 4. Proteome mapping of human spleen tissue at 100 µm spatial resolution.
a Tissue sections before, during, and after LCM collection. b The number of quantified protein groups for each voxel across the mapping region. c The normalized protein expression across the mapping region for region-specific protein markers. d Principal component analysis (PCA) of all the tissue voxels based on protein expression. Data point colors: Blue, red and green correspond to white pulp (WP), red pulp (RP) and the mixed regions from the histology view, respectively. e Signaling pathway enrichment based on differentially expressed proteins between WP and RP regions (FRD < 0.05). f 2D maps of the enriched immune signaling pathways using the average abundance of proteins involved in these pathways. In total 42 voxels at the size of 100 µm × 100 µm × 10 µm were collected to cover one WP and adjacent RP regions, and then processed by wcSOP followed by DIA-MS analysis. Source data are provided as a Source Data file.
Fig. 5
Fig. 5. wcSOP-MS analysis of single voxels at the size of 100 µm × 100 µm from tumor and adjacent normal regions of OCT-embedded TNBC patient tissue.
a The images of TNBC tumor and adjacent normal tissues using H&E staining. H&E staining was performed on multiple TNBC slides to ensure high reproducibility and the H&E stained slide with the highest cell counts was selected for wcSOP-MS analysis. b The number of identified protein groups from tumor and normal regions (9 biological replicates for tumor region with >1800 protein groups per voxel and 3 biological replicates for normal region with >1000 protein groups per voxel; data are presented as mean values ± SD). c PCA analysis of the commonly expressed protein abundance between single voxels from tumor and normal regions. d Volcano plots between single voxels from tumor and normal regions. DEPs are displayed with blue and red dots for upregulated proteins in normal and tumor regions, respectively (two-sided t-test, FDR < 0.05, s0 = 0.1, n = 3 biological replicates for normal region and n = 9 biological replicates for tumor region). e Differential expression of known breast cancer protein markers (CD14, CD44, PLXNB2, EGFR) between the tumor and normal regions (n = 3 and 9 biological replicates for normal and tumor regions, respectively). The p value is estimated by Welch’s t-test (two-sided). For unequal sample sizes (3 normal versus 9 tumor biological replicates), the box plots show floating bars from minima to maxima along with solid lines for medians. f Immunohistochemistry (IHC) images of normal and tumor regions, stained for CD14, CD44, PLXNB2, and EGFR. Scale bar = 50 µm. Source data are provided as a Source Data file.
Fig. 6
Fig. 6. wcSOP-MS analysis of 5 × single voxels at the size of 100 µm × 100 µm from amyloid plaque and adjacent non-plaque region of FFPE AD patient tissue.
a Thioflavidin staining to identify amyloid plaques for single voxel collection. In the image of thioflavin staining the amyloid plaque containing region framed with square shape was defined as “APR” and the adjacent non-plaque region was defined as “NPR”. b The number of identified protein groups for 5 × single voxels from APR and NPR (APR: amyloid plaque region; NPR: non-plaque region) with an average of 2805 and 3024 protein groups and median CVs of 11% and 2% for APR and NPR, respectively (n = 4 pooled biological replicates for APR and NPR; data are presented as mean values ± SD). c PCA analysis of the commonly expressed protein abundance for 5 × single voxels between APR and NPR. d Volcano plots between 5 × single voxels from APR and NPR (p < 0.01 and ≥2-fold change). DEPs are displayed with blue and red dots for upregulated proteins in NPR and APR, respectively (two-sided t-test, FDR < 0.05, s0 = 0.1, n = 4 pooled biological replicates for NPR and APR). e The enriched signaling pathways between APR and NPR via KEGG pathway analysis (FDR < 0.05). f Network analysis of differentially expressed proteins. Except the middle AD associated proteins APP, APOE4, and MAPT, the network proteins at the left and the right sides were upregulated in NPR and APR, respectively. g Examples of 6 differentially expressed protein signatures between APR and NPR (n = 4 pooled biological replicates for APR and NPR). The p value is estimated by Welch’s t-test (two-sided). The box plots define the range of the data (whiskers), 25th and 75th percentiles (box), and medians (solid line). Outliers are plotted as individual dots outside the whiskers. Source data are provided as a Source Data file.

Update of

References

    1. Regev, A. et al. The human cell atlas. eLife6, e27041 (2017). - PMC - PubMed
    1. Hu, B. C. The human body at cellular resolution: the NIH Human Biomolecular Atlas Program. Nature574, 187–192 (2019). - PMC - PubMed
    1. Mass, E., Nimmerjahn, F., Kierdorf, K. & Schlitzer, A. Tissue-specific macrophages: how they develop and choreograph tissue biology. Nat. Rev. Immunol.23, 563–579 (2023). - PMC - PubMed
    1. Uhlen, M. et al. Proteomics. Tissue-based map of the human proteome. Science347, 1260419 (2015). - PubMed
    1. Jain, S. et al. Advances and prospects for the Human BioMolecular Atlas Program (HuBMAP). Nat. Cell Biol.25, 1089–1100 (2023). - PMC - PubMed

LinkOut - more resources