. 2025 Jan 13;16(1):630.
doi: 10.1038/s41467-025-56002-w.

Increased SOAT2 expression in aged regulatory T cells is associated with altered cholesterol metabolism and reduced anti-tumor immunity

Affiliations

Increased SOAT2 expression in aged regulatory T cells is associated with altered cholesterol metabolism and reduced anti-tumor immunity

Mingjiong Zhang et al. Nat Commun. .

Abstract

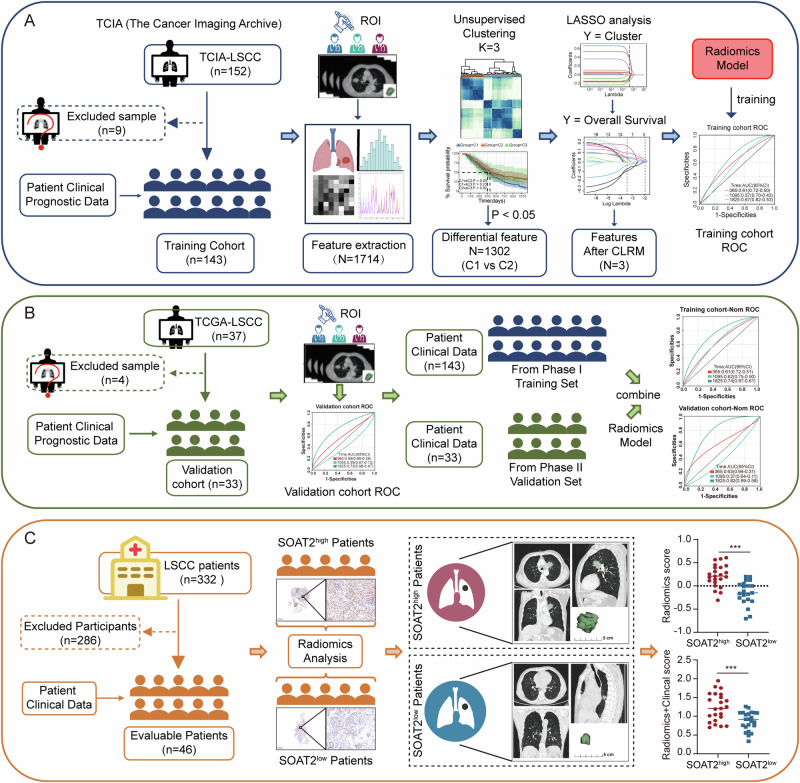
Immune functions decline with aging, leading to increased susceptibility to various diseases including tumors. Exploring aging-related molecular targets in elderly patients with cancer is thus highly sought after. Here we find that an ER transmembrane enzyme, sterol O-acyltransferase 2 (SOAT2), is overexpressed in regulatory T (Treg) cells from elderly patients with lung squamous cell carcinoma (LSCC), while radiomics analysis of LSCC patients associates increased SOAT2 expression with reduced immune infiltration and poor prognosis. Mechanically, ex vivo human and mouse Treg cell data and in vivo mouse tumor models suggest that SOAT2 overexpression in Treg cells promotes cholesterol metabolism by activating the SREBP2-HMGCR-GGPP pathway, leading to enhanced Treg suppresser functions but reduced CD8+ T cell proliferation, migration, homeostasis and anti-tumor immunity. Our study thus identifies a potential mechanism responsible for altered Treg function in the context of immune aging, and also implicates SOAT2 as a potential target for tumor immunotherapy.


Conflict of interest statement

Competing interests: The authors declare no competing interests.

Figures

Fig. 1
Fig. 1. SOAT2 involved in immune infiltration predicts poor prognosis in elderly patients with lung squamous carcinoma.
A Kaplan-Meier survival curves of LSCC patients grouped by age (The Old ≥ 65-year-old, n = 293; The Young <65-year-old, n = 166) in TCGA-LSCC cohort. B, C The infiltration of immune (B) and stromal (C) cells in the old and young populations. D, E Kaplan–Meier curves depicted Overall Survival in the old and young populations with high infiltration of immune (The Old: n = 149, The Young: n = 80) (D) and stromal (The Old: n = 151, The Young: n = 78) (E) cells. F, G Kaplan–Meier curves depicted Overall Survival in the old and young populations with low infiltration of immune (The Old: n = 144, The Young: n = 86) (D) and stromal (The Old: n = 142, The Young: n = 88) cells. H Venn diagram for screening differentially expressed genes in elderly patients based on tumor microenvironment immune and stromal cell infiltration differences. I Cox proportional hazards regression analysis showed 6 differentially expressed genes were related to elderly LSCC patient’s prognosis (n = 459). J The gene set enrichment analysis indicated SOAT2 related signaling network. K, L The relative mRNA expression of SOAT2 was interrogated in the blood (K, Age 20–29: n = 29, 30–39: n = 19, 40–49: n = 48, 50–59: n = 81, 60–69: n = 78) and spleens (L, Age 20–29: n = 9, 30–39: n = 12, 40–49: n = 26, 50–59: n = 34, 60–69: n = 16) with different age in GTEx data. M The mRNA expression of SOAT2 was interrogated in the old and young populations by GSE62627 database (The Young: n = 13, The Old: n = 13). Data represented means ± SD. Statistical difference was evaluated by unpaired two-tailed student’s t-test (B, C, M), and one-way ANOVA test (K, L). Source data are provided as a Source Data file. (*P value < 0.05; **P < 0.01; ns no significance).
Fig. 2
Fig. 2. Overview of the radiomics design.
A The training cohort: 143 Patients from the TCIA database were assigned to the training cohort, and 3 features with prognostic value were obtained. B The validation cohort: 33 Patients from the TCGA database were assigned to the validation cohort, and were evaluated whether the clinical features and risk score were independent of other radiomic features. C The analysis cohort: 46 patients from the First Affiliated Hospital of Nanjing Medical University were incorporated into the analysis. SOAT2 expression that predicts prognostic value in LSCC patients was validated in the independent cohort.
Fig. 3
Fig. 3. SOAT2 promotes LSCC growth in old immunocompetent mice.
A Schematic design for screening the old mice with SOAT2high or SOAT2low, and the young mice with SOAT2low (Created in BioRender. Major, Z. (2023) https://BioRender.com/l79u279). B The mRNA expression of SOAT2 in the young and old mice PBMCs was monitored by quantitative RT-PCR using gene-specific primers and probes (n = 20). C, D The protein expression of SOAT2 in the young and old mice PBMCs was monitored by western blotting analysis (C); quantitation of SOAT2 protein concentrations was shown (n = 20) (D). EG The KLN-205 cells allograft-bearing model (n = 5). The tumor growth curves (E), representative images of subcutaneous tumors (F), and tumor weight (G) in indicated groups. H Representative immunohistochemical staining of ki67, SOAT2, FOXP3, and CD8 in the tumor nodules in indicated groups. scale bars: 2000 and 50 μm. I, J quantitation of ki67 (I); the correlation of SOAT2 with ki67 expression was shown (n = 5) (J). KM Quantitation of FOXP3 integratedoption density (IntDen) and FOXP3-positive cells (K); the correlation of FOXP3-IntD and FOXP3-positive cells with SOAT2 expression were shown (n = 5) (L, M). N, O Quantitation of FOXP3 average optical density (AOD) (N); the correlation of FOXP3-AOD with SOAT2 expression was shown (n = 5) (O). PR Quantitation of CD8-IntDen and FOXP3-positive cells (P); the correlation of CD8-IntD and CD8-positive cells with SOAT2 expression were shown (n = 5) (Q, R). S, T Quantitation of CD8 average optical density (AOD) (S); the correlation of FOXP3-AOD with SOAT2 expression were shown (n = 5) (T). Data represented means ± SD. Statistical difference was evaluated by unpaired two-tailed student’s t-test (B, D), and one-way ANOVA test (E, G, I, K, N, P, S). Source data are provided as a Source Data file. (**P < 0.01; ***P < 0.001; ns no significance).
Fig. 4
Fig. 4. SOAT2 specifically expresses in Treg cells in aged individuals.
A Diagram of murine CD4+CD25+, CD4+CD25- T or CD4- lymphocytes isolated by magnetic bead sorting from LSCC tumor tissue and spleen samples (Created in BioRender. Major, Z. (2024) https://BioRender.com/u18t594). B, C The proteins extracted from tumor (B) and spleen (C) Lymphocyte subsets in indicated groups were assessed by Western blotting analysis. The experiment was repeated 3 times independently with similar results. D, E The SOAT2 expression was assessed in tumor and spleen CD4+CD25+ T lymphocytes by flow cytometry assay (D); quantitation of SOAT2 expression was shown (n = 5) (E). F, G The SOAT2 expression was assessed in tumor and spleen CD4+CD25-&CD4- T lymphocytes by flow cytometry assay (F); quantitation of SOAT2 expression was shown (n = 5) (G). H Diagram of human CD4+CD25+ T lymphocytes, CD4+CD25- T or CD4- lymphocytes isolated by magnetic bead sorting from blood samples (Created in BioRender. Major, Z. (2024) https://BioRender.com/w00f660). I, J The mRNA and protein expression of SOAT2 in indicated groups were detected by quantitative RT-PCR (I) and Western blotting (J, The experiment was repeated 3 times independently with similar results) analysis. Data represented means ± SD. Statistical difference was evaluated by unpaired two-tailed student’s t-test (E, G), and one-way ANOVA test (I). Source data are provided as a Source Data file. (*P < 0.05; ***P < 0.001; ns no significance).
Fig. 5
Fig. 5. SOAT2 enhances survival and chemotaxis but decreases proliferation and stability of Treg cells.
AD Ki-67 staining in indicated groups was analyzed by flow cytometry to measure lymphocyte proliferation (A, C); quantitation of Ki67 of Max (%) was shown (n = 5) (B, D). E, F The apoptotic Treg cells in indicated groups were analyzed by flow cytometry with 7-AAD and PE-Annexin V staining; the percentage of apoptotic Treg cells in indicated groups were shown (n = 3). G, H The migration of Treg cells in indicated groups were detected by transwell assays (n = 5). I, J FOXP3 staining in indicated groups was analyzed by flow cytometry to measure Treg cells stability. K The differentiation ability of naive CD4+ T cells to CD4+CD25+FOXP3+ T lymphocytes sorted in indicated groups under Treg polarizing conditions was detected by flow cytometry assay. Data represented means ± SD. Statistical difference was evaluated by one-way ANOVA test (B, D, E, F, G, H). Source data are provided as a Source Data file. (*P < 0.05; **P < 0.01; ***P < 0.001).
Fig. 6
Fig. 6. SOAT2 promotes tumor growth through Treg-mediated immunosuppression.
AC Treg cells were co-cultured with CFSE-labeled CD8+ T lymphocytes at a 0.2:1 ratio in indicated groups, and CD8+ T lymphocytes proliferation expansion was detected by flow cytometry assay (A); quantitation of CFSELow (%) was shown (n = 3) (B, C). DI Treg cells were co-cultured with CD8+ T lymphocytes at a 0.2:1 ratio in indicated groups, and the release of CD8+ T lymphocytes for granzyme B and perforin were detected by ELISPOT assay (D, G); quantitation of granzyme B (E, H) and perforin (F, I) were shown (biological replicate, n = 3). J, K Treg cells were co-cultured with CD8+ T lymphocytes at a 0.2:1 ratio in indicated groups, and the release of CD8+ T lymphocytes for granzyme B and perforin were detected by ELISA assay; quantitation of granzyme B and perforin were shown (n = 3). L, M Treg cells were co-cultured with CD8+ T lymphocytes at a 0.2:1 ratio in indicated groups, and Teff-mediated cytoxicity was determined by LDH release assay using a cytotoxicity detection kit (n = 5). Data represented means ± SD. Statistical difference was evaluated by one-way ANOVA test (B, C, E, F, H, I, J, K, L, M). Source data are provided as a Source Data file. (*P < 0.05; **P < 0.01; ***P < 0.001).
Fig. 7
Fig. 7. SOAT2 induces Teffs cellular senescence via competitive cholesterol metabolism of Treg cells.
AC Representative images of Teffs stained for β-galactosidase (arrows) after co-cultured with Treg cells (n = 3) (A), scale bars: 50 μm; quantitation of β-galactosidase-positive Teffs were shown (B, C). DF The protein expression of P16, P21, P53 in Teff cells in the young and old individuals were monitored by western blotting analysis in indicated groups. The experiment was repeated 3 times independently with similar results. GJ, Treg cells were co-cultured with CD8+ T lymphocytes at a 0.2:1 ratio in indicated groups, and the expression of CD27 or CD28 in human Teffs (G, H) and murine Teffs (I, J) were detected by flow cytometric analysis (n = 3). K Schematic representation of Treg cells exerts immunosuppressive path on Teffs (Created in BioRender. Major, Z. (2024) https://BioRender.com/s68z662). L, M The content of cholesterol components were measured by the Cholesterol Assay Kit in indicated groups (n = 5). NP Representative images of Teffs stained for β-galactosidase (arrows) after co-cultured with Treg cells (N), scale bars: 50 μm; quantitation of β-galactosidase-positive Teffs were shown (n = 3) (O, P). Data represented means ± SD. Statistical difference was evaluated by one-way ANOVA test (B, C, L, M, O, P). Source data are provided as a Source Data file. (*P < 0.05; **P < 0.01; ***P < 0.001).
Fig. 8
Fig. 8. SOAT2 promotes cholesterol metabolism in Treg cells by activating the SREBP2-HMGCR-GGPP pathway.
A Schematic representation of SOAT2 affects cholesterol metabolism through regulating SREBP2-HMGCR-GGPP pathway. B, C The content of free cholesterol components were measured by the Cholesterol Assay Kit in indicated groups (n = 5). D, E The proteins extracted from human or murine Treg cells in indicated groups were assessed by Western blotting analysis. The experiment was repeated 3 times independently with similar results. F, G The content of free cholesterol components were measured by the Cholesterol Assay Kit in indicated groups (n = 5). H The proteins extracted from human or murine Treg cells in indicated groups were assessed by Western blotting analysis. The experiment was repeated 3 times independently with similar results. Data represented means ± SD. Statistical difference was evaluated by one-way ANOVA test (B, C, F, G). Source data are provided as a Source Data file. (**P < 0.01; ***P < 0.001; ns no significance).
Fig. 9
Fig. 9. Excessive suppression of cholesterol promotes tumor growth in elderly mice.
A Schematic design of the KLN-205 cells allograft model. Four groups: PBS, low-dose simvastatin (2.5 mg/kg), medium-dose simvastatin (25 mg/kg), and high-dose simvastatin (50 mg/kg) (n = 5) (Created in BioRender. Major, Z. (2024) https://BioRender.com/z47q423). B The content of plasm cholesterol components were measured by the Cholesterol Assay Kit in the four groups. C The content of total cholesterol, free cholesterol, and cholesterol ester components in the Tregs were measured by the Cholesterol Assay Kit in the four groups. D The mRNA expression of SOAT2 in the intratumoral Tregs was monitored by quantitative RT-PCR using gene-specific primers and probes. EG Representative images of subcutaneous tumors (E), tumor volume (F), and tumor weight (G) in indicated groups. H The mechanism of SOAT2 exerts immunosuppression in elderly LSCC patients (Created in BioRender. Major, Z. (2022) https://BioRender.com/f54k103). Data represented means ± SD. Statistical difference was evaluated by one-way ANOVA test (B, C, D, F, G). Source data are provided as a Source Data file. (*P < 0.05; **P < 0.01; ***P < 0.001; ns no significance).

References

    1. Sung, H. et al. Global cancer statistics 2020: GLOBOCAN estimates of incidence and mortality worldwide for 36 cancers in 185 countries. CA Cancer J. Clin.71, 209–249 (2021). - PubMed
    1. Siegel, R. L., Miller, K. D., Fuchs, H. E. & Jemal, A. Cancer statistics, 2022. CA Cancer J. Clin.72, 7–33 (2022). - PubMed
    1. Socinski, M. A. et al. Current and emergent therapy options for advanced squamous cell lung cancer. J. Thorac. Oncol.13, 165–183 (2018). - PubMed
    1. Burton, D. G. A. & Stolzing, A. Cellular senescence: immunosurveillance and future immunotherapy. Ageing Res. Rev.43, 17–25 (2018). - PubMed
    1. Lian, J., Yue, Y., Yu, W. & Zhang, Y. Immunosenescence: a key player in cancer development. J. Hematol. Oncol.13, 151 (2020). - PMC - PubMed

MeSH terms

Substances