

Investigating misclassification of type 1 diabetes in a population-based cohort of British Pakistanis and Bangladeshis using polygenic risk scores
- PMID: 39805939
- PMCID: PMC11729895
- DOI: 10.1038/s41598-024-80348-8
Investigating misclassification of type 1 diabetes in a population-based cohort of British Pakistanis and Bangladeshis using polygenic risk scores
Abstract
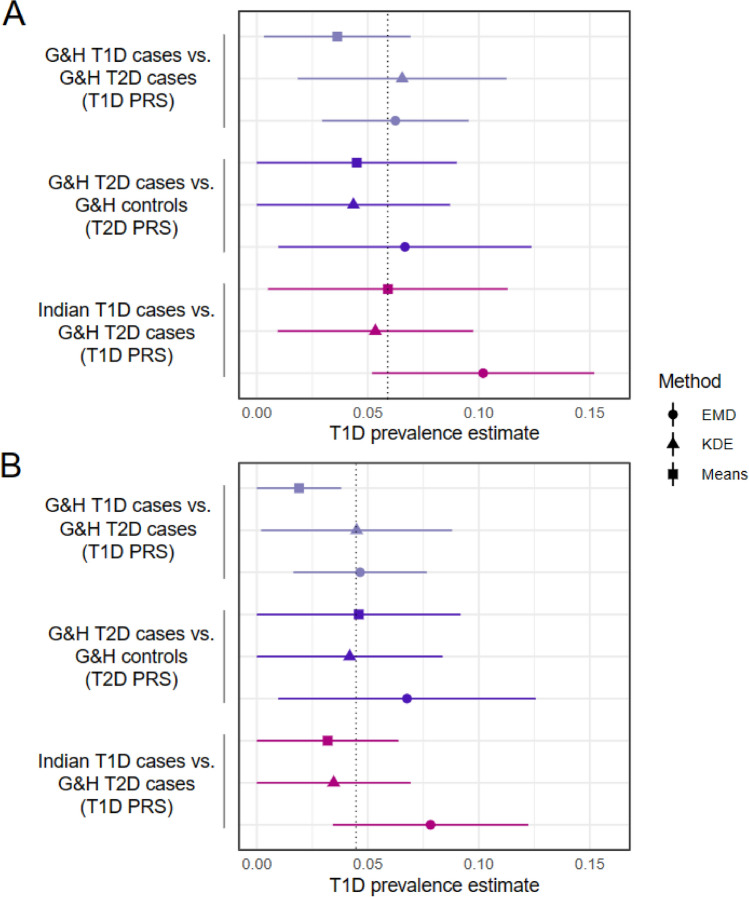
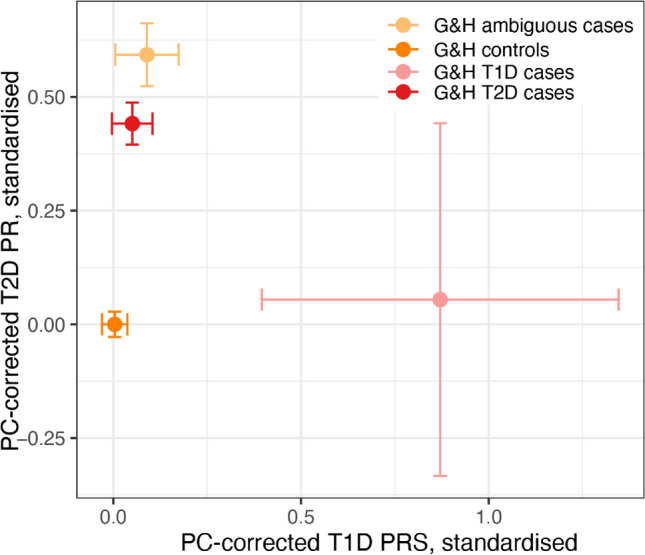
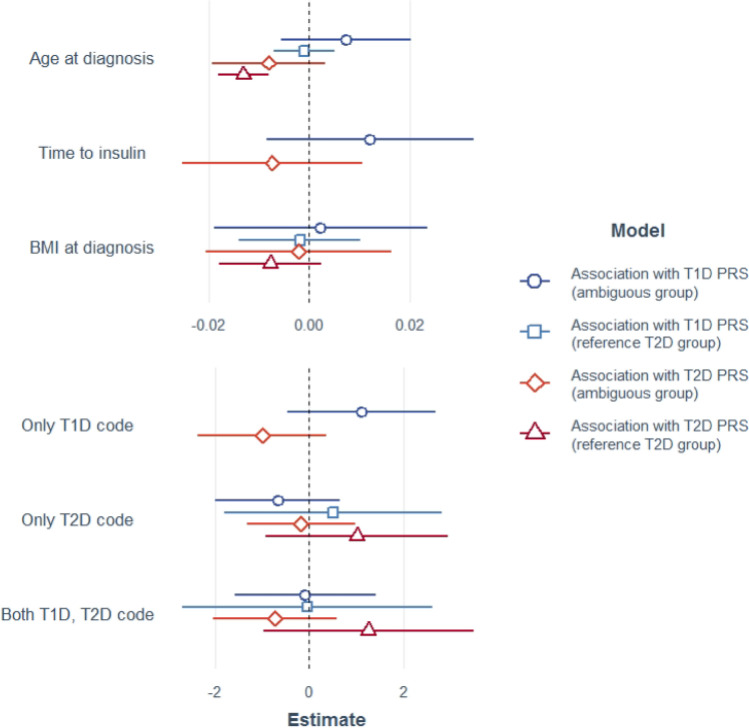
Correct classification of type 1 (T1D) and type 2 diabetes (T2D) is challenging due to overlapping clinical features and the increasingly early onset of T2D, particularly in South Asians. Polygenic risk scores (PRSs) for T1D and T2D have been shown to work relatively well in South Asians, despite being derived from largely European-ancestry samples. Here we used PRSs to investigate the rate of potential misclassification of diabetes amongst British Bangladeshis and Pakistanis. Using linked health records from the Genes & Health cohort (n = 38,344) we defined two reference groups meeting stringent diagnostic criteria: 31 T1D cases, 1842 T2D cases, and after excluding these, two further groups: 839 insulin-treated diabetic individuals with ambiguous features and 5174 non-diabetic controls. Combining these with 307 confirmed T1D cases and 307 controls from India, we calculated ancestry-corrected PRSs for T1D and T2D, with which we estimated the proportion of T1D cases within the ambiguous group at ~ 6%, dropping to ~ 4.5% within the subset who had T2D codes in their health records (and are thus most likely to have been misclassified). We saw no significant association between the T1D or T2D PRS and BMI at diagnosis, time to insulin, or the presence of T1D or T2D diagnostic codes amongst the T2D or ambiguous cases, suggesting that these clinical features are not particularly helpful for aiding diagnosis in ambiguous cases. Our results emphasise that robust identification of T1D cases and appropriate clinical care may require routine measurement of diabetes autoantibodies and C-peptide.
© 2024. The Author(s).
Conflict of interest statement
Declarations. Competing interests: SF and HCM have received salary contributions via the Genes & Health Industry Consortium of AstraZeneca PLC, Bristol-Myers Squibb Company, GlaxoSmithKline Research and Development Limited, Maze Therapeutics Inc, Merck Sharp & Dohme LLC, Novo Nordisk A/S, Pfizer Inc, Takeda Development Centre Americas Inc. ML has received speaker’s fees from Medtronic and Insulet. Other authors declare no competing interests.
Figures
References
-
- Classification of diabetes mellitus. https://www.who.int/publications/i/item/classification-of-diabetes-mellitus (2019).
-
- American Diabetes Association. 2 Classification and diagnosis of diabetes: Standards of medical care in diabetes-2021. Diabetes Care44, S15–S33 (2021). - PubMed
-
- de Lusignan, S. et al. Miscoding, misclassification and misdiagnosis of diabetes in primary care. Diabet. Med.29, 181–189 (2012). - PubMed
Publication types
MeSH terms
Supplementary concepts
Grants and funding
LinkOut - more resources
Full Text Sources
Medical
