. 2025 Jan;7(1):166-181.
doi: 10.1038/s42255-024-01185-7. Epub 2025 Jan 13.

Longitudinal serum proteome mapping reveals biomarkers for healthy ageing and related cardiometabolic diseases

Affiliations

Longitudinal serum proteome mapping reveals biomarkers for healthy ageing and related cardiometabolic diseases

Jun Tang et al. Nat Metab. 2025 Jan.

Abstract

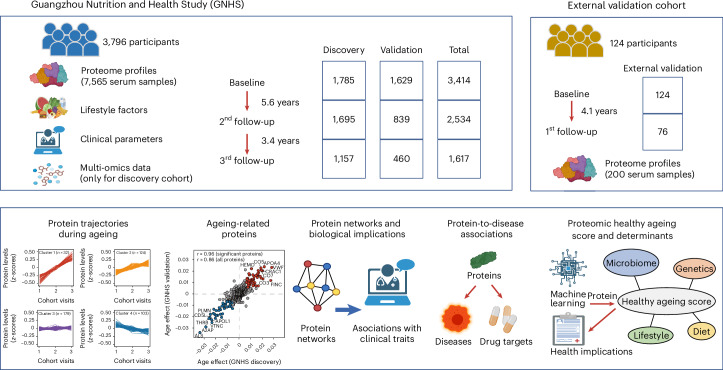
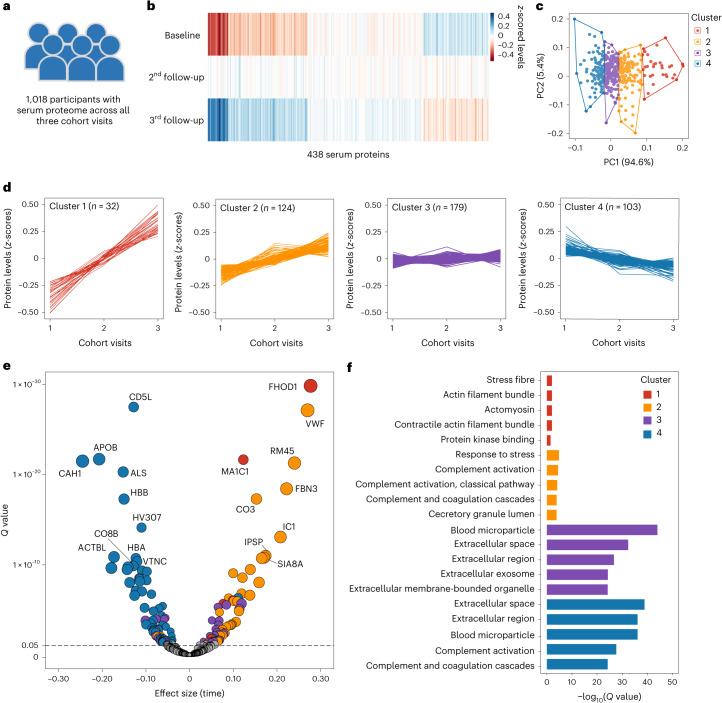
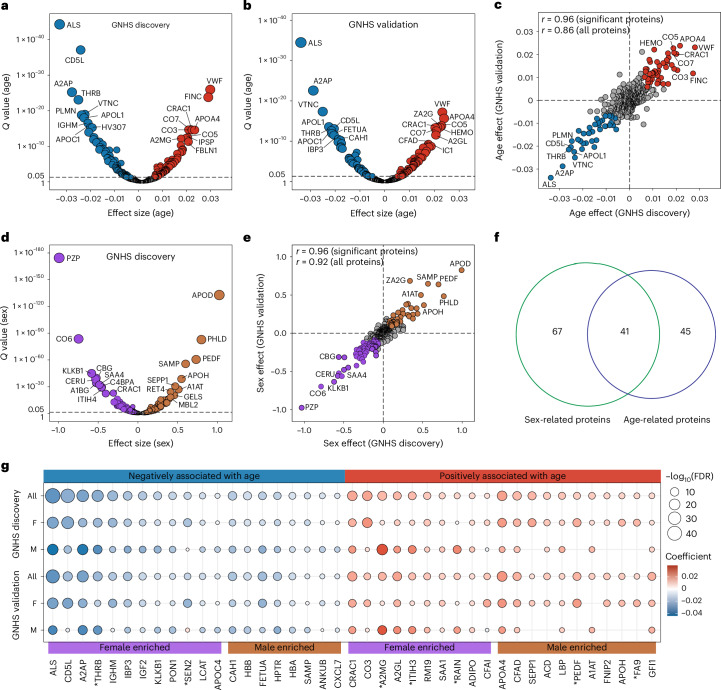
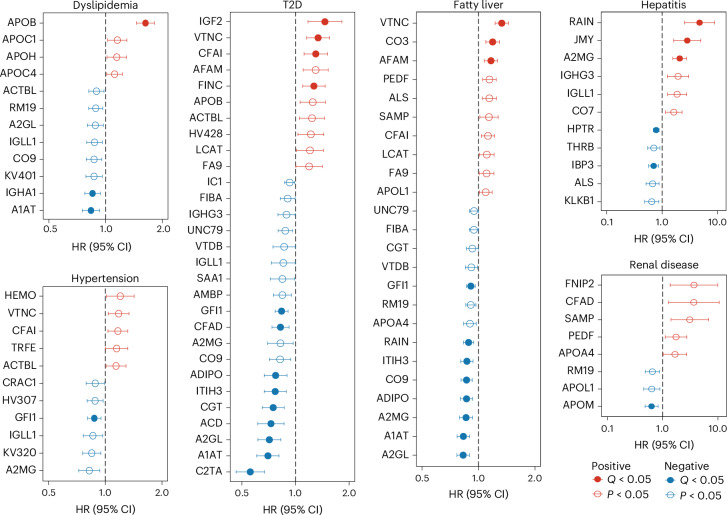
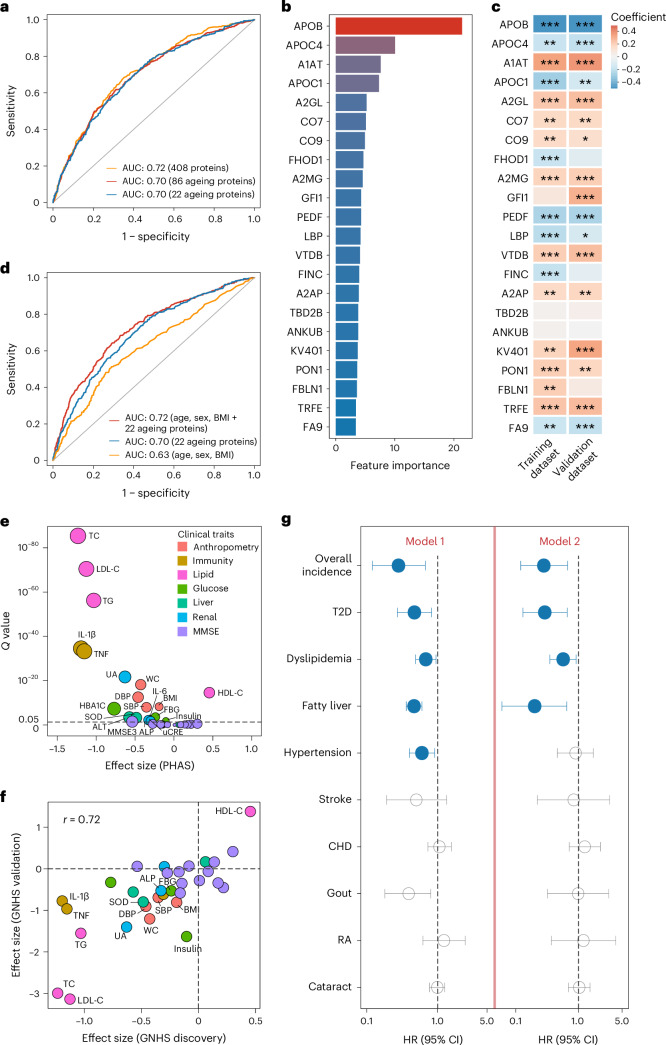
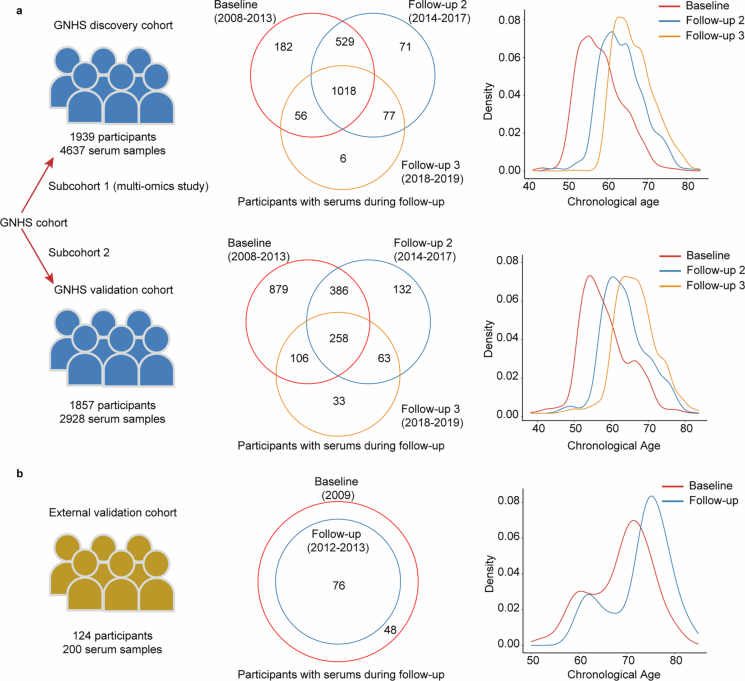
The blood proteome contains biomarkers of ageing and age-associated diseases, but such markers are rarely validated longitudinally. Here we map the longitudinal proteome in 7,565 serum samples from a cohort of 3,796 middle-aged and elderly adults across three time points over a 9-year follow-up period. We pinpoint 86 ageing-related proteins that exhibit signatures associated with 32 clinical traits and the incidence of 14 major ageing-related chronic diseases. Leveraging a machine-learning model, we pick 22 of these proteins to generate a proteomic healthy ageing score (PHAS), capable of predicting the incidence of cardiometabolic diseases. We further identify the gut microbiota as a modifiable factor influencing the PHAS. Our data constitute a valuable resource and offer useful insights into the roles of serum proteins in ageing and age-associated cardiometabolic diseases, providing potential targets for intervention with therapeutics to promote healthy ageing.


Conflict of interest statement

Competing interests: T.G. is a shareholder of Westlake Omics. The other authors declare no competing interests.

Figures

Fig. 1
Fig. 1. Overview of longitudinal cohorts and analysis workflow.
The present study included 3,796 individuals from the GNHS, with 7,565 serum samples collected across three time points over a 9-year follow-up period. We separated the participants into the GNHS discovery cohort, which included 4,637 serum samples of 1,939 participants from a multi-omics subcohort within GNHS, and the GNHS validation cohort, which included 2,928 serum samples from the remaining 1,857 participants. We performed analyses by integrating lifestyle, clinical and multi-omics data into the GNHS. We also recruited 124 participants with 200 serum samples collected at two visits during a 4-year follow-up period, which was set as the external validation cohort.
Fig. 2
Fig. 2. Longitudinal trajectories of serum proteome during follow-up in the middle-aged and elderly participants.
a, A total of 1,018 participants from the GNHS discovery cohort with serum proteome data at all three cohort visits were included in this analysis. b, Heatmap of the mean z-scored levels of the 438 serum proteins among the 1,018 participants across three cohort visits. c, k-means clustering identified four clusters of the changes in 438 serum proteins across three time points among the 1,018 participants. The optimal number of clusters was determined using the elbow method by calculating the sum of squared errors. d, Line plots of the mean z-scored levels of proteins at three time points within each of the four identified clusters. e, Volcano plot for the trend of changes in 438 serum proteins during follow-up. Proteins with significant trends are highlighted in different colours: red for cluster 1, yellow for cluster 2, purple for cluster 3 and blue for cluster 4. Note that fibronectin (FINC) (β = 0.455, Q = 5.34 × 10−73) is not displayed owing to its extremely high Q value. Detailed results are presented in Supplementary Table 3. The horizontal dashed line represents the cutoff Q value of 0.05. Dots (proteins) positioned above this line are considered significant, while those below are not significant. f, Top five enriched GO terms or pathways based on Q values for proteins from each of the four clusters. Functional enrichment analysis was conducted using GO, Reactome, KEGG and WikiPathways databases. All enriched GO terms and pathways are listed in Supplementary Table 4. Source data
Fig. 3
Fig. 3. Identification of ageing-related proteins using longitudinal data.
a,b, Volcano plots showing the associations between age and serum proteins using linear mixed models adjusted for sex, measurement batch and instrument in the GNHS discovery cohort comprising 1,939 participants with 4,637 serum samples (a) and the GNHS validation cohort comprising 1,857 participants with 2,928 serum samples (b). Red (positive) and blue (negative) dots represent proteins significantly associated with age (FDR < 0.05). The top ten positive and negative proteins based on Q values are labelled. Detailed results are presented in Supplementary Table 5. c, Comparison of the associations between age and serum proteins in the GNHS discovery cohort and GNHS validation cohort. Pearson’s correlation coefficient (r) for the associations between the two cohorts is indicated. Red (positive) and blue (negative) dots represent significant proteins (FDR < 0.05) in both cohorts. d, Volcano plot showing the associations between sex and serum proteins using linear mixed models adjusted for age, measurement batch and instrument in the GNHS discovery cohort. Brown (positive) and purple (negative) dots represent proteins significantly associated with sex (male versus female) (FDR < 0.05). The top ten positive and negative proteins based on Q values are labelled. Detailed results are presented in Supplementary Table 5. The horizontal dashed line in a, b and d represents the cutoff Q value of 0.05. Dots (proteins) positioned above this line are considered significant, while those below are not significant. e, Comparison of the associations between sex and serum proteins in the GNHS discovery cohort and GNHS validation cohort. Pearson’s correlation coefficient (r) for the associations between the two cohorts is indicated. Brown (positive) and purple (negative) dots represent significant proteins (FDR < 0.05) in both cohorts. The grey circles represent proteins that were not significantly associated with sex in either the GNHS discovery cohort or the GNHS validation cohort. f, Overlap of 41 ageing-related and sex-related proteins. Overlapped proteins are listed in Supplementary Table 6. g, Subgroup analyses for the 41 proteins that were associated with both age and sex. The circle colour scale indicates the degree and direction of the associations between age and proteins, and the circle size scale indicates the significance of the associations. Only significant associations (FDR < 0.05) are presented. Proteins showing a significant interaction by age and sex (FDR < 0.05) in both the GNHS discovery and validation cohorts are marked with an asterisk. F, female; M, male. Detailed results are presented in Supplementary Table 5. Source data
Fig. 4
Fig. 4. Functional networks of ageing-related proteins and their longitudinal associations with clinical traits.
a, Four functional networks of ageing-related proteins identified by IPA. Red and blue dots represent gene names for proteins (Supplementary Table 2) that were positively and negatively associated with age (FDR < 0.5), respectively. b, Top five enriched GO terms or pathways based on Q values for ageing-related proteins from each of the four functional networks. All enriched GO terms and pathways are listed in Supplementary Table 7. c, Heatmap showing the longitudinal associations between 86 ageing-related proteins and 32 clinical traits in the GNHS discovery cohort (1,939 participants with 4,637 observations during follow-up), analysed by using linear mixed model adjusted for age, sex, measurement batch and instrument. Only significant associations are indicated (FDR < 0.05). The colour scale indicated the degree and direction of the associations. On the right side, the bar plot indicates the number of significant associations that were validated in the GNHS validation cohort (FDR < 0.05), and the line chart indicates the Pearson correlation for the associations between GNHS discovery and validation cohorts. BMI, body mass index; WC, waist circumference; SBP, systolic blood pressure; DBP, diastolic blood pressure; HDL-C, high-density lipoprotein cholesterol; LDL-C, low-density lipoprotein cholesterol; TG, triglycerides; TC, total cholesterol; FBG, fasting blood glucose; HbA1c, haemoglobin A1c; IL-1β, interleukin-1β; IL-6, interleukin-6; TNF, tumour necrosis factor; ALT, alanine transaminase; AST, aspartate aminotransferase; SOD, superoxide dismutase; ALP, alkaline phosphatase; UA, urine acid; uCRE, urine creatinine; MMSE, Mini-Mental State Examination; MMSE1, immediate orientation; MMSE2, spatial orientation; MMSE3, temporal memory; MMSE4, attention; MMSE5, delayed recall, MMSE6, naming; MMSE7, verbal repetition; MMSE8, reading; MMSE9, verbal comprehension; MMSE10, writing; MMSE11, constructional praxis. Detailed results are presented in Supplementary Tables 8 and 9. Source data
Fig. 5
Fig. 5. Prospective associations between ageing-related proteins and incident chronic diseases.
Prospective associations between ageing-related proteins and the risk of incident dyslipidemia, hypertension, T2D, fatty liver, hepatitis and renal diseases in the entire GNHS cohort (n = 3,414). The Cox proportional hazards model was used with adjustment for age, sex, BMI, subcohort and presence of chronic diseases at baseline. The dots and horizontal lines represent hazard ratios (HRs) and corresponding 95% confidence intervals (CIs), respectively. Two-sided P values were calculated, and Q values were estimated using the Benjamini–Hochberg approach to control for multiple testing. Detailed results are presented in Supplementary Table 10. Source data
Fig. 6
Fig. 6. Ageing-related proteins as indicators of cardiometabolic health.
a, Performance of the random forest models using 408 serum proteins, 86 ageing-related proteins and the top 22 ageing-related proteins in discriminating between healthy and unhealthy participants in the validation dataset (n = 1,629). b, Top 22 important proteins identified for the final random forest model by tenfold cross-validation, with feature importance measured by mean decrease accuracy. c, Associations between the top 22 proteins and healthy status (yes or no) by linear models in the training (n = 1,785) and validation dataset (n = 1,629). *Q value < 0.05; **Q value < 0.01; ***Q value < 0.001. See Supplementary Table 12 for details. d, Performance of the random forest models using intrinsic factors (age, sex and BMI), top 22 ageing-related proteins and their combination in discriminating between healthy and unhealthy participants in the validation dataset (n = 1,629). e, Longitudinal association between PHAS and 32 clinical traits in the GNHS discovery cohort (1,939 participants with 4,637 observations during follow-up) by linear mixed model adjusted for age and sex. Significant associations (FDR < 0.05) are labelled. f, Comparison of associations between PHAS and 32 clinical traits in the GNHS discovery cohort and GNHS validation cohort (1,857 participants with 2,928 observations during follow-up). Pearson correlation coefficient (r) for the associations between the two cohorts is indicated. Significant associations (FDR < 0.05) in both two cohorts are labelled. Detailed results are presented in Supplementary Table 13. g, Prospective associations between baseline PHAS (per 1 s.d. increase) and incidences of chronic diseases in the entire GNHS cohort (n = 3,414) using Cox proportional hazards model 1 adjusted for age, sex, BMI and subcohort, and model 2 further adjusted for baseline disease status. The dots and horizontal lines represent HRs and corresponding 95% CIs, respectively. Detailed results are presented in Supplementary Table 14. CHD, coronary heart disease; RA, rheumatoid arthritis. Source data
Fig. 7
Fig. 7. Determinants of PHAS and its comprising proteins.
a, Variance of the whole set of 22 serum proteins and the PHAS explained by indicated factor groups among 1,325 participants who had multi-omics data available from the GNHS discovery cohort. The explained variance of the 22 serum proteins was estimated by using PERMANOVA with backward feature selection. The explained variance of PHAS was estimated by using linear models including variables selected by the LASSO method. Detailed results are presented in Supplementary Table 15. b, Variance of each of the 22 serum proteins explained by the indicated factor groups among the 1,325 participants, estimated by using linear regressions including variables selected by the LASSO method. Detailed results are presented in Supplementary Table 16. c, Associations between PHAS and each of the 18 microbial species that contributed to the variance explanation of PHAS among the 1,325 participants. Linear models were used with adjustments for age, sex and BMI. The y axis indicates two-sided P values. Q values were estimated using the Benjamini–Hochberg approach. Red and blue circles represent significant positive and negative associations at Q < 0.05. Detailed results are presented in Supplementary Table 17. The grey circles represent microbial species that were not associated with PHAS (Q value ≥ 0.05). d,e, Associations between PHAS and gut microbial score in the GNHS discovery cohort (n = 1,325) (d) and the external validation cohort (n = 34) (e). Linear models were used with adjustments for age, sex and BMI. The red lines represent the fitted linear association, and the shaded regions represent 95% CIs. Two-sided P values are indicated. Source data
Extended Data Fig. 1
Extended Data Fig. 1. Serum samples and age distribution of study participants.
a, 4637 serum samples of 1939 participants in the GNHS discovery cohort and 2928 serum samples of 1857 participants in the GNHS validation cohort, and participants’ age distribution over 9 years’ follow-up. b, 200 serum samples of 124 participants and their age distribution over 4 years’ follow-up in the external validation cohort.
Extended Data Fig. 2
Extended Data Fig. 2. Protein trajectories in subgroups of participants stratifies by sex and baseline age.
Line plots of the mean z-scored levels of proteins across three follow-up time points within each of the four clusters by subgroups: a, females, b, males, c, participants with baseline age ≤ 60 years, and d, participants with baseline age > 60 years.
Extended Data Fig. 3
Extended Data Fig. 3. External validation for ageing-related proteins and performance of ageing-related proteins to predict age.
a, Volcano plot for the associations between age and the 86 serum proteins (identified as significant in both GNHS discovery cohort and GNHS validations cohort) by linear mixed models adjusted for sex, measurement batch and instrument in the external validation cohort (124 participants with 200 serum samples). Red (positive) and blue dots (negative) represent serum proteins that are significantly associated with age (FDR < 0.05). b, Comparison of the associations between age and the 86 proteins in the GNHS discovery cohort and external validation cohort. The Pearson correlation coefficient (r) for the associations between the two cohorts is indicated. Red (positive) and blue dots (negative) represent serum proteins that are significantly associated with age in both two cohorts (FDR < 0.05). c-e, Performance of the GLMMLasso model using 83 proteins to predict age within the remaining GNHS discovery cohort (1583 observations) (c), the GNHS validation cohort (2928 observations) (d), and the external validation cohort (200 observations) (e). The Pearson correlation coefficient (r) between the chronological and predicted age are indicated.
Extended Data Fig. 4
Extended Data Fig. 4. Upstream regulators of ageing-related proteins and longitudinal associations between 86 ageing-related proteins and 32 clinical traits in GNHS validation cohort.
a,b Top two upstream regulators, namely the hepatocyte nuclear factor 1-alpha (HNF1A) (a) and interleukin-6 (IL-6) (b) for ageing-related proteins by Ingenuity Pathway Analysis. Red and blue dots represent gene names for proteins that were positively and negatively associated with age, respectively. c, Heatmap showing the longitudinal associations between 86 ageing-related proteins and 32 clinical traits in the GNHS validation cohort (1857 participants with 2928 observations), analyzed by using linear mixed model adjusted for age, sex, measurement batch and instrument. Only significant associations are indicated (FDR < 0.05). The color scale indicated the degree and direction of the associations. BMI, body mass index; WC, waist circumference; SBP, systolic blood pressure; DBP, diastolic blood pressure; HDL-C, high-density lipoprotein cholesterol; LDL-C, low-density lipoprotein cholesterol; TG, triglycerides; TC, total cholesterol; FBG, fasting blood glucose; HbA1c, hemoglobin A1c; IL-1β, interleukin-1β; IL-6, interleukin-6; TNF, tumor necrosis factor; ALT, alanine transaminase; AST, aspertate aminotransferase; SOD, superoxide dismutase; ALP, Alkaline phosphatase; UA, urine acid; uCRE, urine creatinine; MMSE, Mini-mental State Examination; MMSE1, immediate orientation; MMSE2, spatial orientation; MMSE3, temporal memory; MMSE4, attention; MMSE5, delayed recall, MMSE6, naming; MMSE7, verbal repetition; MMSE8, reading; MMSE9, verbal comprehension; MMSE10, writing; MMSE11, constructional praxis.
Extended Data Fig. 5
Extended Data Fig. 5. Hierarchical clustering for the nominally significant prospective associations between ageing-related proteins and risk of 14 chronic diseases.
The prospective associations were investigated using a Cox proportional hazards model adjusted for age, sex, BMI, subcohort, and presence of chronic diseases at baseline. Hierarchical clustering identified a total of eight protein clusters based on their nominally significant associations with the 14 chronic diseases. T2D: type 2 diabetes; CHD: coronary heart disease; RA: rheumatoid arthritis; HR: hazard ratio.
Extended Data Fig. 6
Extended Data Fig. 6. Performance of random forest models trained by random subsets of 22 proteins.
We trained 10 random forest models, each utilizing a random subset of 22 proteins selected from the common pool of 408 proteins. The performances of these random forest models were evaluated by calculating the area under the receiver operating characteristic curve (AUC). Differences in performance between the random forest models were tested by DeLong test. The P values comparing the model using the top 22 ageing-related proteins to those using random subsets 1 to 10 were 8.38×10⁻¹¹, 1.44×10⁻⁴, 2.10×10⁻¹⁴, 1.32×10⁻⁵, 1.55×10⁻¹², 1.42×10⁻², 2.61×10⁻¹², 3.25×10⁻⁷, 2.06×10⁻¹⁰, and 2.02×10⁻⁵, respectively.
Extended Data Fig. 7
Extended Data Fig. 7. Performance of the random forest model and the longitudinal associations of PHAS with 14 clinical traits in the external validation cohort.
a, Performance of the random forest model using the top 22 important proteins in discriminating the healthy status of the 124 participants at baseline from the external validation cohort. The area under the receiver operating characteristic curve (AUC) is indicated. b, Longitudinal associations of proteomic healthy ageing score (PHAS) with 14 available clinical traits in the external validation cohort (124 participants with 200 observations during follow-up) by linear mixed models adjusted for age and sex. The 14 clinical traits include BMI, body mass index; WC, waist circumference; HDL-C, high-density lipoprotein cholesterol; LDL-C, low-density lipoprotein cholesterol; TG, triglycerides; TC, total cholesterol; FBG, fasting blood glucose; HbA1c, hemoglobin A1c; Insulin; ALT, alanine transaminase; AST, aspertate aminotransferase; ALP, alkaline phosphatase; UA, urine acid; uCRE, urine creatinine.
Extended Data Fig. 8
Extended Data Fig. 8. Validation of the 22 proteins constructing for proteomic healthy ageing score by MRM-MS-based targeted proteomics in the external validation cohort.
The 22 proteins were measured by the multiple reaction monitoring (MRM)-MS-based targeted proteomics assay in 179 available serum samples from 115 participants in the external validation cohort. a, Spearman’s ρ for the levels of the 22 proteins proteins measured by our primary DIA-MS-based proteomics assay and the MRM-MS-based targeted proteomics assay in the 179 serum samples. b, Performance of the random forest model using the 22 proteins measure by MRM-MS based targeted proteomics in discriminating healthy and unhealthy status of 104 participants at baseline from the external validation cohort. c, Pearson’s correlation of the proteomic healthy ageing scores (PHASs) derived from the 22 proteins measured by DIA-MS-based proteomics and by MRM-MS-based targeted proteomics. MAE, mean absolute error. d. Comparison of the longitudinal associations between 14 clinical trails and the proteomic heathy ageing scores (PHASs) generated by DIA-MS based proteomics and by MRM-MS based targeted proteomics. The longitudinal associations between 14 clinical traits and PHAS were investigated by linear mixed models adjusted for age and sex. The 14 clinical traits include BMI, body mass index; WC, waist circumference; HDL-C, high-density lipoprotein cholesterol; LDL-C, low-density lipoprotein cholesterol; TG, triglycerides; TC, total cholesterol; FBG, fasting blood glucose; HbA1c, hemoglobin A1c; Insulin; ALT, alanine transaminase; AST, aspertate aminotransferase; ALP, alkaline phosphatase; UA, urine acid; uCRE, urine creatinine. The triangles represent clinical traits that displayed significant associations (FDR < 0.05) with PHAS both in our primary analysis using DIA-MS based proteomics and the replicate analyses using MRM-MS-based targeted proteomics within the external validation cohort.

References

    1. Jylhävä, J., Pedersen, N. L. & Hägg, S. Biological age predictors. EBioMedicine21, 29–36 (2017). - PMC - PubMed
    1. Rutledge, J., Oh, H. & Wyss-Coray, T. Measuring biological age using omics data. Nat. Rev. Genet.23, 715–727 (2022). - PMC - PubMed
    1. López-Otín, C., Blasco, M. A., Partridge, L., Serrano, M. & Kroemer, G. The hallmarks of aging. Cell153, 1194–1217 (2013). - PMC - PubMed
    1. López-Otín, C., Blasco, M. A., Partridge, L., Serrano, M. & Kroemer, G. Hallmarks of aging: an expanding universe. Cell186, 243–278 (2023). - PubMed
    1. Campisi, J. et al. From discoveries in ageing research to therapeutics for healthy ageing. Nature571, 183–192 (2019). - PMC - PubMed

LinkOut - more resources