. 2025 Jan;31(1):70-76.
doi: 10.1038/s41591-024-03216-y. Epub 2025 Jan 13.

Ultrasensitive ctDNA detection for preoperative disease stratification in early-stage lung adenocarcinoma

Collaborators, Affiliations

Ultrasensitive ctDNA detection for preoperative disease stratification in early-stage lung adenocarcinoma

James R M Black et al. Nat Med. 2025 Jan.

Abstract

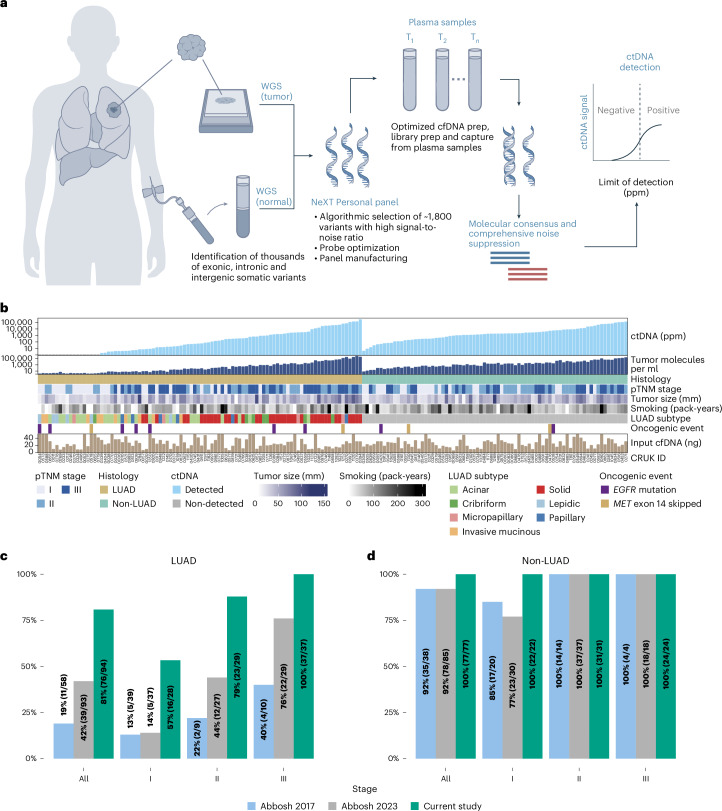
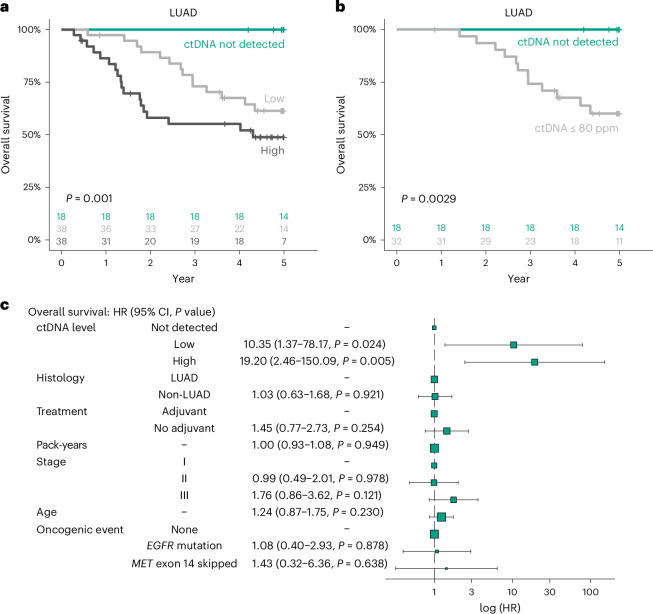
Circulating tumor DNA (ctDNA) detection can predict clinical risk in early-stage tumors. However, clinical applications are constrained by the sensitivity of clinically validated ctDNA detection approaches. NeXT Personal is a whole-genome-based, tumor-informed platform that has been analytically validated for ultrasensitive ctDNA detection at 1-3 ppm of ctDNA with 99.9% specificity. Through an analysis of 171 patients with early-stage lung cancer from the TRACERx study, we detected ctDNA pre-operatively within 81% of patients with lung adenocarcinoma (LUAD), including 53% of those with pathological TNM (pTNM) stage I disease. ctDNA predicted worse clinical outcome, and patients with LUAD with <80 ppm preoperative ctDNA levels (the 95% limit of detection of a ctDNA detection approach previously published in TRACERx) experienced reduced overall survival compared with ctDNA-negative patients with LUAD. Although prospective studies are needed to confirm the clinical utility of the assay, these data show that our approach has the potential to improve disease stratification in early-stage LUADs.


Conflict of interest statement

Competing interests: M.A.B. has consulted for Achilles Therapeutics. D.A.M. reports receiving speaker fees from AstraZeneca, Eli Lilly, Bristol Myers Squibb and Takeda, consultancy fees from AstraZeneca, Thermo Fisher, Takeda, Amgen, Janssen, MIM Software, Bristol Myers Squibb and Eli Lilly and has received educational support from Takeda and Amgen. M.J.-H. has consulted for, and is a member of, the Achilles Therapeutics scientific advisory board (SAB) and steering committee, and has received speaker honoraria from Pfizer, Astex Pharmaceuticals and the Oslo Cancer Cluster. N.M. has received consultancy fees and has stock options in Achilles Therapeutics. C.S. acknowledges grants from AstraZeneca, Boehringer-Ingelheim, Bristol Myers Squibb, Pfizer, Roche-Ventana, Invitae (previously Archer Dx Inc, collaboration in minimal residual disease sequencing technologies), Ono Pharmaceutical and Personalis. He is chief investigator for the AZ MeRmaiD 1 and 2 clinical trials and is the steering committee chair. He is also co-chief investigator of the NHS Galleri trial funded by GRAIL and a paid member of GRAIL’s SAB. He receives consultant fees from Achilles Therapeutics (and is a SAB member), Bicycle Therapeutics (and is a SAB member), Genentech, Medicxi, China Innovation Centre of Roche (formerly Roche Innovation Centre – Shanghai, Metabomed (until July 2022)), Relay Therapeutics (and is a SAB member), Saga Diagnostics (and is a SAB member) and the Sarah Cannon Research Institute. C.S has received honoraria from Amgen, AstraZeneca, Bristol Myers Squibb, GSK, Illumina, MSD, Novartis, Pfizer and Roche-Ventana. C.S. has previously held stock options in Apogen Biotechnologies and GRAIL, and currently has stock options in Bicycle Therapeutics and Relay Therapeutics, and has stock and is a co-founder of Achilles Therapeutics. G.B., C.W.A., S.M.B, R.C., J.H., B.L., J.L., F.C.P.N., J.N., R.M.P. and R.O.C. are employees and stockholders of Personalis. A.M.F. is listed as a co-inventor on a patent application to determine methods and systems for tumor monitoring (PCT/EP2022/077987; ‘Methods and systems for tumour monitoring’). S.V. is a co-inventor on a patent for methods for detecting molecules in a sample (US patent no. 10578620; ‘Methods for detecting molecules in a sample’). M.J.-H. is listed as a co-inventor on a European patent application related to methods to detect lung cancer (PCT/US2017/028013; ‘Methods for lung cancer detection’); this patent has been licensed to commercial entities and, under terms of employment, M.J.-H. is due a share of any revenue generated from such license(s). N.M. holds European patents related to targeting neoantigens (PCT/EP2016/059401; ‘Method for treating cancer’), identifying patient response to immune checkpoint blockade (PCT/EP2016/071471; ‘“Immune checkpoint intervention” in cancer’), determining HLA LOH (PCT/GB2018/052004; ‘Analysis of HLA alleles in tumours and the uses thereof’), and predicting survival rates of patients with cancer (PCT/GB2020/050221; ‘Method of predicting survival rates for cancer patients’). C.S declares a patent application for methods to lung cancer (PCT/US2017/028013); targeting neoantigens (PCT/EP2016/059401); identifying patent response to immune checkpoint blockade (PCT/EP2016/071471); methods for lung cancer detection (US20190106751A1); identifying patients who respond to cancer treatment (PCT/GB2018/051912); determining HLA LOH (PCT/GB2018/052004); predicting survival rates of patients with cancer (PCT/GB2020/050221); and methods and systems for tumor monitoring (PCT/EP2022/077987). C.S. is an inventor on a European patent application (PCT/GB2017/053289) related to assay technology to detect tumor recurrence. This patent has been licensed to a commercial entity, and under their terms of employment, C.S is due a revenue share of any revenue generated from such license(s). The other authors declare no competing interests.

Figures

Fig. 1
Fig. 1. Highly sensitive detection of preoperative ctDNA.
a, The NeXT Personal platform leverages tumor-informed information to achieve ultrasensitive and specific residual and recurrent cancer detection, longitudinal monitoring and therapy monitoring from liquid-biopsy samples. b, Clinicopathological variables relating to preoperative ctDNA detection in patients with NSCLC in the TRACERx study: ctDNA level (ppm tumor fraction); number of tumor molecules per ml plasma; pathological tumor node metastasis (pTNM) stage; NSCLC histology; tumor size (pathology-based tumor size (mm)); cigarette smoking (pack-years); pathological subtype of LUAD; presence of an oncogenic event (within this cohort, either the presence of an EGFR mutation or skipping of MET exon 14); and cfDNA input amount (ng). n = 171. c,d, Fraction of TRACERx LUAD (c) and non-LUAD (d) tumors detected pre-operatively. Colors represent different studies: blue, Abbosh et al.; gray, Abbosh et al.; green, this study. n = 94 LUAD, n = 77 non-LUAD.
Fig. 2
Fig. 2. Baseline ctDNA level is prognostic of OS.
a, Kaplan–Meier (KM) curve of OS in ctDNA-high (dark gray), ctDNA-low (light gray) and ctDNA-negative (green) patients with LUAD. ctDNA-high and ctDNA-low groups were defined according to the median ctDNA levels across ctDNA-positive LUADs. P values were calculated using log-rank tests. b, KM curve demonstrating OS in patients harboring ctDNA at an estimated tumor fraction below the limit of reliable detection described in Abbosh et al. (light gray) and ctDNA-negative patients (green). P values were calculated using log-rank tests. c, Results of multivariable Cox regression analysis including ctDNA level (ctDNA-high, ctDNA-low, ctDNA-negative); histology; whether the patient received adjuvant chemotherapy; cigarette smoking history (in increments of 10 pack-years); pTNM stage; age (in increments of 10 years); and the presence of an oncogenic event (either an EGFR mutation or MET exon 14 skipping). n = 171. Error bars represent 95% confidence intervals. The size of the boxes represent the number of patients within each category.
Extended Data Fig. 1
Extended Data Fig. 1. Association between ctDNA and clinicogenomic features of NSCLC.
a. Stacked barplot of the number of targets obtained from coding (grey) and noncoding (blue) regions of the genome for each panel. b. Dot plot depicting panel-specific limit of detection (LOD) in ppm in all pre-operative plasma samples. c. Scatterplot demonstrating the association of ctDNA level with pack years of smoking for preoperative samples. Fitted line represents a linear model, and the shaded area represents the 95% confidence interval. d. Boxplot of preoperative ctDNA level for each pathological subtype of lung adenocarcinoma. The boxplots depict the median at the middle line, the lower and upper hinges represent the first and third quartiles, respectively, the whiskers show minima to maxima no greater than 1.5× the interquartile range (IQR), with the remaining outlying data points plotted individually. Sample size is n = 94 patients. P value was calculated using two-sided Kruskal-Wallis rank sum test. e. Boxplot of preoperative ctDNA level by oncogenic event status. The boxplots depict the median at the middle line, the lower and upper hinges represent the first and third quartiles, respectively, the whiskers show minima to maxima no greater than 1.5× the IQR, with the remaining outlying data points plotted individually. Sample size is n = 171 patients. P value was calculated using two-sided Kruskal-Wallis rank sum test. f. Barplot of patient oncogenic event status colored by preoperative ctDNA detection status. P value was calculated using two-sided Fisher’s exact test.
Extended Data Fig. 2
Extended Data Fig. 2. Increased assay sensitivity improves stratification of relapse-free survival.
a. Kaplan–Meier (KM) curve demonstrating relapse-free survival (RFS) within ctDNA-high (dark grey), ctDNA-low (light grey) and ctDNA-negative (green) patients with lung adenocarcinoma. ctDNA high and low groups were defined according to the median ctDNA levels across ctDNA-positive LUADs. P values were calculated using log-rank tests. b. KM curve demonstrating RFS within patients harbouring ctDNA at an estimated ppm below the limit of reliable detection described in Abbosh et al. 2023 (light grey), and ctDNA negative patients (green). P values were calculated using log-rank tests. c. KM curve illustrating difference in RFS between ctDNA-high and ctDNA-low patients with non-LUAD. P values were calculated using log-rank tests.
Extended Data Fig. 3
Extended Data Fig. 3. Multivariable analyses adjusting for known risk factors confirms independent prognostic value of pre-operative ctDNA.
a. Multivariable Cox regression analysis for overall survival (OS) containing ctDNA (continuous, per 10-fold increase); histology; whether the patient received adjuvant chemotherapy; cigarette smoking status (in 10 pack year increments); pTNM stage; age (in 10 year increments); and the presence of an oncogenic event. n = 171 patients. b. Multivariable Cox regression analysis for relapse-free survival (RFS) containing ctDNA (continuous, per 10-fold increase); histology; whether the patient received adjuvant chemotherapy; cigarette smoking history; pTNM stage; age; and the presence of an oncogenic event. n = 171 patients. c. Multivariable Cox regression analysis for RFS containing ctDNA level (ctDNA-high, ctDNA-low, ctDNA-negative); histology; whether the patient received adjuvant chemotherapy; cigarette smoking history; pTNM stage; age.; and the presence of an oncogenic event. n = 171 patients. d. Multivariable Cox regression analysis for RFS in non-LUADs containing ctDNA level (ctDNA-high, ctDNA-low); whether the patient received adjuvant chemotherapy; cigarette smoking history; pTNM stage; age; and oncogenic events. n = 77 patients. e. Multivariable Cox regression analysis for RFS in non-LUADs containing ctDNA (continuous); whether the patient received adjuvant chemotherapy; cigarette smoking history; pTNM stage; age; and oncogenic events. n = 77 patients. f. Multivariable Cox regression analysis for OS in non-LUADs containing ctDNA (continuous, per 10-fold increase); sub-histology; whether the patient received adjuvant chemotherapy; cigarette smoking history; pTNM stage; age and oncogenic events. n = 77 patients. g. Multivariable analysis for RFS in non-LUADs containing ctDNA (continuous, per 10-fold increase); sub-histology; whether the patient received adjuvant chemotherapy; cigarette smoking history; pTNM stage; age; and oncogenic events. n = 77 patients. For all plots in this figure, error bars represent 95% confidence intervals. The size of the boxes represents the number of patients within each category.
Extended Data Fig. 4
Extended Data Fig. 4. The impact of sample age and preservation format on panel targets.
a. Box and dot plot comparing number of high quality targets per panel from formalin-fixed paraffin embedded (FFPE) samples greater than 5 years vs less than 5 years old. Horizontal dashed line at 1000 indicates QC threshold. Center line represents the median. The upper whisker is the maximum value of the data that is within 1.5 times the interquartile range over the 75th percentile. The lower whisker is the minimum value of the data that is within 1.5 times the interquartile range under the 25th percentile. Sample size is n = 202. b. Failed FFPE or FFPE-derived panels which yielded fewer than 1000 high quality targets were re-generated using fresh frozen (FF) tissue where available. Green dots indicate samples included in our analysis, grey dots indicate those that failed to attain sufficient high quality targets for further processing. Where possible these panels were replaced with FF-derived panels. Connecting lines indicate paired patient panels designed from either FF or FFPE tumor sample. Center line represents the median. The upper whisker is the maximum value of the data that is within 1.5 times the interquartile range over the 75th percentile. The lower whisker is the minimum value of the data that is within 1.5 times the interquartile range under the 25th percentile. Sample size is n = 233 panels. One panel constructed from an FF tumor sample failed to attain 1,000 high-quality targets but was included to ensure that the cohort was representative of the wider TRACERx cohort. Two FF panels were constructed where FFPE panels had failed altogether; these are represented by green dots on the FF side not connected to an FFPE dot. c. Deming regression demonstrating agreement between measured ctDNA PPM and tumor molecules per milliliter of plasma. Fitted line represents a linear model, and the shaded area represents the 95% confidence interval.

References

    1. Abbosh, C. et al. Phylogenetic ctDNA analysis depicts early stage lung cancer evolution. Nature545, 446–451 (2017). - PMC - PubMed
    1. Abbosh, C. et al. Tracking early lung cancer metastatic dissemination in TRACERx using ctDNA. Nature616, 553–562 (2023). - PMC - PubMed
    1. Pascual, J. et al. ESMO recommendations on the use of circulating tumour DNA assays for patients with cancer: a report from the ESMO Precision Medicine Working Group. Ann. Oncol.33, 750–768 (2022). - PubMed
    1. Garcia-Murillas, I. et al. Mutation tracking in circulating tumor DNA predicts relapse in early breast cancer. Sci. Transl. Med.7, 302ra133 (2015). - PubMed
    1. Reinert, T. et al. Analysis of plasma cell-free DNA by ultradeep sequencing in patients with stages I to III colorectal cancer. JAMA Oncol.5, 1124–1131 (2019). - PMC - PubMed

MeSH terms