. 2025 Feb;17(2):204-214.
doi: 10.1038/s41557-024-01711-w. Epub 2025 Jan 13.

Defining proteoform-specific interactions for drug targeting in a native cell signalling environment

Affiliations

Defining proteoform-specific interactions for drug targeting in a native cell signalling environment

Corinne A Lutomski et al. Nat Chem. 2025 Feb.

Abstract

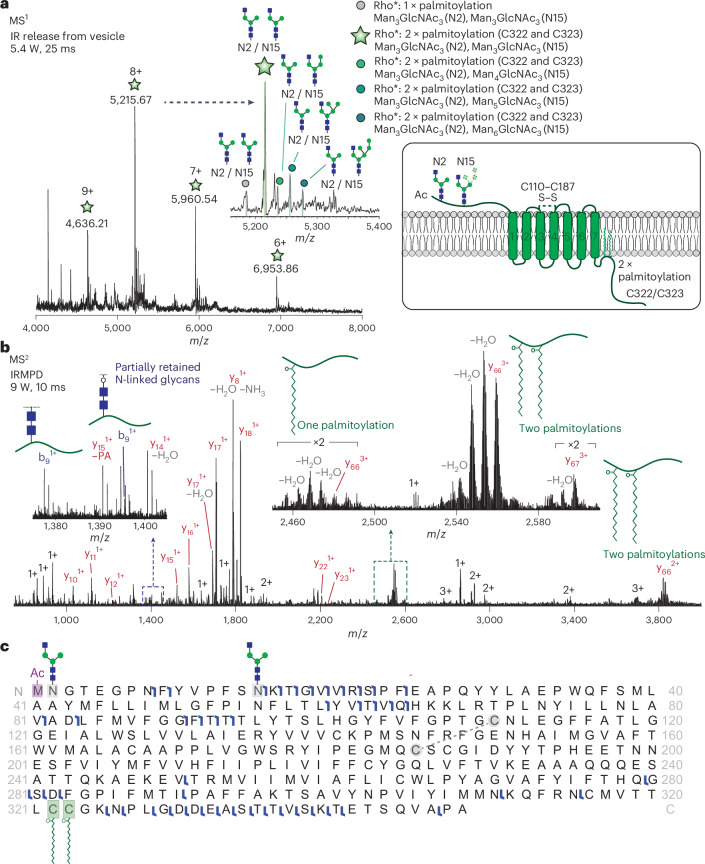
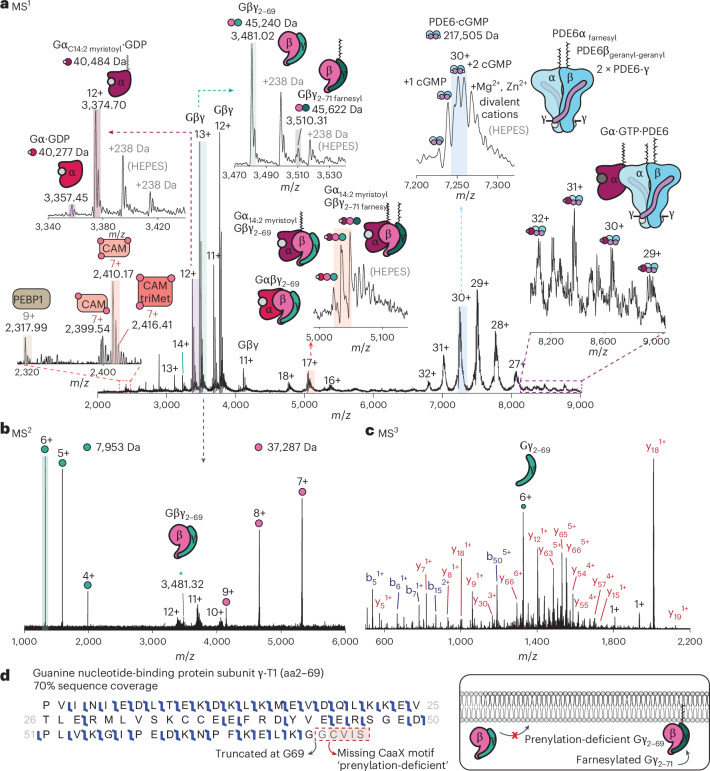
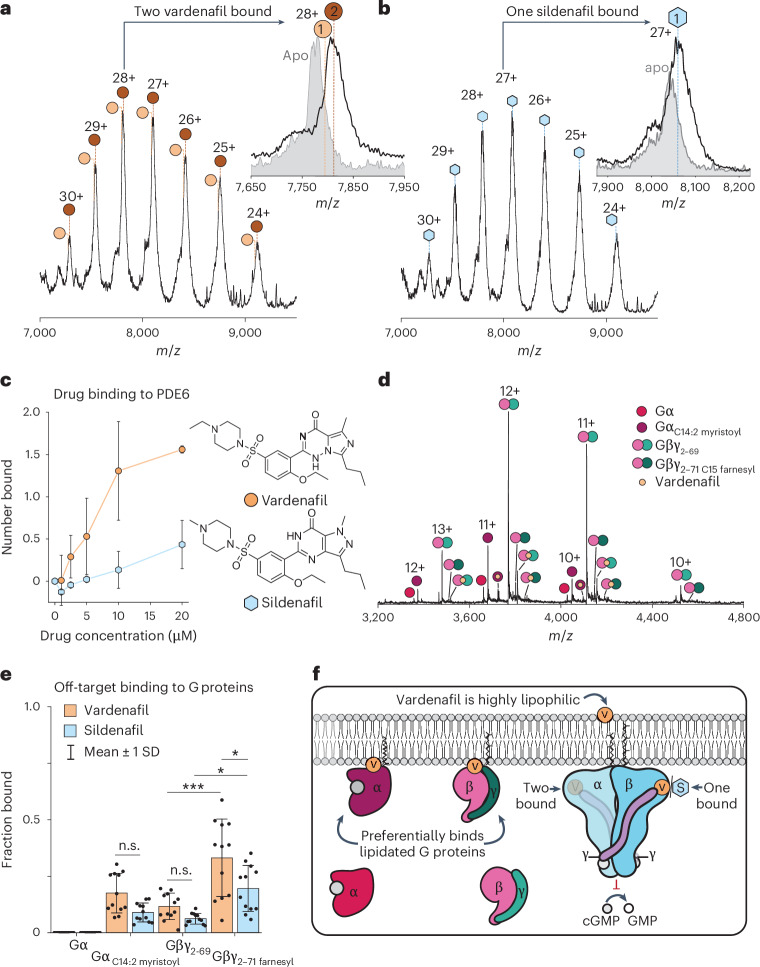
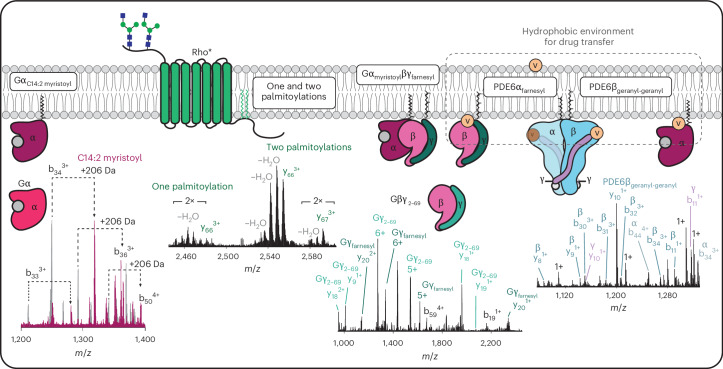
Understanding the dynamics of membrane protein-ligand interactions within a native lipid bilayer is a major goal for drug discovery. Typically, cell-based assays are used, however, they are often blind to the effects of protein modifications. In this study, using the archetypal G protein-coupled receptor rhodopsin, we found that the receptor and its effectors can be released directly from retina rod disc membranes using infrared irradiation in a mass spectrometer. Subsequent isolation and dissociation by infrared multiphoton dissociation enabled the sequencing of individual retina proteoforms. Specifically, we categorized distinct proteoforms of rhodopsin, localized labile palmitoylations, discovered a Gβγ proteoform that abolishes membrane association and defined lipid modifications on G proteins that influence their assembly. Given reports of undesirable side-effects involving vision, we characterized the off-target drug binding of two phosphodiesterase 5 inhibitors, vardenafil and sildenafil, to the retina rod phosphodiesterase 6 (PDE6). The results demonstrate differential off-target reactivity with PDE6 and an interaction preference for lipidated proteoforms of G proteins. In summary, this study highlights the opportunities for probing proteoform-ligand interactions within natural membrane environments.


Conflict of interest statement

Competing interests: J.L.B., D.W., S.A.B. and W.B.S. declare no competing interests. I.L. is an employee of OMass Therapeutics. C.V.R. is a consultant of OMass Therapeutics. J.D.H., C.M. and J.E.P.S. are employees of Thermo Fisher Scientific and are Research and Development Scientists in the life sciences mass spectrometry business. C.A.L., T.J.E., C.V.R., I.L., J.D.H. and J.E.P.S. are inventors on a UK patent application (GB2215982.6) that describes the infrared liberation of membrane proteins from native bilayers for top-down analysis method reported in this paper.

Figures

Fig. 1
Fig. 1. Liberating membrane and intradiscal proteins from vesicles derived from an endogenous lipid bilayer.
a, Disc membranes were isolated and disrupted via sonication to form vesicles. The vesicles were introduced directly into a mass spectrometer modified with an infrared (IR) laser directed into the high-pressure cell of a linear ion trap analyser. b, Left: mass spectrum obtained using a laser output power of 2.4 W with an irradiation time of 25 ms. Adjacent charge state series are denoted by circles. Inset: densely populated region of the mass spectrum. Right: at an increased laser output power of 4.8 W, a protein distribution corresponding to rhodopsin (denoted by stars) emerges at m/z > 4,500 (magnified ×2) as the membrane protein has been liberated from the native lipid bilayer. The identities of all proteins were confirmed using IRMPD and are listed in the legend.
Fig. 2
Fig. 2. Native top-down sequencing of rhodopsin following liberation from the lipid bilayer.
a, Native mass spectrum of rhodopsin released from the lipid bilayer. Inset: magnification of the 8+ charge state, revealing five different rhodopsin proteoforms. b, MS2 spectrum following isolation of the peak at m/z = 5,215 with an isolation width of 50 m/z and subjected to IRMPD (9 W, 10 ms irradiation time). b- and y-type fragment ions were matched to a predicted MS2 spectrum. Insets: fragment ions indicating the presence of PTMs, including glycosylation, and the likely sites of palmitoylation. c, Graphical sequence map of the entire repertoire of fragment ions that were matched to those predicted for the unmodified and modified forms of rhodopsin. A sequence coverage of 14% was obtained.
Fig. 3
Fig. 3. Identification of proteoforms in the intradiscal fraction.
a, Native mass spectrum of the intradiscal fraction. The highlighted peaks below m/z = 8,000 were selected and fragmented to confirm the identities of the proteoforms (see Supporting Information for the annotated MS2 spectra). triMet, trimethylated. b, Quadrupole m/z filter selection of the Gβγ complex at m/z = 3,481 by gentle activation (dissociation without fragmentation) successfully dissociated the non-covalently bound Gβ and Gγ subunits. However, the intact mass of the Gγ subunit was lower than the expected theoretical mass. c, The 6+ charge state of Gγ at m/z = 1,391 was subsequently isolated using the ion trap and fragmented in an MS3 experiment. d, The MS3 spectrum confirmed the identity of a truncated form of guanine nucleotide-binding protein subunit γ-T1 (Gγ1t) containing amino acids (aa) 2–69 with high confidence at 70% sequence coverage (left). This proteoform lacks the final five residues at the C terminus, comprising the CaaX motif that directs farnesylation to the C terminus, thus making it prenylation-deficient and unable to localize to the membrane (right).
Fig. 4
Fig. 4. Off-target drug binding to retina proteins in the intradiscal space.
a,b, Mass spectra of PDE6 incubated with 20 µM vardenafil (a) and 20 µM sildenafil (b). Insets: magnifications of the main charge state with the drug bound (white peak) and the equivalent charge state without drug binding (grey peak). c, Titration of vardenafil (orange circles) and sildenafil (blue hexagons) to evaluate drug binding to PDE6, represented as the number of drugs bound versus drug concentration. The error bars represent ±1 standard deviation for n = 6 technical replicates. d, Evidence for additional off-target drug binding to G proteins in the intradiscal fraction incubated with 20 µM vardenafil. e, Bar chart showing the amount of off-target drug binding to G protein proteoforms represented as the fraction bound. The heights of the bars denote the mean and the error bars represent ±1 standard deviation from the mean. Statistical significance was established using one-way analysis of variance (ANOVA) with a post hoc Bonferroni correction for multiple comparisons for n = 12 technical replicates. Statistically significant differences were observed for vardenafil binding to Gβ–Gγ269 versus Gβ–Gγ271 farnesyl (***P < 0.0001), sildenafil binding to Gβ–Gγ269 versus Gβ–Gγ271 farnesyl (*P = 0.013) and vardenafil versus sildenafil binding to Gβ–Gγ271 farnesyl (*P = 0.0116). n.s., not significant. f, Schematic showing the proposed mechanism of binding, where lipophilic vardenafil can permeate the membrane and preferentially interact with the hydrophobic lipid modifications on the G proteins and PDE6, facilitating drug transfer to the catalytic sites of PDE6α and PDE6β, where both sildenafil and vardenafil can bind. Source data
Fig. 5
Fig. 5. Summary of lipid modifications detected in proteins in rod photoreceptor membranes.
The fragmentation spectrum of Gα reveals an uncommon polyunsaturated myristoylation (C14:2). Rhodopsin was found to harbour one and two palmitoyl moieties at two cysteines near the C terminus. Two forms of Gβγ heterodimers have been identified: one prenylation-deficient form of Gγ and another form containing farnesylation on C71. Finally, two different lipid modifications have been detected in subunits of PDE6: farnesylation of the α subunit and geranyl-geranylation of the β subunit. Doubly lipidated PDE6 interacts with vardenafil, a PDE5 inhibitor, binding two molecules, one at each catalytic site of the heterodimer. Vardenafil also binds preferentially to farnesylated Gβγ and myristoylated Gα. We propose that the hydrophobic environment created by lipid modifications creates a conduit for lipophilic drug transfer.
Extended Data Fig. 1
Extended Data Fig. 1. Bottom-up proteomics analysis of rod disc membranes.
Plot of each protein ranked by log2 of the intensity-based absolute quantification (iBAQ) value. The proteins identified by native MS and top-down MS are annotated with their rank order. Source data
Extended Data Fig. 2
Extended Data Fig. 2. Bottom-up proteomics analysis of rod photoreceptor proteins in the intradiscal space.
Plot of each protein ranked by log2 of the iBAQ value. The proteins identified by native MS and top-down MS are annotated with their rank order. Source data

References

    1. Aebersold, R. et al. How many human proteoforms are there? Nat. Chem. Biol.14, 206–214 (2018). - PMC - PubMed
    1. Melani, R. D. et al. The Blood Proteoform Atlas: a reference map of proteoforms in human hematopoietic cells. Science375, 411–418 (2022). - PMC - PubMed
    1. Dai, Y. et al. Constructing human proteoform families using intact-mass and top-down proteomics with a multi-protease global post-translational modification discovery database. J. Proteome Res.18, 3671–3680 (2019). - PMC - PubMed
    1. Melby, J. A. et al. High sensitivity top-down proteomics captures single muscle cell heterogeneity in large proteoforms. Proc. Natl Acad. Sci. USA120, e2222081120 (2023). - PMC - PubMed
    1. Chapman, E. A. et al. Defining the sarcomeric proteoform landscape in ischemic cardiomyopathy by top-down proteomics. J. Proteome Res.22, 931–941 (2023). - PMC - PubMed

MeSH terms

Substances

LinkOut - more resources