. 2025 Jan;57(1):165-179.
doi: 10.1038/s41588-024-02015-y. Epub 2025 Jan 13.

Loss of Kmt2c or Kmt2d primes urothelium for tumorigenesis and redistributes KMT2A-menin to bivalent promoters

Affiliations

Loss of Kmt2c or Kmt2d primes urothelium for tumorigenesis and redistributes KMT2A-menin to bivalent promoters

Naitao Wang et al. Nat Genet. 2025 Jan.

Abstract

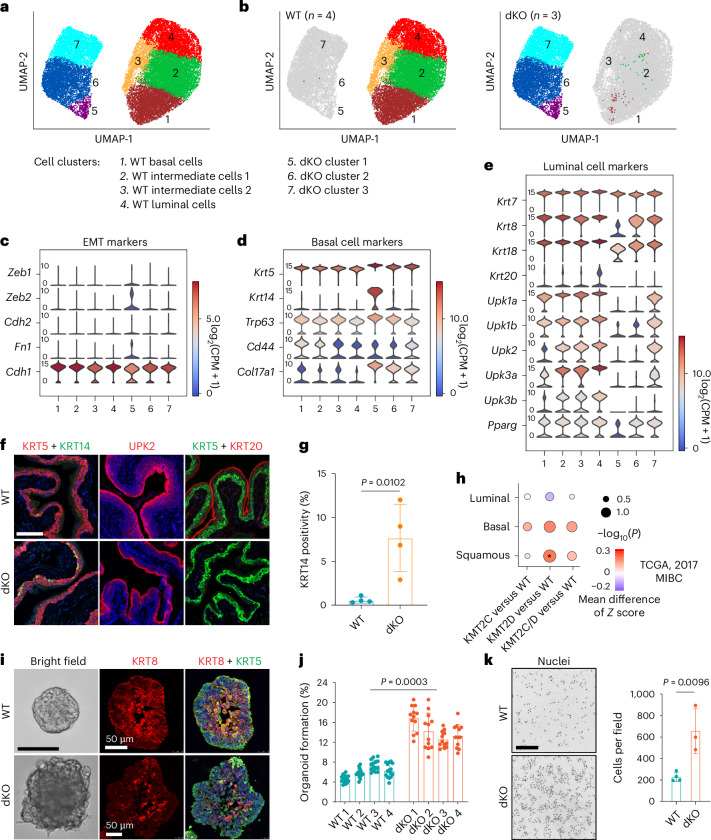
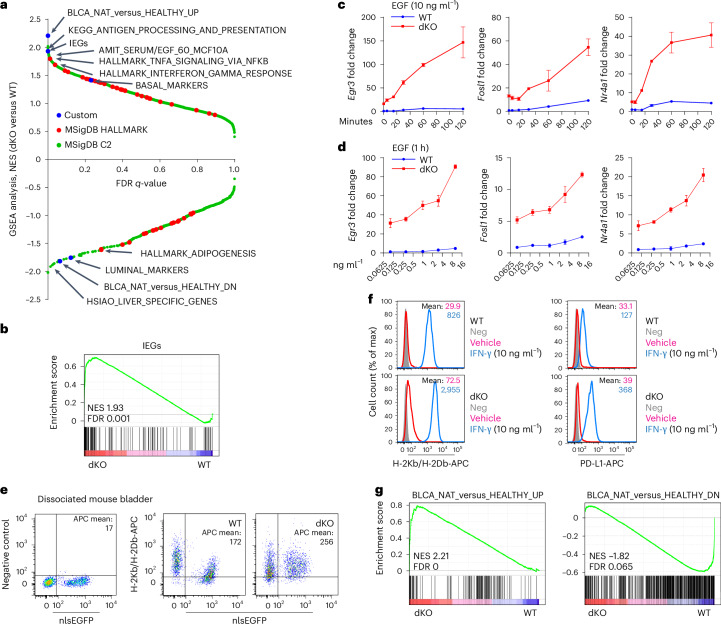
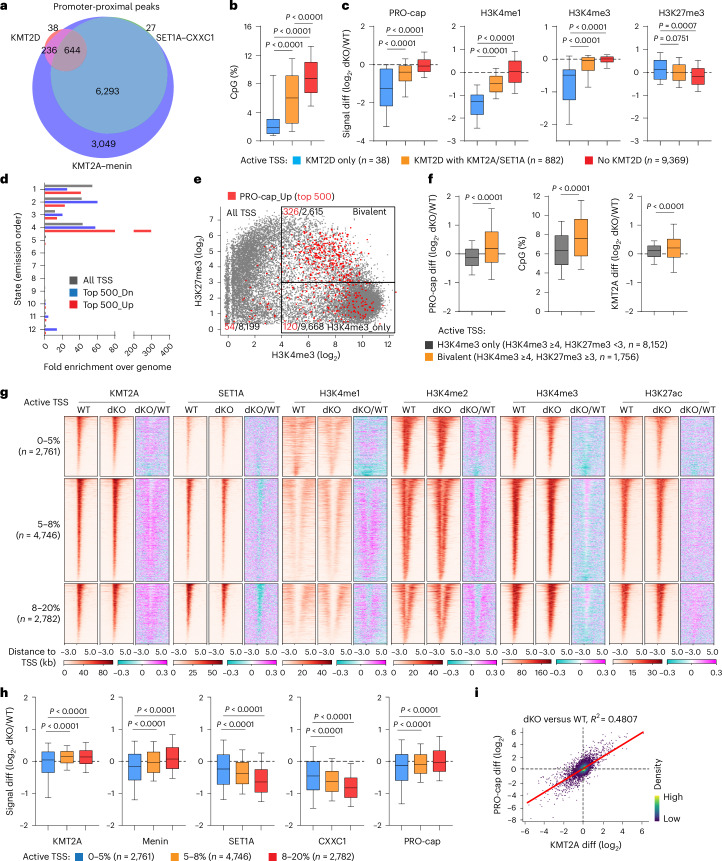
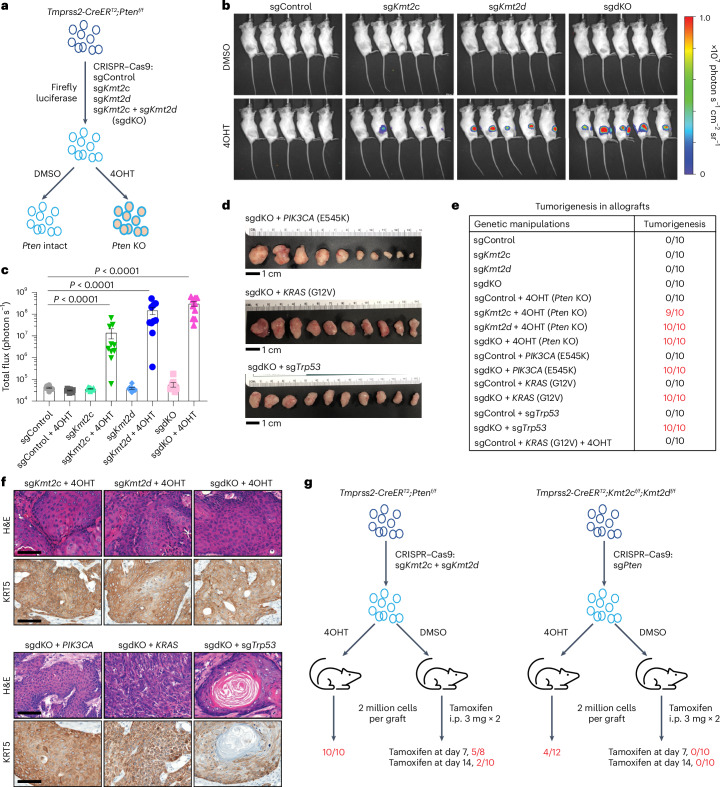
Members of the KMT2C/D-KDM6A complex are recurrently mutated in urothelial carcinoma and in histologically normal urothelium. Here, using genetically engineered mouse models, we demonstrate that Kmt2c/d knockout in the urothelium led to impaired differentiation, augmented responses to growth and inflammatory stimuli and sensitization to oncogenic transformation by carcinogen and oncogenes. Mechanistically, KMT2D localized to active enhancers and CpG-poor promoters that preferentially regulate the urothelial lineage program and Kmt2c/d knockout led to diminished H3K4me1, H3K27ac and nascent RNA transcription at these sites, which leads to impaired differentiation. Kmt2c/d knockout further led to KMT2A-menin redistribution from KMT2D localized enhancers to CpG-high and bivalent promoters, resulting in derepression of signal-induced immediate early genes. Therapeutically, Kmt2c/d knockout upregulated epidermal growth factor receptor signaling and conferred vulnerability to epidermal growth factor receptor inhibitors. Together, our data posit that functional loss of Kmt2c/d licenses a molecular 'field effect' priming histologically normal urothelium for oncogenic transformation and presents therapeutic vulnerabilities.


Conflict of interest statement

Competing interests: P.C. has received personal honoraria/advisory boards/consulting fees from Deciphera, Exelixis, Zai Lab, Novartis and Ningbo NewBay Medical Technology. P.C. has received institutional research funding from Pfizer/Array, Novartis, Deciphera and Ningbo NewBay Medical Technology. Y.C. has stock ownership and received royalties from Oric Pharmaceuticals. S.C. has received institutional research support from Daiichi-Sankyo, Paige.ai and AstraZeneca, is founder/shareholder of Odyssey Biosciences, has shares in Totus Medicines, and personal consulting fees from Sanofi, Novartis, Inivata, Lilly and AstraZeneca. J.E.R. has received personal honoraria/consulting fees from BMS, Merck, Pfizer, Pharmacyclics, Boheringer Ingelheim, EMD-Serono, GSK, Infinity, Janssen, Mirati, BioClin, Lilly, Tyra Biosciences, Astellas, Seagen, Bayer, AstraZeneca, Roche/Genentech and QED Therapeutics, and conducted trials from Astellas, Seagen, Bayer, AstraZeneca, Roche/Genentech and QED Therapeutics. S.R.S. is an equity holder and member of the scientific advisory board of NeuScience, Inc. and a consultant at Third Bridge Group Limited. D.B.S. has consulted/received honoraria from Rain, Pfizer, Fog Pharma, PaigeAI, BridgeBio, Scorpion Therapeutics, FORE Therapeutics, Function Oncology, Pyramid and Elsie Biotechnologies, Inc. None of these disclosures are directly related to this study. The other authors declare no competing interests.

Figures

Fig. 1
Fig. 1. Kmt2c/d KO is insufficient to induce robust histological changes in adult mouse urothelium.
a, A schematic of mouse models: two doses of tamoxifen (3 mg ×2) were injected intraperitoneally with a 48 h interval. b, IHC using an anti-GFP antibody that recognizes both EGFP and EYFP in the ureter and bladder sections from Tmprss2-CreERT2;Rosa26-CAG-LSL-EYFP mice (n = 3 mice). Tissues were collected 1 week after tamoxifen administration. Scale bar, 100 µm. c,d, Kaplan–Meier plots showing the survival of male (c) and female (d) mice after Kmt2c/d KO. Dead mice and severely morbid mice requiring immediate euthanasia were both counted as dead cases in this study. e, Representative hematoxylin and eosin (H&E) staining of ureter and bladder sections after tamoxifen administration. Scale bar, 100 µm. f, Representative H&E staining of ureteral hyperplasia (2 in 17 mice) in Kmt2c/d dKO mice. Scale bar, 100 µm. g, Representative IHC of H3K4me1 in ureter and bladder tissue sections (n = 3 mice in each genotype), validating the successful deletions of Kmt2c and/or Kmt2d. Scale bar, 100 µm.
Fig. 2
Fig. 2. Kmt2c/d loss alters stem cell potential, basal differentiation and EMT in adult mouse urothelium.
a, A UMAP plot showing clusters of WT (n = 4 mice) and Kmt2c/d dKO (n = 3 mice) urothelial cells collected 3 months post tamoxifen administration. b, UMAP plots showing that 96 in 9,040 cells (1.06%) from the dKO group clustered with WT cells, whereas only 4 in 16,818 cells (0.02%) from the WT group clustered with dKO cells. ce, Violin plots of EMT (c), basal (d) and luminal (e) cell markers. The color in the violin plots indicates the median normalized expression level of genes. f, Representative immunofluorescence staining of KRT5, KRT14, UPK2 and KRT20 in WT and Kmt2c/d dKO bladder sections. Cell nuclei were counterstained with DAPI (blue). Tissues were collected 6 months after tamoxifen administration. Scale bar, 100 µm. g, Quantification of KRT14 positivity in WT (n = 4 mice) and dKO (n = 4 mice) bladder urothelium. Data are presented as mean ± s.d. and were analyzed with a two-tailed t-test. h, Enrichment of luminal, basal and squamous markers in the transcriptome of the TCGA MIBC dataset (2017). The non-parametric Wilcoxon rank-sum test was used if one of the sample group was significantly different than the other sample group. The P value is a nominal two-sided P value, with *P < 0.05. i, Representative bright-field image and immunofluorescence staining of KRT5 and KRT8 in organoids from WT (n = 4 mice) and dKO (n = 4 mice) groups. Cell nuclei were counterstained with DAPI (blue). Scale bar, 100 µm for bright-field images and 50 µm for immunofluorescent images. j, Organoid formation efficiency of freshly FACS-sorted urothelial cells from Tmprss2-CreERT2;Kmt2cf/f;Kmt2df/f mice treated with or without tamoxifen (n = 4 mice per group). Tissues were collected 3 months post tamoxifen administration. Each point represents one Matrigel blob seeded with 500 cells. Data are presented as mean ± s.d. and were analyzed with a two-tailed t-test. k, Left: Matrigel invasion assay with fluorescence blocking transwell insert (pore size, 8 µm). Cells were stained with DAPI. Scale bar, 200 µm. Right: quantification of cells invading to the bottom of transwell inserts. Data are shown as mean ± s.d. (n = 4 independent assays in the WT group and n = 3 independent assays in the dKO group) and were analyzed with a two-tailed t-test. Source data.
Fig. 3
Fig. 3. Kmt2c/d KO induces an oncogenically primed molecular state characterized by augmented responses to stimuli.
a, A Plot of the normalized enrichment score (NES) versus the FDR q-value of GSEA analyses with MSigDB Hallmark v7.4, MSigDB C2 v7.4 and five custom gene sets. BASAL_MARKERS and LUMINAL_MARKERS consist of differentiation markers in Fig. 2h. b, GSEA analyses showing enrichment of a previously defined gene set consisting of 139 IEGs in dKO cells. c,d, QPCR analysis of Egr3, Fosl1 and Nr4a1 expression in WT and dKO cells: cells were starved with basic DMEM/F12 medium for 24 h and murine EGF was used to stimulate gene expression in either a time-dependent (c) or a dose-dependent (d) manner. Data are shown as the mean ± s.d. (representative of n = 3 independent experiments). e, Flow cytometry of MHC class I molecules H-2Kb and H-2Db in freshly dissociated urothelial cells from WT and dKO mice (3 months post tamoxifen administration, n = 4 mice in each group). Urothelial cells are nlsEGFP positive. f, Flow cytometry of MHC class I molecules H-2Kb and H-2Db in cultured urothelial cells (n = 4 independent experiments). To induce the expression of H-2Kb/Db, cells were treated with vehicle or mouse IFN-γ (10 ng ml−1) for 24 h. Neg, APC-conjugated isotype antibodies used as negative control. g, GSEA comparison of single-cell transcriptomes and human bladder gene sets. Gene sets consisted of genes differentially expressed between NAT (n = 19) and healthy human bladder tissues (n = 11), NAT versus healthy, absolute fold change >5, P < 0.05. Source data.
Fig. 4
Fig. 4. Kmt2c/d deletion suppresses enhancer activity and decreases KMT2A/SET1A deposition at active enhancers.
a, Mass spectrometry comparing the fractions of H3K4 modifications in WT and dKO cells (n = 3 independent experiments). Data are shown as mean ± s.d. and were analyzed with a two-tailed t-test. b, Comparison of 12 chromatin states in WT and dKO groups using ChromHMM annotation. A darker blue color corresponds to a higher probability of observing specific modifications in each state. Annotations of each state are shown on the right side of the heat map. c, The genomic faction of each chromatin state in WT and dKO urothelial cells. d, The genomic distributions of KMT2D, KMT2A–menin and SET1A–CXXC1 peaks in WT or dKO urothelial cells. Note that peaks within −1.0 kb/+0.5 kb to the TSS were annotated as promoter proximal and the remaining peaks were annotated as promoter distal. e, The overlap of KMT2D, KMT2A–menin and SET1A–CXXC1 peaks on promoter-distal regions. f, KMT2A, menin, SET1A, CXXC1, ATAC-seq and PRO-cap signal at KMT2D-positive (pos) and KMT2D-negative (neg) enhancers in WT and dKO urothelial cells. The center line represents the median, the box limits represent the upper and lower quartiles and the minimum and maximum whiskers represent the 10th and 90th percentiles, respectively. Data were analyzed with a two-tailed t-test. g, A heat map showing the enrichment of KMT2D, H3K4me1, H3K4me2, H3K27ac, H3K27me3, KMT2A, SET1A and ATAC signal at two subgroups of KMT2D-bound enhancers. Data are shown as the average of replicate samples. h, The log2 fold change of KMT2A, menin, SET1A, CXXC1, H3K4me1, H3K27ac and PRO-cap signal (signal diff) at two subgroups of KMT2D-bound enhancers. The center line represents the median, the box limits represent the upper and lower quartiles and the minimum and maximum whiskers represent the 10th and 90th percentiles, respectively. Data were analyzed with a two-tailed t-test. i, The log2 fold change of PRO-cap signal (PRO-cap diff) at active TSS containing a nearest enhancer within or outside ±10 kb. For our analysis, duplicated enhancers were removed as we kept only the closest enhancer to each TSS. The center line represents the median, the box limits represent the upper and lower quartiles and the minimum and maximum whiskers represent the 10th and 90th percentiles, respectively. Data were analyzed with a two-tailed t-test. Source data.
Fig. 5
Fig. 5. Kmt2c/d loss suppresses activities of KMT2D-bound TSS and redistributes KMT2A–menin to CpG-high promoters.
a, The overlap of KMT2D, KMT2A–menin and SET1A–CXXC1 peaks on promoter-proximal regions. b,c, The fraction of CpG dinucleotide (b) and log2 fold changes (c) of PRO-cap, H3K4me1, H3K4me3 and H3K27me3 signal in three subgroups of active TSS. The center line represents the median, the box limits represent the upper and lower quartiles and the minimum and maximum whiskers represent the 10th and 90th percentiles, respectively. Data were analyzed with a two-tailed t-test. d, Fold enrichment over the genome of chromatin states at all TSS and the top 500 PRO-cap up- (Up) or downregulated (Dn) TSS. e, A dot plot showing H3K4me3 and H3K27me3 modifications at all TSS in WT urothelial cells. The signal of H3K4me3 and H3K27me3 were normalized with RPGC. The red points indicate TSS with upregulated PRO-cap signal with Kmt2c/d KO (top 500). The gray points indicate all remaining TSS. Here we defined TSS with H3K4me3 ≥4 and H3K27me3 <3 as H3K4me3 only, while TSS with H3K4me3 ≥4 and H3K27me3 ≥3 as bivalent. f, Left: the log2 fold change of PRO-cap signal at H3K4me3 only (n = 8,152) and bivalent (n = 1,756) TSS. Middle: the fraction of CpG. Right: the log2 fold change of KMT2A enrichment. The center line represents the median, the box limits represent the upper and lower quartiles and the minimum and maximum whiskers represent the 10th and 90th percentiles, respectively. Data were analyzed with a two-tailed t-test. g, A heat map showing the changes of KMT2A, SET1A, H3K4me1, H3K4me2, H3K4me3 and H3K27ac between the WT and dKO groups. Data are shown as the average of replicate samples. The purple color indicates signal upregulated in dKO cells, while cyan indicates signal downregulated in dKO cells. h, The log2 fold change of KMT2A, menin, SET1A, CXXC1 and PRO-cap with Kmt2c/d KO. The center line represents the median, the box limits represent the upper and lower quartiles and the minimum and maximum whiskers represent the 10th and 90th percentiles, respectively. Data were analyzed with a two-tailed t-test. i, A dot plot of each TSS with linear correlation of KMT2A and PRO-cap alterations (log2 fold change, dKO/WT) at active TSS. Linear regression coefficient, R2 = 0.4807. Source data.
Fig. 6
Fig. 6. Kmt2c/d KO cooperates with Pten loss to induce invasive urothelial carcinoma in GEMMs.
a, A schematic of mouse models: two doses of tamoxifen (3 mg ×2) were injected intraperitoneally with a 48 h interval. b, Kaplan–Meier plots showing the survival of male and female mice after gene knock out. Dead mice and severely morbid mice requiring immediate euthanasia were both counted as dead cases in this study. c, Representative histological staining of H&E (Ptenf/f, n = 16 mice; Kmt2cf/f;Ptenf/f, n = 23 mice; Kmt2df/f;Ptenf/f, n = 26 mice; Kmt2cf/f;Kmt2df/f;Ptenf/f, n = 17 mice) and Ki-67 IHC in mouse ureter sections. Scale bar, 500 µm in the low-power images and 100 µm in the zoomed-in images. d, Representative histological staining of H&E (Ptenf/f, n = 16 mice; Kmt2cf/f;Ptenf/f, n = 23 mice; Kmt2df/f;Ptenf/f, n = 26 mice; Kmt2cf/f;Kmt2df/f;Ptenf/f, n = 17 mice) and Ki-67 IHC in mouse bladder sections. Scale bar, 5 mm in the low-power images and 200 µm in the zoomed-in images. e, Quantification of Ki-67-positive cells in mouse bladder and ureter tissues collected 6 months after tamoxifen administration. Note that the ureter tissues from both male and female Kmt2cf/f;Kmt2df/f;Ptenf/f mice were collected 6 weeks post tamoxifen administration. Each dot indicates the Ki-67 positivity from multiple sections in one mouse. Data are presented as mean ± s.d. and were analyzed with a two-tailed t-test between EYFP and each indicated group. NA, not analyzed. f, Histological subtypes of bladder urothelium in male (M) and female (F) GEMMs. g, A schematic illustration of urothelial carcinoma models induced by BBN, (n = 20 mice in the WT group and n = 18 mice in the dKO group). h, Histological subtypes of BBN-induced bladder urothelial carcinoma (UC) in male and female mice. Source data.
Fig. 7
Fig. 7. Kmt2c/d deletion primes tumorigenic susceptibility to prevalent oncogenic drivers.
a, A schematic illustration of CRISPR–Cas9 KO of Kmt2c, Kmt2d or Kmt2c + Kmt2d (sgdKO) in urothelial organoid derived from Tmprss2-CreERT2;Ptenf/f mouse. To knock out Pten, cells were treated with 4OHT (0.2 µM) for 24 h. b, Bioluminescent imaging of mammary fat pad allografts in SCID mice (n = 10 grafts in each group, 5 weeks post grafts). Images are shown at the same range of scale bar. c, Mammary fat pad allografts of urothelial organoids with CRISPR–Cas9 KO of Kmt2c and/or Kmt2d (n = 10 grafts per group). Urothelial cells (2 million) were grafted bilaterally into mammary fat pad of NOD-SCID mice. Luminescent signals were examined 5 weeks after grafting. Data are presented as mean ± s.e.m. Statistical comparisons were performed with a two-tailed t-test on log10 normalized data. d, Mammary fat pad allografts of dKO urothelial organoids with perturbations of PIK3CAE545K, KRASG12V and Trp53. Scale bar, 1 cm. e, Summary of tumorigenesis in mammary fat pad allografts. In non-tumorigenic groups, no palpable tumor was observed at least 2 months after the grafting. f, Representative H&E and KRT5 IHC staining of tumor sections from mammary fat pad allografts (n = 4 tumors per group). Scale bar, 100 µm. g, Tumorigenesis in allografts by ordering the time sequence of Kmt2c/d and Pten deletions in urothelial cells. i.p., intraperitoneal. Source data.
Fig. 8
Fig. 8. Kmt2c/d loss confers therapeutic vulnerability to EGFR inhibitors.
a,b, Cell viability following treatment of WT and dKO urothelial cells with the EGFR inhibitors afatinib (a) and gefitinib (b). Cells were treated with serially diluted inhibitors for 4 days followed by cell viability measured using the CellTiter-Glo luminescent viability assay. IC50 values are shown as mean ± s.d. and were analyzed with a two-tailed t-test (n = 3 independent experiments). c, Cell growth of WT and dKO cells (n = 3 independent experiments). A total of 0.1 million cells were initially plated at time day 0 (d0) followed by EGF withdrawal or treatment with gefitinib (100 nM) or afatinib (100 nM) beginning the second day after cell seeding. Cell number counting was performed 4 days after the start of drug treatment or EGF withdrawal. Data are shown as mean ± s.d. and were analyzed with two-tailed t-tests for each condition between WT and dKO groups. d, Growth curves of syngeneic tumors from sgdKO + Pten KO cells treated with afatinib (10 mg kg−1 day−1) or vehicle control in NOD-SCID mice. Treatment was started 2 weeks after injection of cells into the mammary fat pad. The tumor volume was measured twice a week (n = 10 in each replicate, two independent replicates in total). Data are shown as mean ± s.e.m. and were analyzed with a two-tailed t-test at the end time point. e,f, Representative histological staining and statistics for p-EGFR Y845 (n = 3 tumors per group) (e) and Ki-67 (n = 5 tumors per group) (f) in tumor sections from vehicle and afatinib-treated mice. Tumors were collected 2 h after the last treatment. Scale bar, 500 µm. Data are shown as mean ± s.d. and were analyzed with a two-tailed t-test. g, A schematic illustration showing that Kmt2c/d deletion induces global redistribution of KMT2A from active enhancers to CpG-high promoters that primes the urothelium for transformation and elicits sensitivity to EGFR inhibitors. Source data.
Extended Data Fig. 1
Extended Data Fig. 1. Characterization of Cre-mediated recombination in Tmprss2-CreERT2 mouse urothelium.
a, IHC using anti-GFP antibody that recognizes both nlsEGFP and EYFP in bladder sections from Tmprss2-CreERT2;Rosa26-CAG-LSL-EYFP mice (n = 3 mice). Tissues were collected 48 h after a single dose of Tamoxifen (3 mg). Note that the stronger staining was from EYFP, while the weaker staining was from nlsEGFP. Scale bar, 100 µm. b, FACS sorting of EpCAM+/nlsEGFP+ viable urothelial cells in dissociated mouse bladder with no tamoxifen treatment. c and d, Representative BaseScope staining of ureter and bladder with probes targeting Kmt2c or Kmt2d floxed exons (n = 3 mice in each group). Scale bar, 50 µm.
Extended Data Fig. 2
Extended Data Fig. 2. Urothelial cells with Kmt2c/d loss demonstrate growth advantage.
a, Quantification of Mki67 positivity in cell clusters from scRNA-seq (n = 4 mice in WT, n = 3 mice in dKO). Mki67 positivity was defined as detectable reads higher than 1. Data were analyzed with two-tailed Chi-Squared test. b, Quantification of Ki-67 positive cells (IHC) in mouse bladder and ureter tissues collected 6 months post tamoxifen administration. Each dot indicates the Ki-67 positive ratio of multiple sections from one mouse. Data were presented as mean ± SD and analyzed with two-tailed t-test between EYFP and each indicated group. c, Quantification of BaseScope staining with probes targeting Kmt2c or Kmt2d floxed exons. Bladder tissues collected from EYFP groups were used as control (6 months, n = 4 mice). Bladder tissues from Tmprss2-CreERT2;Kmt2cf/f;Kmt2df/f mice were collected 1 week (n = 5 mice), 6 weeks (n = 3 mice), and 6 months (n = 3 mice) post tamoxifen injection (2 x 3 mg). Data were presented as mean ± SD and analyzed with two-tailed t-test. Source data
Extended Data Fig. 3
Extended Data Fig. 3. Characterization of cell proliferation, differentiation, and EMT in urothelial organoids.
a, Representative immunofluorescence staining of KRT5 and Ki-67 in WT (n = 4 mice) and dKO (n = 4 mice) urothelial organoid sections. Cell nuclei were counterstained with DAPI (blue). Scale bar, 50μm. b, Quantification of Ki-67 positive nuclei in WT and dKO urothelial organoid. Each dot indicates Ki-67 positivity in each organoid section (pooled from n = 4 mice in each group). Data were presented as mean ± SD and analyzed with two-tailed t-test. c, Representative immunofluorescence staining of KRT5 and KRT8 in WT (n = 4 mice) and dKO (n = 4 mice) urothelial organoid sections. Organoids were seeded in full medium overnight and then cultured for 9 days with differentiation medium. Cell nuclei were counterstained with DAPI (blue). Scale bar, 50μm. d, Flow cytometry analysis of KRT5 and KRT8 expression in urothelial cells cultured under full and differentiation conditions (n = 2 independent experiments). e, Quantitative RT-PCR comparing differentiation and EMT markers between WT and dKO organoids (representative of n = 3 independent experiments). Data were presented as mean ± SD and analyzed with two-tailed t-test. Source data
Extended Data Fig. 4
Extended Data Fig. 4. Global chromatin state and deposition of KMT2 components in mouse urothelial cells.
a, Representative IGV tracks of H3K36me3 Cut&Run indicating the successful depletions of Exon 3 in Kmt2c and Exons 50-51 in Kmt2d. b, Western blot of KMT2 components in WT and dKO urothelial cells (n = 2 independent experiments). c, Genotyping of Kmt2c and Kmt2d floxed alleles in WT and dKO urothelial cells (n = 3 independent experiments). Primers amplifying single LoxP were used to only detect intact allele. Primers amplifying double LoxP were used to identify both intact (long) and deleted (short) allele. d, Overview of ChromHMM in WT urothelial cells. Left, a darker blue color corresponds to a higher probability of observing specific modifications in each chromatin state. Middle and right, a darker blue color corresponds to a higher fold enrichment of chromatin state at the given coordinates. State annotations were shown on the right side of the heatmap. e, Genomic distributions of KMT2 components. KMT2A+Menin and SET1A + CXXC1 groups show the features of combined peaks. f, Overlap of KMT2A and Menin, SET1A and CXXC1 on promoter-distal and promoter-proximal peaks. g, Comparison of tag-counts (log2) of KMT2A and Menin, SET1A and CXXC1 at promoter-proximal and promoter-distal peaks. Source data
Extended Data Fig. 5
Extended Data Fig. 5. Direct and indirect regulation of promoter activity by Kmt2c/d knockout.
a, Left, PRO-cap baseline signal in WT urothelial cells at TSS subtypes. Right, PRO-cap signal change (Log2 diff) in dKO urothelial cells. TSS were categorized by peak overlap and subtype as H3K4me1/H3K4me3/H3K27me3 negative (n = 2,683), H3K4me1 only (n = 793), H3K4me3 (may have H3K4me1 at shores) (n = 9,486), H3K27me3 only (n = 3,897), and bivalent promoters (H3K4me3/H3K27me3 double positive, n = 3,623). Data were shown as mean ± SEM. b, Distribution of promoter subtypes in H3K4me1 only (n = 793), H3K4me3 (n = 9,486), H3K27me3 only (n = 3,897), and bivalent promoters (H3K4me3/H3K27me3 double positive, n = 3,623). c, Fraction of CpG dinucleotide on proximal KMT2D, KMT2A/Menin, or SET1A/CXXC1 peaks with top 500 up- or down- regulated PRO-cap signal. The center line represents the median; the box limits represent the upper and lower quartiles; the minimum and maximum whiskers represent 10 and 90 percentile. Data were analyzed with two-tailed t-test. d, Log2 fold change of PRO-cap signal at KMT2D-bound and non-KMT2D-bound TSS with respect to CpG content. Active TSS was ranked by CpG% within proximal KMT2D, KMT2A/Menin, or SET1A/CXXC1 peaks. Bin size of 100 was then used to smoothen the log2 fold change of PRO-cap signal. e and f, Representative GSEA analyses of RNA-seq and PRO-cap showing negatively enriched gene sets with Kmt2c/d knockout. LCP refers to low CpG promoters. g, GSEA of top 500 downregulated PRO-cap signal with Kmt2c/d loss. h, Log2 fold change of RNA-seq in bladder cancer samples in Mut (KMT2C or KMT2D mutations) and WT group. Genes were ranked by CpG% within TSS ± 250 bp. Bin size of 100 was then used to smoothen the log2 fold change of RNA-seq. i and j, Representative GSEA analyses of RNA-seq and PRO-cap showing positively enriched gene sets with Kmt2c/d knockout. HCP refers to high CpG promoters. k, GSEA of top 500 upregulated genes between Mut (KMT2C or KMT2D mutations) and WT in human MIBC dataset (TCGA, 2017). Source data
Extended Data Fig. 6
Extended Data Fig. 6. Blockade of KMT2A/B-Menin partially rescues the transcriptome in dKO urothelial cells.
a, Log2 fold change of Menin deposition with MI-503 treatment (1 µM, 4 days) in Kmt2c/d dKO urothelial cells. The center line represents the median; the box limits represent the upper and lower quartiles; the minimum and maximum whiskers represent 10 and 90 percentile. Data were analyzed with two-tailed t-test. b, Plot of NES vs. FDR q-value of GSEA analyses with MSigDB Hallmark v7.4, MSigDB C2 v7.4 and custom gene sets. RNA-seq was performed in Kmt2c/d dKO cells treated with DMSO or MI-503 (1 µM, 4 days). c-d, Representative gene sets positively (c) or negatively (d) enriched with MI-503 (1 µM, 4 days) treatment in dKO urothelial cells (MI-503 vs. DMSO). e, Left, representative bright-field images of organoid from WT and dKO groups. Cells were pre-treated with DMSO or MI-503 (1 µM) for 3 days. Images were taken at day 8 with continuous presence of DMSO or MI-503. Scale bar, 100 µm. Right, statistics of organoid morphology. The fraction of hollow and solid organoids was calculated by counting the number of all organoids in each matrigel bulb (200 cells seeded in each bulb, pooled from n = 3 independent experiments). Data were presented as mean ± SD and analyzed with two-tailed t-test. f, Matrigel invasion assay with fluorescence blocking transwell insert (pore size, 8 µm). Cells were pre-treated with DMSO or MI-503 (1 µM) for 2 days. On the top chamber, 100k starvation-treated (48 h in basic DMEM/F12 medium) urothelial cells were seeded with basic DMEM/F12 medium. Complete organoid culture medium was added to the bottom. DMSO or MI-503 was added on both top and bottom chamber for the treatment. Twenty-four hours later, the transwell inserts were fixed, permeabilized, and stained with DAPI. Scale bar, 200 µm. Data were presented as mean ± SD (n = 6 independent experiments) and analyzed with two-tailed t-test. Source data
Extended Data Fig. 7
Extended Data Fig. 7. Oncoprint of KMT2C, KMT2D, PTEN, PIK3CA, KRAS, and TP53 in TCGA dataset.
a, Oncoprint of frequently mutated genes in TCGA MIBC dataset (2017).
Extended Data Fig. 8
Extended Data Fig. 8. Characterization of histology and differentiation in urothelial carcinoma GEMMs.
a, Representative histological staining of SMA (alpha Smooth Muscle Actin) in ureter tissues collected 6 months post tamoxifen administration. Scale bar, 200 µm. b, Quantification of non-invasion, bud invasion and massive invasion in male and female ureter sections collected 6 months post tamoxifen administration. c, Representative H&E staining, KRT5 IHC, and KRT7 IHC of urethral urothelial carcinoma sections collected 6 months after tamoxifen administration (Kmt2cf/f;Ptenf/f n = 4 mice; Kmt2df/f;Ptenf/f n = 3 mice). Note that the areas in green squares show features of urothelial carcinoma, whereas the area in blue square from the same section shows features of squamous differentiation. Scale bar, 500 µm. d, Representative histological staining of KRT5 and UPK2 in mouse bladder and ureter tissue sections (n = 4 mice in each group). Scale bar, 100 µm.
Extended Data Fig. 9
Extended Data Fig. 9. Bladder specific deletions of Kmt2c/Kmt2d/Pten induces muscle invasive urothelial cancer.
a, Representative H&E, Kmt2c/d BaseScope, H3K4me1 IHC, KRT5 IHC, and UPK2 IHC staining in bladder tissue sections collected from Tmprss2-CreERT2;Kmt2cf/f;Kmt2df/f;Ptenf/f mice with 4OHT (n = 1 tumor), adeno-CMV-Cre (n = 2 tumors), or adeno-K5-Cre (n = 2 tumors) intravesical injections. Scale bars were indicated on the figure. b, Urothelial cancer efficiency by intravesical delivery of 4OHT or adenovirus. c, Statistics of bladder weight 3 months post intravesical adenovirus injection. Control adenovirus (n = 8 mice) or adeno-CMV-Cre (n = 12 mice) were injected into the bladder of Tmprss2-CreERT2;Kmt2cf/f;Kmt2df/f;Ptenf/f mice. Data were presented as mean ± SD and analyzed with two-tailed t-test. d, Histological subtypes of bladder urothelial carcinoma with intravesical adeno-CMV-Cre injections. e, Representative H&E, H3K4me1 IHC, KRT5 IHC, and UPK2 IHC staining in bladder tissue sections collected from Tmprss2-CreERT2;Kmt2cf/f;Kmt2df/f;Ptenf/f mice with adeno-CMV-Cre intravesical injection (n = 2 tumors). Compared to H3K4m1 positive cells, lower UPK2 expression and higher KRT5 expression were observed in H3K4me1 negative cells. Scale bar was indicated on the figure. Source data
Extended Data Fig. 10
Extended Data Fig. 10. Validation of genetic manipulations in WT and dKO urothelial cells.
a, Surveyor assay validating the successful CRISPR editing of Kmt2c and Kmt2d (n = 3 independent experiments). Guide RNAs sgKmt2c #1 and sgKmt2d #1 were picked for the following experiments. b, Western blot validation of Pten deletion in sgControl, sgKmt2c, sgKmt2d, and sgdKO urothelial cells (n = 2 independent experiments). c-e, Western blot validation of engineered transgene PIK3CA, KRAS, and knockout of Trp53 in sgControl and sgdKO urothelial cells (n = 2 independent experiments). f, Western blot validation of CRISPR/Cas9-mediated Pten deletion (n = 2 independent experiments). Source data

References

    1. Sanli, O. et al. Bladder cancer. Nat. Rev. Dis. Primers3, 17022 (2017). - PubMed
    1. Audenet, F. et al. Clonal relatedness and mutational differences between upper tract and bladder urothelial carcinoma. Clin. Cancer Res.25, 967–976 (2019). - PMC - PubMed
    1. Simon, R. et al. Cytogenetic analysis of multifocal bladder cancer supports a monoclonal origin and intraepithelial spread of tumor cells. Cancer Res.61, 355–362 (2001). - PubMed
    1. Ramal, M., Corral, S., Kalisz, M., Lapi, E. & Real, F. X. The urothelial gene regulatory network: understanding biology to improve bladder cancer management. Oncogene43, 1–21 (2024). - PubMed
    1. Dyrskjot, L. et al. Bladder cancer. Nat. Rev. Dis. Primers9, 58 (2023). - PMC - PubMed

MeSH terms

Grants and funding

LinkOut - more resources