. 2025 Jan 13;23(1):13.
doi: 10.1186/s12951-024-03088-x.

Clinical-grade extracellular vesicles derived from umbilical cord mesenchymal stromal cells: preclinical development and first-in-human intra-articular validation as therapeutics for knee osteoarthritis

Affiliations

Clinical-grade extracellular vesicles derived from umbilical cord mesenchymal stromal cells: preclinical development and first-in-human intra-articular validation as therapeutics for knee osteoarthritis

Aliosha I Figueroa-Valdés et al. J Nanobiotechnology. .

Abstract

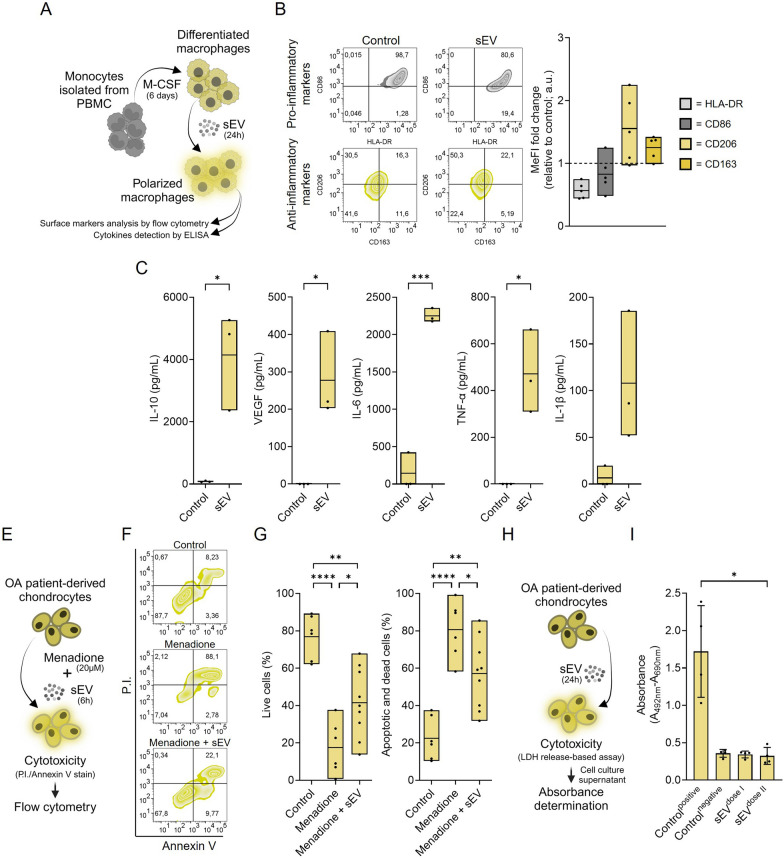
Osteoarthritis (OA) is a joint disease characterized by articular cartilage degradation. Persistent low-grade inflammation defines OA pathogenesis, with crucial involvement of pro-inflammatory M1-like macrophages. While mesenchymal stromal cells (MSC) and their small extracellular vesicles (sEV) hold promise for OA treatment, achieving consistent clinical-grade sEV products remains a significant challenge. This study aims to develop fully characterized, reproducible, clinical-grade batches of sEV derived from umbilical cord (UC)-MSC for the treatment of OA while assessing its efficacy and safety. Initially, a standardized, research-grade manufacturing protocol was established to ensure consistent sEV production. UC-MSC-sEV characterization under non-cGMP conditions showed consistent miRNA and protein profiles, suggesting their potential for standardized manufacturing. In vitro studies evaluated the efficacy, safety, and potency of sEV; animal studies confirmed their effectiveness and safety. In vitro, UC-MSC-sEV polarized macrophages to an anti-inflammatory M2b-like phenotype, through STAT1 modulation, indicating their potential to create an anti-inflammatory environment in the affected joints. In silico studies confirmed sEV's immunosuppressive signature through miRNA and proteome analysis. In an OA mouse model, sEV injected intra-articularly (IA) induced hyaline cartilage regeneration, validated by histological and μCT analyses. The unique detection of sEV signals within the knee joint over time highlights its safety profile by confirming the retention of sEV in the joint. The product development of UC-MSC-sEV involved refining, standardizing, and validating processes in compliance with GMP standards. The initial assessment of the safety of the clinical-grade product via IA administration in a first-in-human study showed no adverse effects after a 12 month follow-up period. These results support the progress of this sEV-based therapy in an early-phase clinical trial, the details of which are presented and discussed in this work. This study provides data on using UC-MSC-sEV as local therapy for OA, highlighting their regenerative and anti-inflammatory properties and safety in preclinical and a proof-of-principle clinical application.

Keywords: Exosomes; First-in-human; Macrophage polarization; Manufacturing; Mesenchymal; Osteoarthritis; Small extracellular vesicles; Stem cells; Stromal cells.


Conflict of interest statement

Declarations. Ethics approval and consent to participate: All the procedures presented in this work were approved by the Ethics Committee of Universidad de los Andes (CEC) and/or by Scientific Ethical Committee of the public agency Servicio de Salud Metropolitano Oriente (CECSSMO) as indicated throughout the manuscript. Specifically, the following certificates of approval were obtained: CECSSMO050612 for donation of UC-MSC, CEC2021077 for human-derived cells used in in vitro studies, CEC201861 for clinical-grade production of UC-MSC and CECSSMO030821 for patient recruitment and intra-articular sEV administration. Informed consent was obtained from all individual participants included in the study. Consent for publication: All individual participants signed informed consent regarding publishing their data derived from the research. Competing interests: MK-K, FA-M, MK, and JC received stipends from Cells for Cells S.A. MK is the Chief Scientific Officer of Cells for Cells S.A. and EVast Bio; MK-K is an executive at EVast Bio. AIF-V, FA-M, and MK are inventors of the patent No. PCT/CL2022/05003931 .The other authors indicated no potential conflicts of interest.

Figures

Fig. 1
Fig. 1
UC-MSC secretes sEV with unique and reproducible molecular cargo. A Diagram of the sEV characterization and the associated methodology. Next, graphs depicting the: B size distribution, C size mode, and D concentration from NTA of isolated particles. E Representative histograms from bead-based flow cytometry analyses and MeFI fold change forsSEV surface markers CD63, CD81 and CD9, and F)representative histograms from bead-based flow cytometry analyses and MeFI fold change to detect the presence of UC-MSC origin markers CD90 and CD44 in sEV. G A representative western blot of MSC's cell lysate and three independent sEV isolations is shown for determining the presence of sEV markers Syntenin-1 and Flotillin-1 as well as purity markers Calnexin and TOMM20. H A representative TEM micrograph of isolated sEV showing the classical “cup-shape” morphology adopted by the vesicles with this technique. I Venn diagram showing the distribution of identifiedsSEV-miRNA among three UC-MSC donor (plus a biological replicate of one of them). J Mean percentage distribution of top expressed miRNAs identified in sEV. K Venn diagram displaying the number of proteins identified in sEV derived from three different UC-MSC donors. Box and whiskers plot (solid lines = median); a.u. = arbitrary units; outliers were removed by ROUT method, Q = 1%; n = 40 for: size mode, concentration, CD63, CD81 and CD9 determination (UC-MSC donors = 5); n = 4 for CD90 and CD44 (UC-MSC donors = 4). Percentages in representative histograms refers to the bead population
Fig. 2
Fig. 2
sEV are internalized by key OA-related cell lineages and can be engineered to carry and deliver and external miRNA. PKH26-stained sEV internalization was evaluated after 24 h of incubation by confocal microscopy in: A huOAC, B synoviocytes and C hmMØs (DAPI = nucleus; Phalloidin = actin filaments; CD206 = macrophage surface protein). D TEM micrographs of sEV showing classical “cup-shape” morphology in control (left) and electroporated (right) sEV. E A qPCR was performed to detect the presence of C. elegans miR-39 in engineered sEV and F in engineered sEV- treated huOAC (left), synoviocytes (middle) and hmMØs (right) loaded with scramble (SCR) miRNA or C. elegans miR-39 (cel-miR-39). A Shapiro-Wilk test was performed as data normality test; unpaired t-test was applied for statistical analyses. n = 1 for internalization assays; n = 3 for engineered sEV assays.
Fig. 3
Fig. 3
sEV drives macrophage polarization and exerts chondroprotective activity against oxidative stress. A Schematic view of the established hmMØs polarization assay. B Representative plots of CD86/HLA-DR (M1, pro-inflammatory markers) and CD206/CD163 (M2, anti-inflammatory markers) obtained by flow cytometry analysis of control (untreated) and sEV-treated hmMØs are shown, followed by a graph summarizing the fold change of MeFI obtained for CD86, HLA-DR, CD206 and CD163 (control vs sEV treated). C Macrophage’s cytokine production and secretion was determined by ELISA for IL-10, VEGF, IL-6, TNF-α and IL-1β, respectively. E A menadione-induced cytotoxicity assay was performed to evaluate the chondroprotective activity of sEV by P.I./Annexin V stain and flow cytometry. F Representative plots showing P.I./Annexin V stain in huOAC as follows: no treatment control (top), menadione-treated (middle) and menadione + SEV treated (bottom). G Graphs depicting the percentage of live cells (left) and apoptotic/dead cells (right). H A LDH release-based cytotoxicity assay of sEV in huOAC was established. I LDH release determination in: (1) Triton X-100 treated huOAC (Controlpositive), (2) untreated huOAC (Controlnegative), (3) sEV-treated huOAC, dose I (100 × 106 sEV/well) and (4) sEV-treated huOAC, dose II (400 × 106 sEV/well). hmMØs polarization assay: n = 5 for flow cytometry and n = 3 for ELISA, a Shapiro-Wilk test was performed as data normality test followed by unpaired t-test; a.u. = arbitrary units; floating bars = min to max, solid line = mean. Menadione-induced cytotoxicity: n = at least 6, a Shapiro-Wilk test was performed as data normality test followed by one way ANOVA with Tukey multiple comparisons test; floating bars = min to max, solid line = mean. LDH- based cytotoxicity: n = 4, Kruskal-Wallis test (non parametric data) followed by Dunn's multiple comparisons post-test, bars = mean ± standard deviation, α = 0.05.
Fig. 4
Fig. 4
The deciphered molecular signature of sEV provides insights of their inflammation-related bioactivity in silico. A Venn diagram of sEV-miRNAs identified in our study, miRNet, and HDMM databases. B Enrichment patterns of the 16 common miRNAs in the analyzed samples. Subsequently, GO analysis of the identified proteins was performed, highlighting several biological processes and the number of putative target genes related to macrophage C and inflammation processes D. E Circular plot showing the association between identified sEV-miRNAs and their target genes within GO categories associated with “macrophage” E and “inflammatory” F, respectively. G GO category enrichment analysis specifically linked to the “macrophage” GO term, while H focuses on enrichment in the “inflammatory” GO term. I RT-qPCR validation of in silico predicted target gene STAT1 in macrophages 24 h after sEV treatment and in M1 phenotype macrophages (left) and a schematic representation of the potential effect of sEV's miRNA/protein cargo on macrophages phenotype through STAT1 inhibiton (right)
Fig. 5
Fig. 5
sEV reduces the severity of osteoarthritis and promotes regeneration in a murine model in vivo. A Schematic illustration of pre-clinical sEV IA administration in a CIOA mouse model in vivo. B BMD representative µCT images are shown following three treatments: Sham, OA and OA + sEV; the color corresponds to the degree of mineralization: higher numbers (blueish) on the scale represent a higher local mineralization (more mineral per volume). C BMD measurements generated from µCT. Four different knee joint zones were evaluated: medial femur, lateral femur, medial tibia and lateral tibia. D µCT-derived knee joint coronal images of sham, OA and OA + sEV-treated knee. E BS/BV index obtained from µ CT analyses in four different knee joint zones. F Histological verification of cartilage condition by Safranin O/Fast green stain. G OA histological scores obtained in four different knee joint zones. Box and whiskers plot (solid lines = median), n = 12 mice (at least); non parametric data, Kruskal-Wallis test followed by Dunn's multiple comparisons post-test, α = 0.05
Fig. 6
Fig. 6
sEV exerts immunosuppresive activity in vivo and are maintained within the knee joint space. A For murine in  vivo immunogenicity assessment popliteal lymph nodes were isolated from sham, OA and sEV treated mice and T-CD4+ cell populations were determined by flow cytometry as follows: CD4+IL-17+ for proinflammatory cells; CD4+IFNy+ for helper cells and CD25+FOXP3+ for Treg cells. Representative histograms for each subpopulation are shown (left) and subpopulations percentages are presented (right). B As biodistribution assay, DiR-stained sEV were administered by intra-articular injection in mice knees and monitored for 24, 48 and 72 h. Non parametric data; Kruskal-Wallis test, Dunn’s multiple comparisons post-test, α = 0.05; n = 3 mice per group. Floating bars = min to max, solid line = mean
Fig. 7
Fig. 7
sEV phenotype and activity is stable after prolonged storage and thawing. A Size mode and concentration evaluated by NTA of sEV resuspended in RL after 24 months of storage. B The presence of CD63, CD81 and CD9 was evaluated before and after 24 months of storage at – 80 °C by bead-based flow cytometry. Representative histograms followed by the fold change of MeFl of each marker relative to its respective isotype control are shown. C Macrophage polarization assay with sEV stored in RL after 24 months at – 80 °C ; representative plots of untreated (control) and sEV-treated macrophages are shown for pro-inflammatory markers (CD86/HLA-DR) and anti-inflammatory markers (CD163/CD206), followed by MeFI fold change of each marker, depicting the polarization towards an anti-inflammatory phenotype. D IL-10, IL-6 and TNF-α presence determination by ELISA in macrophage supernatants. Next, sEV stored in RL were thawed from – 80 °C and stored at 2–8 °C for 24 h. E sEV size mode and concentration was evaluated by NTA. F Presence of CD63, CD81 and CD9 in sEV was evaluated by bead-based flow cytometry. Representative histograms followed by the fold change of MeFl of each marker relative to its respective isotype control are shown. G hmMØs polarization assay with sEV stored in RL using three independent monocyte's donors for macrophage differentiation and polarization assay; representative plots of untreated (control) and sEV-treated macrophages are shown for pro-inflammatory markers (CD86/HLA-DR) and anti-inflammatory markers (CD163/CD206), followed by MeFI fold change of each marker, depicting the polarization towards an anti-inflammatory phenotype. H IL-10, VEGF, IL-6, TNF-α and IL-1β presence determination by ELISA in macrophage supernatants. A Shapiro-Wilk test was performed as data normality test; unpaired t-test was applied for statistical analyses, n = 4 - 5 for storage at 24 months and n = 3 for stability after thawing; a.u. = arbitrary units. Floating bars = min to max, solid line = mean. Percentages in representative histograms refers to the bead population
Fig. 8
Fig. 8
First-in-human sEV administration over time and phase I clinical study design. A WOMAC index evolution during one-year post- sEV administration, divided in subscales: pain, stiffness and function. B Representative sagittal views of the first patient's right knee at baseline (left) and 6 months following sEV therapy treatment (right). Articular cartilage is indicated by arrows in lateral femur condyle and lateral tibia condyle. Images were analyzed by an external company using proprietary software. C Six month comparison of cartilage volumetry based on SPAIR and WATSc sequences obtained from third party's image analysis report. a.u. = arbitrary units. D Clinical phase I study design outline

References

    1. Albanese M, Chen Y-FA, Hüls C, Gärtner K, Tagawa T, Mejias-Perez E, Keppler OT, Göbel C, Zeidler R, Shein M, Schütz AK, Hammerschmidt W. MicroRNAs are minor constituents of extracellular vesicles that are rarely delivered to target cells. PLoS Genet. 2021;17(12): e1009951. 10.1371/journal.pgen.1009951. - PMC - PubMed
    1. Alcayaga-Miranda F, González PL, Lopez-Verrilli A, Varas-Godoy M, Aguila-Díaz C, Contreras L, Khoury M. Prostate tumor-induced angiogenesis is blocked by exosomes derived from menstrual stem cells through the inhibition of reactive oxygen species. Oncotarget. 2016;7(28):44462–77. 10.18632/oncotarget.9852. - PMC - PubMed
    1. Ansari MY, Ahmad N, Haqqi TM. Oxidative stress and inflammation in osteoarthritis pathogenesis: role of polyphenols. Biomed Pharmacother Biomed Pharmacother. 2020;129: 110452. 10.1016/j.biopha.2020.110452. - PMC - PubMed
    1. Baietti MF, Zhang Z, Mortier E, Melchior A, Degeest G, Geeraerts A, Ivarsson Y, Depoortere F, Coomans C, Vermeiren E, Zimmermann P, David G. Syndecan-syntenin-ALIX regulates the biogenesis of exosomes. Nat Cell Biol. 2012;14(7):677–85. 10.1038/ncb2502. - PubMed
    1. Banerjee S, Cui H, Xie N, Tan Z, Yang S, Icyuz M, Thannickal VJ, Abraham E, Liu G. miR-125a-5p regulates differential activation of macrophages and inflammation. J Biol Chem. 2013;288(49):35428–36. 10.1074/jbc.M112.426866. - PMC - PubMed

LinkOut - more resources