. 2025 Jan 13;24(1):12.
doi: 10.1186/s12943-024-02211-8.

Lipid nanoparticles deliver DNA-encoded biologics and induce potent protective immunity

Affiliations

Lipid nanoparticles deliver DNA-encoded biologics and induce potent protective immunity

Dafei Chai et al. Mol Cancer. .

Abstract

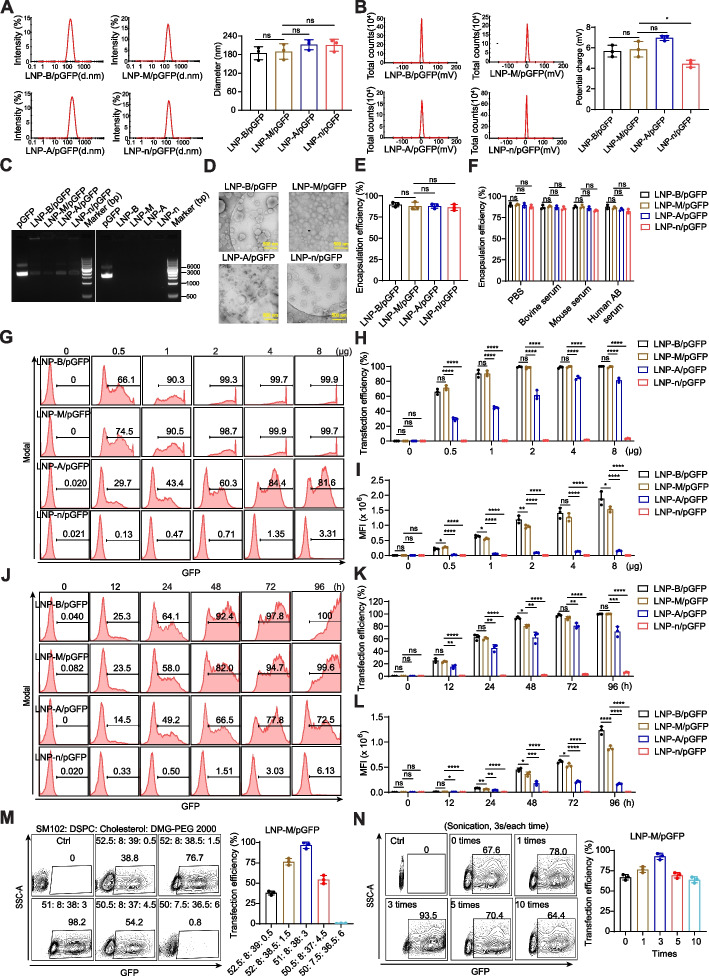
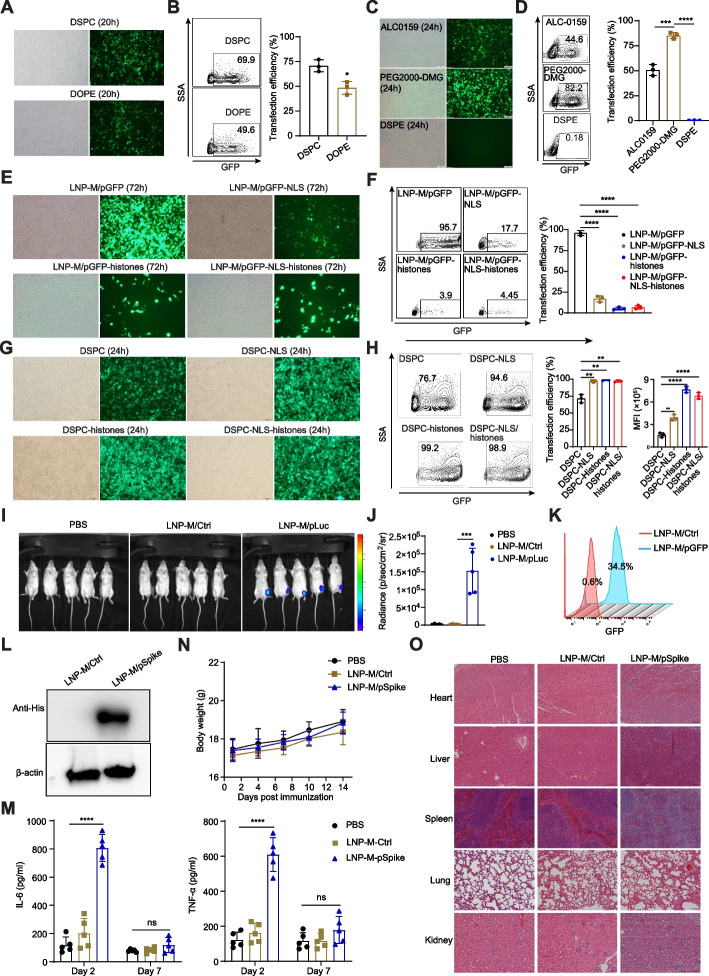
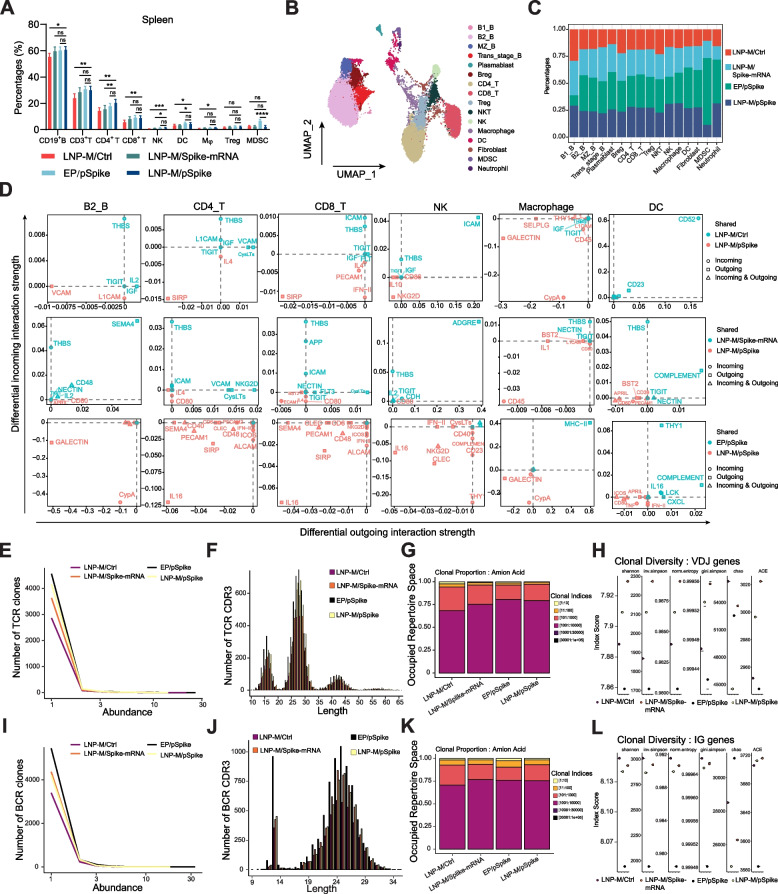
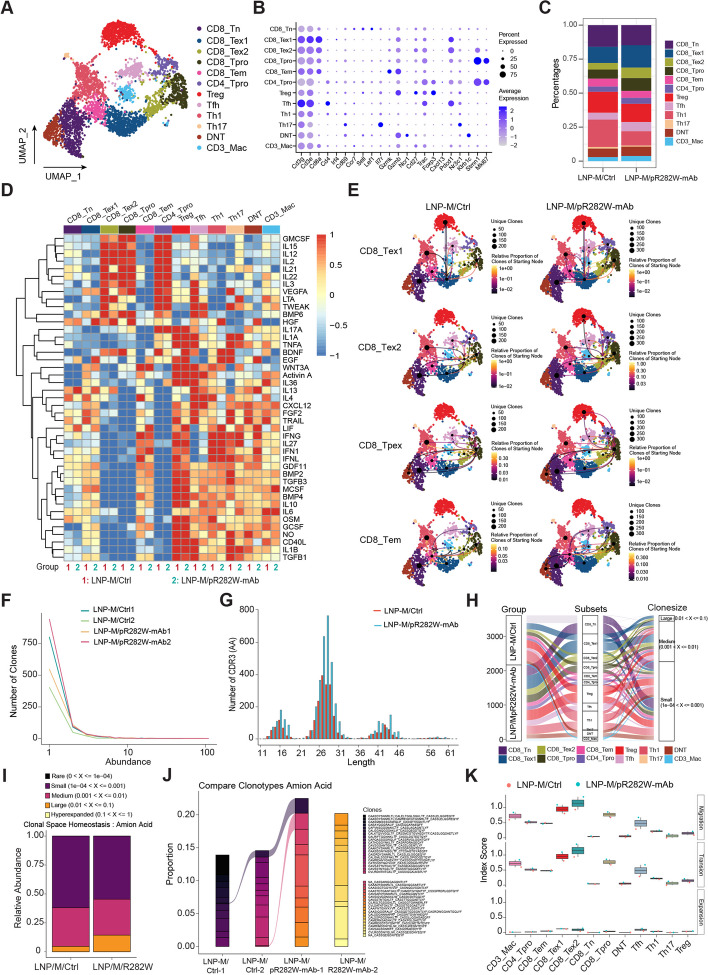
Lipid nanoparticles (LNPs) for mRNA delivery have advanced significantly, but LNP-mediated DNA delivery still faces clinical challenges. This study compared various LNP formulations for delivering DNA-encoded biologics, assessing their expression efficacy and the protective immunity generated by LNP-encapsulated DNA in different models. The LNP formulation used in Moderna's Spikevax mRNA vaccine (LNP-M) demonstrated a stable nanoparticle structure, high expression efficiency, and low toxicity. Notably, a DNA vaccine encoding the spike protein, delivered via LNP-M, induced stronger antigen-specific antibody and T cell immune responses compared to electroporation. Single-cell RNA sequencing (scRNA-seq) analysis revealed that the LNP-M/pSpike vaccine enhanced CD80 activation signaling in CD8+ T cells, NK cells, macrophages, and DCs, while reducing the immunosuppressive signals. The enrichment of TCR and BCR by LNP-M/pSpike suggested an increase in immune response specificity and diversity. Additionally, LNP-M effectively delivered DNA-encoded antigens, such as mouse PD-L1 and p53R172H, or monoclonal antibodies targeting mouse PD1 and human p53R282W. This approach inhibited tumor growth or metastasis in several mouse models. The long-term anti-tumor effects of LNP-M-delivered anti-p53R282W antibody relied on memory CD8+ T cell responses and enhanced MHC-I signaling from APCs to CD8+ T cells. These results highlight LNP-M as a promising and effective platform for delivering DNA-based vaccines and cancer immunotherapies.

Keywords: Cancer immunotherapy; DNA-encoded biologics; Lipid nanoparticles; Monoclonal antibodies; Vaccines.


Conflict of interest statement

Declarations. Ethics approval and consent to participate: Animal experimentation was approved by the Institutional Animal Care and Use Committee (IACUC) of Baylor College of Medicine. Competing interests: The authors declare no competing interests.

Figures

Fig. 1
Fig. 1
Characterization of LNP/DNA nanoparticles. A Size distribution of the four LNP/DNA formulations. B Surface zeta potential of LNP/DNA nanoparticles. C Agarose gel analysis of LNP/DNA nanoparticles. D Micrographs of LNP‐DNA nanoparticles acquired by TEM with 40,000 × magnification (scale bar, 500 nm). E Encapsulation efficiency of the LNP/DNA formulations using LNP-B, LNP-M, LNP-A, and LNP-n. F The stability of LNP/DNA nanoparticles in different sera. G-N 293T cells transfected with LNP/DNA. Cells were plated in a 24-well plate and transfected with four different LNP/pGFP formulations. FACS of GFP was analyzed after 72 h (G), showing the percentages of GFP-positive cells (H) and MFI (I) in triplicates. The time course of cells transfected with LNP/DNA (2 μg/well) was shown in (J-L). The molar ratios of four components in LNP-M were adjusted in (M) and sonication was added in (N), and the cells were analyzed after 72 h or 24 h. Data presented as the mean ± SD. The different significance was set at *p < 0.05, **p < 0.01, and ****p < 0.0001; ns, not significant
Fig. 2
Fig. 2
Optimization of LNP-M formulations to deliver spike. A and B LNP-M with DSPC or DOPE to deliver pGFP. 293T cells were seeded into a 24-well plate and transfected with LNP-M/pGFP, with DSPC replaced by DOPE. FACS of GFP was analyzed after 20 h, showing GFP expression images (A) and percentages of GFP-positive cells (B). C and D LNP-M with DMG-PEG 2000, ALC-0159, or DSPE to deliver pGFP. E and F LNP-M plus NLS or histones to deliver pGFP. pGFP was pre-incubated with NLS (mass ratio at 20:1), histones (mass ratio at 20:1) or NLS + histones (10:1) before microfluidic mixing with four lipids. 293T cells were transfected for 72 h before GFP expression image acquisition. G and H LNP-M plus NLS or histones to deliver pGFP, with DSPC, was pre-incubated with either NLS (mass ratio at 80:1) or histones (mass ratio at 80:1) or NLS + histones (40:1) before microfluidic mixing and transfection. I and J LNP-M delivers the luciferase (Luc) gene into mice. Mice were intramuscularly injected with optimized LNP-M-encapsulated pLuc (40 μg per animal), and bioluminescence was detected after five days. K LNP-M delivers pGFP intramuscularly into mice. L-N LNP-M delivers pSpike into mice. Spike expression in muscle tissues was detected using Western blot, serum levels of IL-6 and TNF-α assessed by ELISA, and body weights measured every three days. O H&E staining of major mouse organs. Mice were immunized three times on days 0, 14, and 28, and sacrificed on day 42 before organ collection and histological analyses. Data were presented as means ± SD. Statistical significance was set at *p < 0.05, **p < 0.01, ***p < 0.001, and ****p < 0.0001; ns, not significant
Fig. 3
Fig. 3
Antigen-specific immunity induced by LNP-M-delivered DNA- or mRNA-encoded spike. A Anti-spike antibodies in sera. Mice were immunized intramuscularly with the vaccines three times at 2-week intervals. Two weeks after the final immunization, the levels of serum IgG subtype antibodies were detected using ELISA. B Cytokine secretion by activated splenocytes. Splenocytes from immunized mice were cultured with IL-2 (100 U/ml) and a spike peptide pool (10 μg/ml) for 72 h before ELISA analysis of IFN-γ, TNF-α, IL-10, and IL-4. C and D T cell proliferation. The percentages of BrdU+ cells were assessed in gated splenic CD4+ or CD8+ T cells stimulated with a spike peptide pool. E and F ELISPOT analysis of splenic IFN-γ-secreting T cells. G CTL activity of splenic T cells. H-M Functional analysis of splenocytes. Cells were stimulated with the spike peptide pool (10 μg/ml) protein for 67 h before being treated with 500 ng/ml ionomycin, 50 ng/ml PMA, and 5 μg/ml Brefeldin A for an additional 5 h. FACS analyses were conducted using intracellular cytokine staining to assess the percentages of IFN-γ+, IL-2+, and TNF-α+ CD4+ or CD8.+ T cells. The experiments were performed with 5 mice per group. Data were represented as means ± SD. Statistical significance was set at ***p < 0.001, ****p < 0.0001
Fig. 4
Fig. 4
Single-cell analyses of splenocytes from mice immunized with LNP-M/pSpike. Mice were immunized three times using LNP/DNA, LNP/mRNA, or EP/DNA at 2-week intervals, and splenocytes were taken two weeks after the last dose for FACS and scRNA-seq analyses. A FACS of immune cell subtypes. B UMAP of CD45+ immune cells. C Bar graphs showing the percentages of immune cell subtypes. D Scatter plots compared the outgoing and incoming interaction strengths in a 2D space between the LNP-M/pSpike group and other groups. E Analysis of total TCR clonotype abundance by sample and type using the abundance contig function. F Assessment of CDR3 peptide length by sample using the length contig function. G Clonal homeostatic space representations, showing the relative proportional space occupied by specific clonotypes of TCR amino acid across different vaccine groups. H Box plot showing clonotype diversity of VDJC genes. Clonotype diversity was calculated as the Shannon index, inverse Simpson index, or Chao index within T cells. I BCR clonotype abundance in various vaccine groups. J CDR3 peptide length. K Relative proportional space occupied by specific clonotypes of BCR amino acids. L clonotype diversity of IG genes. Data were represented as means ± SD. Statistical significance was set at *p < 0.05, **p < 0.01, ***p < 0.001, and ****p < 0.0001; ns, not significant
Fig. 5
Fig. 5
Therapeutic effects of LNP-M/DNA against PD-L1, p53R172H, PD1, or p53R282W in several syngeneic tumor models. A-C LNP-M/DNA expressing PD-L1 elicits anti-PD-L1 antibodies and anti-tumor activities. BALB/c mice (n = 5 per group) were immunized with three doses of LNP-M/DNA expressing mouse PD-L1 at days 7, 17, and 24. A20 tumor cells were inoculated on day 0. The first twos doses were delivered intramuscularly and the last dose intratumorally. Two weeks after the last dose, sera were taken to measure the titers of anti-PD-L1 IgG antibodies (A), and tumor volumes (B) and inhibition (C) were assessed. D-F LNP-M/DNA expressing p53-R172H elicits anti-p53 antibodies and anti-tumor activities. 129 Sv/E mice (n = 5 per group) were immunized with three doses of LNP-M/DNA expressing mouse p53-R172H at days 7, 17, and 24. 344SQ tumor cells were inoculated on day 0. The first two doses were delivered intramuscularly and the last dose intratumorally. Two weeks after the last dose, sera were taken to measure the titers of anti-p53R172H IgG antibodies (D), and tumor volumes (E) and inhibition (F) were assessed. G-I LNP-M/DNA expressing the antibody against mouse PD1 elicits anti-tumor activities. MC38 tumor cells were inoculated into C57BL/6J mice, and LNP-M/pPD1-mAb was injected intratumorally on days 14 and 21 post-tumor inoculation (n = 5 mice per group). Five days after the first dose, the expression of PD1 on CD8+ T cells from the tumors was detected using FACS. Tumor volumes (H) and inhibition (I) were assessed. J-N LNP-M/DNA expressing the antibody against human p53R282W elicited anti-tumor activities in MC38 syngeneic models. MC38-p53KO/R282W cells were injected subcutaneously into mice and given intratumoral injections of LNP-M/pR282W-mAb on days 14 and 21 post-tumor inoculation (n = 5 mice per group). The percentages of Cd45+ and human Fc+ cells within tumors were determined using FACS (J). Tumor volumes were measured (K), and tumor inhibition was calculated (L). In the metastatic model, MC38-p53KO/R282W cells were inoculated intravenously (n = 10 mice per group), and mice were treated with LNP-M/pR282W-mAb; representative images of metastatic nodules on the lung surface and animal survival were shown in (M). MC38-p53KO/R282W cells were inoculated intraperitoneally before treatment (n = 10 mice per group). Representative images of rectal MC38-p53KO/R282W tumors and animal survival were shown in (N). O-Q LNP-M/pR282W-mAb inhibits HupT3 tumors. NSG mice were inoculated with HupT3 cells with an endogenous p53 R282W mutation on day 0, given PBMCs (1 × 107/mouse) intravenously on day 10, and treated by LNP-M/pR282W-mAb on days 14, 19, and 24 (n = 5 mice). FACS detected the percentage of human CD56+ NK cells in TILs (O), tumor volumes were measured (P), and tumor inhibition rates were calculated (Q). Data were presented as mean ± SD. Statistical significance was set at **p < 0.01, ***p < 0.001 and ****p < 0.0001; ns, not significant
Fig. 6
Fig. 6
The mechanistic study of anti-tumor effects induced by LNP-M/pR282W-mAb. A and B The levels of CD107a and IFN-γ expression in NK cells within TILs. C and D The expression of CD107a and IFN-γ in NKT cells within TILs. D and E The percentages of CD103+CD11c+ and CD8+CD11c+ cells within tumors. G and H The expression of DC activation markers (CD80, CD86, and MHC) on CD11c+ cells within tumors. I and J The percentages of multifunctional CD8+ T cells expressing IFN-γ, IL-2, and TNF-α in tumors. K-M The impact of blocking CD8+ T cells, NK cells, or CD4+ T cells on animal survival. Each animal (n = 10 per group) received intraperitoneal injections of 0.5 mg anti-mouse CD4, CD8α or NK1.1 mAb two days before the first dose of LNP-M/pR282W-mAb. The second and third doses were administered on days 5 and 12. N and O Memory immunity in mice treated with LNP-M/pR282W-mAb. Mice treated with LNP-M/pR282W-mAb were rechallenged with MC38-p53KO/R282W cells on the left flank, with naïve mice serving as the control group. N Tumor growth curves. O Survival rate. P Representative images of FACS and statistical analysis of CD8+ T cells labeled by CD44 and CD62L in the splenocytes from both groups. Q Splenic memory T cells from mice treated with LNP-M/pR282W-mAb. Mice carrying subcutaneous MC38-p53KO/R282W tumors were treated with LNP-M/pR282W-mAb, and the spleen was taken for FACS analyses of CD44lowCD62Lhigh (stem cell memory): CD44highCD62Lhigh (central memory), and CD44highCD62Llow (effector memory) CD8.+ T cells. Data were presented as means ± SD. Statistical significance was set at **p < 0.01, ***p < 0.001, and ****p < 0.0001
Fig. 7
Fig. 7
Expansion of TCR diversity induced by LNP-M/pR282W-mAb in CD8+ T cell anti-tumor immune responses. A UMAP visualization of T cell-associated populations pooled across samples, which clustered into 12 distinct clusters. B Identification expression of representative marker genes. C The percentages of various T cell subtypes in the tumors from each group. D Summary of signaling activities in T cell subsets. The heat map includes cell types with significant differences in signaling activities between LNP-M/pR282W-mAb group and control group. E UMAP visualization overlay identifying the network interaction of clonotypes shared between clusters along the single cell dimension reduction. The relative proportion of clones transitioning from a starting node to a different cluster, visualized by arrows in four CD8+ T cell cluster networks. F Analysis of total TCR clonotype abundance by sample and type using the abundance contig function. G Assessment of CDR3 peptide length by sample using the length contig function. H Alluvial plots illustrating the frequencies of TCR clonotypes from each sample, in relationship to the top V(D)J pairing frequencies of expanded clonotypes in each group (right) and contacts (left) among T cell clusters. I The relative proportional space occupied by specific clonotypes of TCR across T cell subsets. J Dynamics of dominant clonotype sequences (amino acids) of TCRs across samples, colored by the types of dominant sequences. K Box plot showing clonotype diversity of 12 T cell subpopulations. Clonotype diversity was calculated as the clonal expansion index, cross-tissue migration index, or state transition index within T cell subpopulations

References

    1. Jia Y, Wang X, Li L, Li F, Zhang J, Liang XJ. Lipid nanoparticles optimized for targeting and release of nucleic acid. Adv Mater. 2024;36:e2305300. - PubMed
    1. Tartof SY, Slezak JM, Fischer H, Hong V, Ackerson BK, Ranasinghe ON, Frankland TB, Ogun OA, Zamparo JM, Gray S, et al. Effectiveness of mRNA BNT162b2 COVID-19 vaccine up to 6 months in a large integrated health system in the USA: a retrospective cohort study. Lancet. 2021;398:1407–16. - PMC - PubMed
    1. Team CC-R, Food, Drug A. Allergic reactions including anaphylaxis after receipt of the first dose of Moderna COVID-19 vaccine - United States, December 21, 2020-January 10, 2021. MMWR Morb Mortal Wkly Rep. 2021;70:125–9. - PMC - PubMed
    1. Witten J, Hu Y, Langer R, Anderson DG. Recent advances in nanoparticulate RNA delivery systems. Proc Natl Acad Sci U S A. 2024;121:e2307798120. - PMC - PubMed
    1. Cullis PR, Hope MJ. Lipid nanoparticle systems for enabling gene therapies. Mol Ther. 2017;25:1467–75. - PMC - PubMed