

Comparing prediction accuracy for 30-day readmission following primary total knee arthroplasty: the ACS-NSQIP risk calculator versus a novel artificial neural network model
- PMID: 39806502
- PMCID: PMC11727824
- DOI: 10.1186/s43019-024-00256-z
Comparing prediction accuracy for 30-day readmission following primary total knee arthroplasty: the ACS-NSQIP risk calculator versus a novel artificial neural network model
Abstract
Background: Unplanned readmission, a measure of surgical quality, occurs after 4.8% of primary total knee arthroplasties (TKA). Although the prediction of individualized readmission risk may inform appropriate preoperative interventions, current predictive models, such as the American College of Surgeons National Surgical Quality Improvement Program (ACS-NSQIP) surgical risk calculator (SRC), have limited utility. This study aims to compare the predictive accuracy of the SRC with a novel artificial neural network (ANN) algorithm for 30-day readmission after primary TKA, using the same set of clinical variables from a large national database.
Methods: Patients undergoing primary TKA between 2013 and 2020 were identified from the ACS-NSQIP database and randomly stratified into training and validation cohorts. The ANN was developed using data from the training cohort with fivefold cross-validation performed five times. ANN and SRC performance were subsequently evaluated in the distinct validation cohort, and predictive performance was compared on the basis of discrimination, calibration, accuracy, and clinical utility.
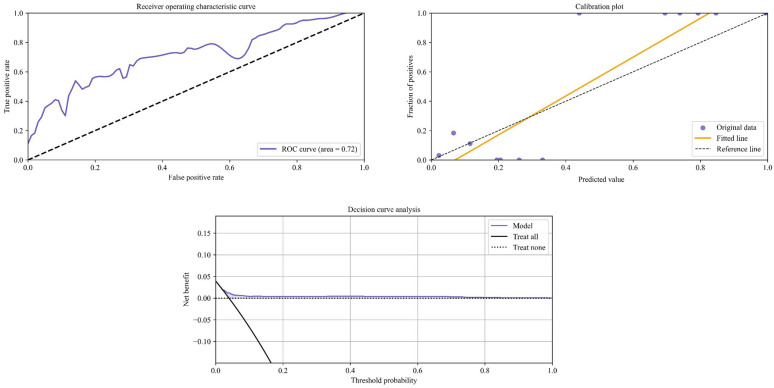
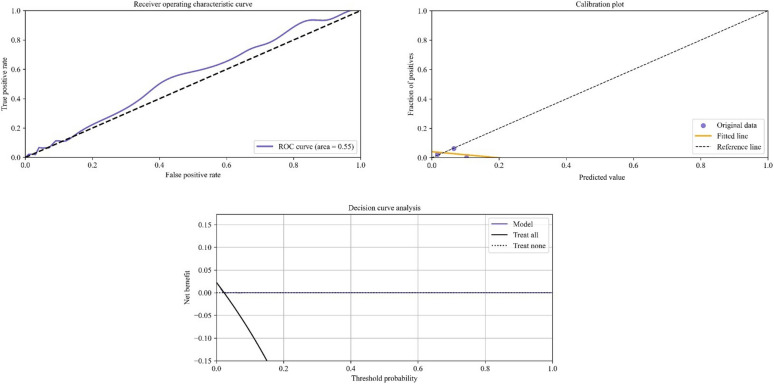
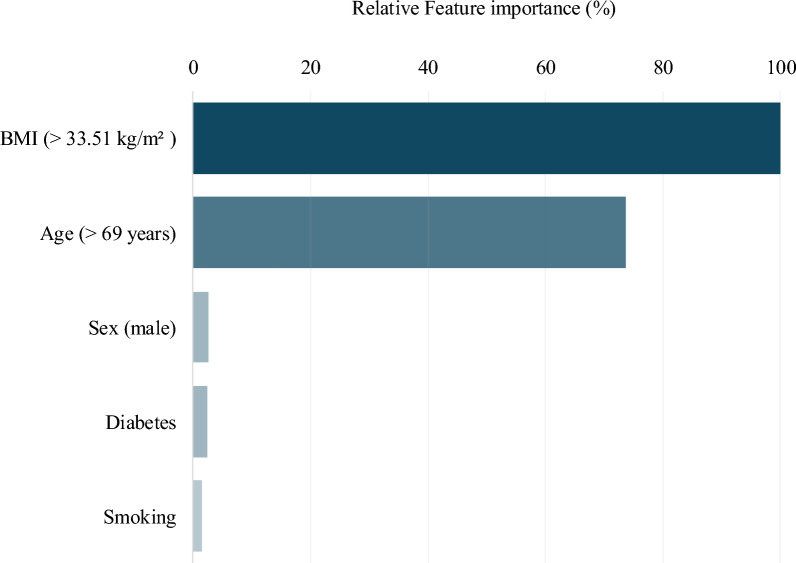
Results: The overall cohort consisted of 365,394 patients (trainingN = 362,559; validationN = 2835), with 11,392 (3.1%) readmitted within 30 days. While the ANN demonstrated good discrimination and calibration (area under the curve (AUC)ANN = 0.72, slope = 1.32, intercept = -0.09) in the validation cohort, the SRC demonstrated poor discrimination (AUCSRC = 0.55) and underestimated readmission risk (slope = -0.21, intercept = 0.04). Although both models possessed similar accuracy (Brier score: ANN = 0.03; SRC = 0.02), only the ANN demonstrated a higher net benefit than intervening in all or no patients on the decision curve analysis. The strongest predictors of readmission were body mass index (> 33.5 kg/m2), age (> 69 years), and male sex.
Conclusions: This study demonstrates the superior predictive ability and potential clinical utility of the ANN over the conventional SRC when constrained to the same variables. By identifying the most important predictors of readmission following TKA, our findings may assist in the development of novel clinical decision support tools, potentially improving preoperative counseling and postoperative monitoring practices in at-risk patients.
Keywords: Clinical decision support; Deep learning; Readmissions; Risk assessments; Total knee arthroplasty.
© 2025. The Author(s).
Conflict of interest statement
Declarations. Ethics approval and consent to participate: This study was determined by the IRB to be exempt from review as it only uses deidentified patient data. Consent for publication: Not applicable. Competing interests: The authors declare that they have no competing interests.
Figures
Similar articles
-
Generalizability of machine learning models predicting 30-day unplanned readmission after primary total knee arthroplasty using a nationally representative database.Med Biol Eng Comput. 2024 Aug;62(8):2333-2341. doi: 10.1007/s11517-024-03075-2. Epub 2024 Apr 1. Med Biol Eng Comput. 2024. PMID: 38558351
-
Machine learning model outperforms the ACS Risk Calculator in predicting non-home discharge following primary total knee arthroplasty.Knee Surg Sports Traumatol Arthrosc. 2025 Mar;33(3):977-986. doi: 10.1002/ksa.12492. Epub 2024 Sep 30. Knee Surg Sports Traumatol Arthrosc. 2025. PMID: 39344759
-
Machine-learning Models Predict 30-Day Mortality, Cardiovascular Complications, and Respiratory Complications After Aseptic Revision Total Joint Arthroplasty.Clin Orthop Relat Res. 2022 Nov 1;480(11):2137-2145. doi: 10.1097/CORR.0000000000002276. Epub 2022 Jun 20. Clin Orthop Relat Res. 2022. PMID: 35767804 Free PMC article.
-
Predicting 30-day unplanned hospital readmission after revision total knee arthroplasty: machine learning model analysis of a national patient cohort.Med Biol Eng Comput. 2024 Jul;62(7):2073-2086. doi: 10.1007/s11517-024-03054-7. Epub 2024 Mar 7. Med Biol Eng Comput. 2024. PMID: 38451418
-
Using Visual Analytic Methods to Identify Patient Groups [Internet].Washington (DC): Patient-Centered Outcomes Research Institute (PCORI); 2021 Jun. Washington (DC): Patient-Centered Outcomes Research Institute (PCORI); 2021 Jun. PMID: 38781405 Free Books & Documents. Review.
References
-
- Sloan M, Premkumar A, Sheth NP (2018) Projected volume of primary total joint arthroplasty in the U.S., 2014 to 2030. J Bone Joint Surg Am 100(17):1455–1460 - PubMed
LinkOut - more resources
Full Text Sources
Miscellaneous
