. 2025 Mar;12(9):e2410595.
doi: 10.1002/advs.202410595. Epub 2025 Jan 13.

Enhancing the Implant Osteointegration via Supramolecular Co-Assembly Coating with Early Immunomodulation and Cell Colonization

Affiliations

Enhancing the Implant Osteointegration via Supramolecular Co-Assembly Coating with Early Immunomodulation and Cell Colonization

Chenglong Wang et al. Adv Sci (Weinh). 2025 Mar.

Abstract

Osteointegration, the effective coupling between an implant and bone tissue, is a highly intricate biological process. The initial stages of bone-related immunomodulation and cellular colonization play crucial roles, but have received limited attention. Herein, a novel supramolecular co-assembled coating of strontium (Sr)-doped metal polyphenol networks (MPN) modified with c(RGDfc) is developed and well-characterized, for eliciting an early immunomodulation and cellular colonization. The results showed that the (Sr-MPN)@RGD coating significantly regulated the polarization of macrophages to the M2 phenotype by controllable release of Sr, and promote the initial adhesion of bone marrow mesenchymal stem cells (BMSCs) by RGD presented on MPN. Notably, the (Sr-MPN)@RGD attenuated osteoclast differentiation and oxidative stress as well as enhanced osteoblast differentiation and angiogenesis due to macrophage polarization toward M2 phenotype, which in turn has a profound effect on neighboring cells through paracrine signaling. In vivo results showed that the (Sr-MPN)@RGD coating manifested superior osseointegration and bone maturation to the bare Ti-rod or Ti-rod coated with MPN and Sr-MPN. This work contributed to the design of multifunctional implant coatings that address the complex biological process of osteointegration from the perspective of orchestrating stem cell recruitment with immunomodulatory strategies.

Keywords: RGD; colonization; metal‐phenolic network; osteoimmunology; strontium.


Conflict of interest statement

The authors declare no conflict of interest.

Figures

Scheme 1
Scheme 1
a) Schematic representation of the workflow of (i) Sr‐MPN coating and (ii) (Sr‐MPN)@RGD coating. b) The biological function of (Sr‐MPN)@RGD coating. (i) Primarily, it modulates macrophage polarization, favoring the M1 phenotype over the M2 phenotype. (ii) This coating demonstrates a capacity to recruit BMSCs to its surface, significantly enhancing cellular adhesion. (iii) The coating showcases potent antioxidant properties, effectively scavenging reactive oxygen species (ROS). These combined functionalities culminate in the promotion of surrounding bone and vascular tissue formation while simultaneously inhibiting bone resorption.
Figure 1
Figure 1
Characterization of strontium incorporation. a) Setting the molar concentration of Fe and Sr both set to 1.5 mM, under different pH levels, XPS analysis showed that the proportion of Sr element (yellow histogram) and the elliptic polarization instrument measured coating thickness (red line). b) At a fixed pH of 4.5 and a Sr molar concentration of 1.5 mM, as the molar concentration of Fe was varied, the XPS‐detected Sr element composition (yellow histogram) and thickness of coatings (red line) were measured. c) With a pH of 4.5 and a fixed Fe molar concentration of 1.5 mM, as different molar concentrations of Sr were introduced, the XPS‐detected Sr element composition (yellow histogram) and thickness of coatings (red line) were measured. d) The thickness of MPN and Sr‐MPN coating. e) XPS wide spectra scan of MPN and Sr‐MPN coating. f) Total amount of Sr and Fe at Sr‐MPN coating detected by ICP‐MS. N = 3.
Figure 2
Figure 2
Characterization of MPN, Sr‐MPN, and (Sr‐MPN)@RGD coatings. a) The thickness of the different coatings was measured by elliptography. b) Representative (i) SEM and (ii) frontal AFM image of the different coatings synthesized on the surface of Ti slices. c) Mean square roughness (Rq) of the different coatings. d) Representative EDS of (Sr‐MPN)@RGD coating. e) XPS wide spectral scan of the different coatings. f) Average zeta potential of different coatings on the surface of the PS pellets. g) Water contact angle of different coatings on Ti plate. The scale bars in (b–i) are 100 nm, (b–ii) are 250 nm, and (d) are 50 nm. Using t‐test in (c), no significance noted as “ns,” *p < 0.05, **p < 0.01, ***p < 0.001 compared between the two group, and #p < 0.05, ##p < 0.01 or ###p < 0.001 compared with the MPN group. N = 3.
Figure 3
Figure 3
Analysis of thickness change of Sr‐MPN and (Sr‐MPN)@RGD coating in a) DMEM, b) pH = 3.5, and c) pH = 10.5 at 37 °C. Release of d) Sr2+, e) Fe3+ and f) PC from (Sr‐MPN)@RGD coating in different pH at 37 °C. N = 3.
Figure 4
Figure 4
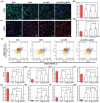
MPN, Sr/ MPN, and (Sr‐MPN)@RGD coatings regulated macrophage polarization in vitro. Representative images of a) CD86 (M1, green) and b) CD206 (M2, red) immunofluorescence staining of cells cultured on Ti, Ti‐MPN, Ti‐Sr‐MPN, and Ti‐(Sr‐MPN)@RGD coated surfaces after stimulation with LPS and IFN‐γ for 48 h. e) Flow cytometric analysis demonstrating M1 (CD86, APC) and M2 (CD206, PB450) phenotypic polarization of macrophages on various coatings. Quantitative analysis presented the proportion of M1 (CD86+) f) and M2 (CD206+) g) macrophages. qPCR analysis of the relative mRNA expression of h) CD86, i) iNOS, j) IL‐1β, k) IL‐10, l) TGF‐β and m) CD206 in cells cultured on different coated surfaces after LPS and IFN‐γ stimulation for 48 h. The dashed line in (h‐m) represents the negative control group. Scale bars in (a) and (c) are 50 µm. N = 3, using t‐test, no significance noted as “ns,” *p < 0.05, **p < 0.01, ***p < 0.001 compared between the two group, and #p < 0.05, ##p < 0.01 or ###p < 0.001 compared with the Positive Control group.
Figure 5
Figure 5
Cell attachment, proliferation, and migration on MPN, Sr‐MPN, and (Sr‐MPN)@RGD coatings. a) Optical image of BMSCs migration. b) The number of migrating BMSCs cells obtained by statistical analysis from (e). c) BMSCs cultured on different coatings for 2 and 4 h were stained with nuclear (blue) and phalloidin (red) fluorescence. d) The area of each cell was statistically analyzed from (c). e) Calcein‐PI staining of BMSCs cultured on different coatings for 3 days. f) CCK8 assay of BMSCs cultured on different coatings at various time points. g) (i) Schematic representation of the coating regulating macrophages to secrete a variety of cytokines to recruit BMSCs, and the composite coating promoting BMSCs (ii) adhesion and (iii) proliferation. Scale bars in (a) are 100 µm, in (c) are 50 µm, in (e) are 200 µm. N = 3, using t‐test, no significance noted as “ns,” *p < 0.05, **p < 0.01, ***p < 0.001 compared between the two group, and #p < 0.05, ##p < 0.01 or ###p < 0.001 compared with the Control group.
Figure 6
Figure 6
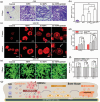
Osteodifferentiation of BMSCs on different modified substrates. a) Representative images of ALP staining after 7 days of co‐culture with coatings with LI‐CM and Alizarin Red S staining after 21 days. b) Quantitative analysis of ALP activity. c) Quantitative analysis of calcium deposition. Relative mRNA expression of d) OCN, e) OPN, f) ON, and g) College I genes in BMSCs cultured in different modified substrates for 7 days. Scale bars in (a) are 200 µm. N = 3, using t‐test, no significance noted as “ns,” *p < 0.05, **p < 0.01, ***p < 0.001 compared between the two group, and #p < 0.05, ##p < 0.01 or ###p < 0.001 compared with the Control group.
Figure 7
Figure 7
Transcriptome sequencing analysis of BMSCs cultured on Ti and Ti‐(Sr‐MPN)@RGD coating after osteogenic induction for 7 days. GO pathway enrichment analysis of DEGs with a) up and b) down expression. GSEA analysis of the regulation of c) extracellular matrix organization, d) collagen fibril organization, e) response to interleukin‐1, f) cellular response to interferon‐beta, g) positive regulation of intrinsic apoptotic signaling pathway, and h) bone morphogenesis.
Figure 8
Figure 8
Osteoinductive and osseointegration capacities of functionalized Ti‐based materials in vivo. a) Micro‐CT was used to detect the quality of the regenerated bone around the implanted Ti rods containing different coatings after 4 and 8 weeks. b) Comparison of the bone volume fraction (BV/TV %) of the implants of (a). c) Comparison of the trabecular number (Tb. N 1 mm−1) of the implants of (b). d) Representative HE staining images of bone tissue (BT) around different implants in epiphysis regions. e) Representative Masson staining images of new bone maturity. The blue and red represent low and high maturity bone tissue, respectively. Scale bars in (d,e) are 200 µm. N = 3, no significance noted as “ns,” *p < 0.05, **p < 0.01, ***p < 0.001 compared between the two group, and #p < 0.05, ##p < 0.01 or ###p < 0.001 compared with the Control group, using t‐test.
Figure 9
Figure 9
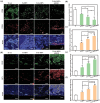
Inflammation, angiogenesis, and osteogenesis of bone tissue around Ti rods coated with (Sr‐MPN)@RGD coating. a) Representative fluorescent images showing the expression of CD86 (M1 marker, green), and CD206 (M2 marker, red) at the bone‐implant interface 4 weeks after implantation. Fluorescence quantification of b) CD86 and c) CD206 in (a). d) Representative fluorescent images showing the expression of VEGF (green), and OCN (red) at the bone‐implant 8 weeks after implantation. Fluorescence quantification of e) VEGF and f) OCN in (b). Scale bars in (a) and (d) are 100 µm. N = 3, no significance noted as “ns,” *p < 0.05, **p < 0.01, ***p < 0.001 compared between the two group, and #p < 0.05, ##p < 0.01 or ###p < 0.001 compared with the Ti rod group, using t‐test.

References

    1. Habibovic P., Barralet J. E., Acta. Biomater. 2011, 7, 3013. - PubMed
    1. Xiong Y., Mi B. B., Lin Z., Hu Y. Q., Yu L., Zha K. K., Panayi A. C., Yu T., Chen L., Liu Z. P., Patel A., Feng Q., Zhou S. H., Liu G. H., Mil. Med. Res. 2022, 9, 65. - PMC - PubMed
    1. Duda G. N., Geissler S., Checa S., Tsitsilonis S., Petersen A., Schmidt‐Bleek K., Nat. Rev. Rheumatol. 2023, 19, 78. - PubMed
    1. Buser D., Urban I., Monje A., Kunrath M. F., Dahlin C., Periodontol 2000 2023, 93, 9. - PubMed
    1. Wang T., Bai J., Lu M., Huang C., Geng D., Chen G., Wang L., Qi J., Cui W., Deng L., Nat. Commun. 2022, 13, 160. - PMC - PubMed

MeSH terms

LinkOut - more resources