. 2025 Feb;21(2):e14543.
doi: 10.1002/alz.14543. Epub 2025 Jan 14.

Inhibition of IFITM3 in cerebrovascular endothelium alleviates Alzheimer's-related phenotypes

Affiliations

Inhibition of IFITM3 in cerebrovascular endothelium alleviates Alzheimer's-related phenotypes

Yijia Feng et al. Alzheimers Dement. 2025 Feb.

Abstract

Introduction: Interferon-induced transmembrane protein 3 (IFITM3) modulates γ-secretase in Alzheimer's Disease (AD). Although IFITM3 knockout reduces amyloid β protein (Aβ) production, its cell-specific effect on AD remains unclear.

Methods: Single nucleus RNA sequencing (snRNA-seq) was used to assess IFITM3 expression. Adeno-associated virus-BI30 (AAV-BI30) was injected to reduce IFITM3 expression in the cerebrovascular endothelial cells (CVECs). The effects on AD phenotypes in cells and AD mice were examined through behavioral tests, two-photon imaging, flow cytometry, Western blot, immunohistochemistry, and quantitative polymerase chain reaction assay (qPCR).

Results: IFITM3 expression was increased in the CVECs of patients with AD. Overexpression of IFITM3 in primary endothelial cells enhanced Aβ generation through regulating beta-site APP cleaving enzyme 1 (BACE1) and γ-secretase. Aβ further increased IFITM3 expression, creating a vicious cycle. Knockdown of IFITM3 in CVECs decreased Aβ accumulation within cerebrovascular walls, reduced Alzheimer's-related pathology, and improved cognitive performance in AD transgenic mice.

Discussion: Knockdown of IFITM3 in CVECs alleviates AD pathology and cognitive impairment. Targeting cerebrovascular endothelial IFITM3 holds promise for AD treatment.

Highlights: Interferon-induced transmembrane protein 3 (IFITM3) expression was increased in the cerebrovascular endothelial cells (CVECs) of patients with Alzheimer's Disease (AD). Cerebrovascular endothelial IFITM3 regulates amyloid β protein (Aβ) generation through regulating beta-site APP cleaving enzyme 1 (BACE1) and γ-secretase. Knockdown of IFITM3 in CVECs reduces Aβ deposits and improves cognitive impairments in AD transgenic mice. Cerebrovascular endothelial IFITM3 could be a potential target for the treatment of AD.

Keywords: Alzheimer's Disease; Aβ; IFITM3; cerebrovascular endothelium; cognitive impairment.


Conflict of interest statement

The authors declare no competing interests. Author disclosures are available in the supporting information.

Figures

FIGURE 1
FIGURE 1
IFITM3 is upregulated in the CVECs of patients with AD. (A) Left, the UMAP plot showed the major cell types isolated from the brain cortex of controls and AD patients. Right, the UMAP plot showed the distribution of IFITM3 transcripts in various cell types of the brain cortex of control and AD patients. (B) The expression level of IFITM3 and the vascular endothelial cell markers PECAM1 and VWF in the CVECs of control or AD patients. (C) Left, the UMAP plot showed the subpopulations of the CVECs. Middle, the distribution of IFITM3 transcripts in various subpopulations of the CVECs. Right, the UMAP plot dividing the CVECs into IFITM3‐high or IFITM3‐low group according to the transcriptional levels of IFITM3. (D) The volcano plot showed the DEGs between the IFITM3‐high and IFITM3‐low group. (E) The heatmap of the top 50 DEGs in Figure 1D. (F) The KEGG analysis of the DEGs between the IFITM3‐high and IFITM3‐low group. ECs, endothelial cells. CVECs, cerebrovascular endothelial cell; DEGs, differentially expressed genes; KEGG, Kyoto Encyclopedia of Genes and Genomes; UMAP, Uniform Manifold Approximation and Projection.
FIGURE 2
FIGURE 2
IFITM3 is upregulated in the CVECs of AD transgenic mouse models. (A) The immunofluorescence of IFITM3 in the CVECs of WT and APP23/PS45 double transgenic AD mice (DTg‐AD). IFITM3 signal surrounds Aβ plaque in DTg‐AD mice. Scale bar = 50 µm or 20 µm. (B) The immunofluorescence of IFITM3 in the CVECs of WT and 5XFAD mice. Scale bar = 50 µm or 20 µm. (C) The fluorescent quantitation of CD31‐positive IFITM3 in A. n = 4–5 mice. Unpaired t‐test, *p < 0.05, values are mean ± SEM. (D) The fluorescent quantitation of CD31‐positive IFITM3 in B. n = 3–4 mice. Unpaired t‐test, **p < 0.01, values are mean ± SEM.(E) Flow cytometry fluorescence intensity of IFITM3 in the CVECs of WT and APP23/PS45 double transgenic AD mice (DTg‐AD). (F) Left, The proportion of the IFITM3‐positive subset (> 104) within the total population of IFITM3‐positive endothelial cells. n = 4 mice. Unpaired t‐test, **p < 0.01, values are mean ± SEM. Right, the mean fluorescence intensity (MFI) of IFITM3 in CD31‐positive endothelial cells. n = 4 mice. Unpaired t‐test, ****p < 0.0001, values are mean ± SEM.
FIGURE 3
FIGURE 3
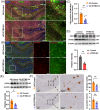
Knockdown of IFITM3 in the CVECs alleviated Aβ deposition in APP23/PS45 mice. (A) Representative image of mCherry (red), CD31 (purple), and IFITM3(green) in hippocampus of APP23/PS45 mice following intravenous injection of AAV‐BI30 virus for 2.5 months. Scale bar = 500 µm. Enlarged view of the white box reveals the colocalization of mCherry (red), CD31 (purple), and IFITM3(green) signals. Scale bar = 100 µm. (B) Representative image of IFITM3 (green) and mCherry (red) in APP23/PS45 mice. Scale bar = 500 µm. Enlarged view of the white box reveals a noticeable reduction in IFITM3 protein levels in the brain following knockdown of IFITM3 in the CVECs. Scale bar = 100 µm. (C) The fluorescent quantitation of IFITM3 in B. n = 6 mice. Unpaired t‐test, **p < 0.01, values are mean ± SEM. (D) Protein levels of IFITM3 were analyzed in endothelial cells isolated from WT mice following intravenous injection of AAV‐BI30‐Control or AAV‐BI30‐shRNA‐IFITM3 virus. n = 3. Unpaired t‐test, **p < 0.01, values are mean ± SEM. (E) Protein levels of IFITM3 in APP23/PS45 mice following knockdown of IFITM3 in CVECs. n = 6 mice. Unpaired t‐test, *p < 0.05, values are mean ± SEM. (F) DAB immunohistochemistry of Aβ plaques with 6E10 antibody in APP23/PS45 mice following knockdown of IFITM3 in CVECs. Quantitative analysis of Aβ plaque number and Aβ‐positive area in the hippocampus and cortex. Scale bar = 1 mm or 200 µm. n = 6 mice, Unpaired t‐test, **p < 0.01, values are mean ± SEM.
FIGURE 4
FIGURE 4
Knockdown of IFITM3 in the CVECs improved the cognitive impairment in APP23/PS45 mice. (A) Percentage of spontaneous alterations in the Y‐maze test. n = 10–12 in AD mice. One‐way ANOVA analysis followed by Dunnett's multiple comparisons test, *p < 0.05, values are mean ± SEM. (B) Recognition index of novel object recognition test. n = 12–14 in AD mice. One‐way ANOVA analysis followed by Dunnett's multiple comparisons test, ***p < 0.001, values are mean ± SEM. (C) Escape latencies of APP23/PS45 and wild‐type mice in the first day of Morris water maze. n = 10–12 in AD mice. One‐way ANOVA analysis followed by Dunnett's multiple comparisons test; values are mean ± SEM. (D) Path length of APP23/PS45 and wild‐type mice in the first day of Morris water maze. n = 10–12 in AD mice. One‐way ANOVA analysis followed by Dunnett's multiple comparisons test; values are mean ± SEM. (E) Escape latencies and path length of APP23/PS45 and wild‐type mice during days 2 to 5 in the Morris water maze. n = 10–12 in AD mice. Two‐way ANOVA analysis followed by Dunnett's multiple comparisons test, *p < 0.05, values are mean ± SEM. (F) Left, time spent swimming in the target zone during the probe trial. n = 10–12 in AD mice. One‐way ANOVA analysis followed by Dunnett's multiple comparisons test, *p < 0.05, values are mean ± SEM. Right, Number of platform crossings during probe trial. n = 10–12 in AD mice. One‐way ANOVA analysis followed by Dunnett's multiple comparisons test, *p < 0.05, values are mean ± SEM. (G) Freezing time in the fear conditioning test. n = 10–12 in AD mice. One‐way ANOVA analysis followed by Dunnett's multiple comparisons test, *p < 0.05, values are mean ± SEM.
FIGURE 5
FIGURE 5
Interaction between IFITM3 and Aβ. (A) Live two‐photon imaging showed a distinct AAV‐BI30 mCherry (red) signal juxtaposed with the periphery of the dextran (green) vascular signal. Scale bar = 100 µm. (B) Live two‐photon imaging showed fluorescent probes methoxy‐x04 of Aβ plaques (blue) were inside the cerebral blood vessels (green). (C) Quantitative analysis of plaque fluorescence density within brain vessels involved calculating the mean values obtained from three segments of blood vessels, each of identical length, per image. A minimum of three images were captured for each mouse to ensure statistical analysis. n = 3 mice. Unpaired t‐test, ***p < 0.001, values are mean ± SEM. (D) mRNA expression of IFITM3 after infection with lentivirus. n = 4. Unpaired t‐test, **p < 0.01, values are mean ± SEM. (E) Quantification of western blot assays to measure the protein levels of IFITM3 on mBMECs infected with control and IFITM3 overexpressing (IFITM3‐OE) lentivirus. n = 3. Unpaired t‐test, **p < 0.01, values are mean ± SEM. (F) Quantification of Aβ40 in the supernatant of mBMECs measured by ELISA. n = 6. Unpaired t‐test, *p < 0.05, values are mean ± SEM. (G) Protein levels of flag‐tag following infection with IFITM3‐OE lentivirus. (H) Quantification of Aβ40 in the supernatant of hBMECs measured by ELISA. n = 6. Unpaired t‐test, ***p < 0.001, values are mean ± SEM. (I) Quantification of western blot assays to measure the protein levels of IFITM3 following stimulation with Aβ40 oligomers in hBMECs, n = 7. Unpaired t‐test, ****p < 0.0001, values are mean ± SEM. hBMECs, human primary brain microvascular endothelial cells; mBMECs, mouse primary brain microvascular endothelial cells.
FIGURE 6
FIGURE 6
Cerebrovascular endothelial IFITM3 regulates BACE1 expression and γ‐secretase activity. (A) Quantification of western blot assays to measure the protein levels of APP CTFs following infection with Swedish mutant APP and IFITM3‐OE lentivirus, with or without γ‐secretase inhibitor L685458 treatment, n = 4. One‐way ANOVA analysis followed by Tukey's multiple comparisons test, *p < 0.05, ***p < 0.001, values are mean ± SEM. (B) Quantification of Aβ40 in the cultured media of hBMECs measured by ELISA. n = 9. Unpaired t‐test, *p < 0.05, values are mean ± SEM. (C) Left, protein levels of BACE1 and IFITM3 following infection with IFITM3 overexpressing (IF‐OE) lentivirus. Right, the quantitative analysis of western blot revealed a significant increase in the levels of IFITM3 and BACE1 following overexpression of IFITM3 in hBMECs. n = 6. Unpaired t‐test, **p < 0.01, values are mean ± SEM. (D) Quantitative analysis of BACE1 mRNA levels revealed a significant increase following the overexpression of IFITM3 in hBMECs. n = 6. Unpaired t‐test, ***p < 0.001, values are mean ± SEM.
FIGURE 7
FIGURE 7
Diagram to illustrate the mechanism underlying the effect of cerebrovascular endothelial IFITM3 on AD phenotypes. Inflammatory conditions such as infections, aging, and vascular risk factors prompt an increase in IFITM3 expression within the cerebrovascular endothelial cells. Increased IFITM3 level amplifies BACE1 and γ‐secretase activity, thereby augmenting Aβ production. Consequently, the accumulation of Aβ further facilitates IFITM3 expression in the CVECs. This vicious cycle disrupts cerebrovascular function, impeding perivascular clearance mechanisms, and culminating in further accumulation of Aβ within the brain parenchyma. This pathological cascade contributes to the progression of AD.

References

    1. Gao L, Zhang Y, Sterling K, Song W. Brain‐derived neurotrophic factor in Alzheimer's disease and its pharmaceutical potential. Transl Neurodegener. 2022;11:4. - PMC - PubMed
    1. Peng L, Bestard‐Lorigados I, Song W. The synapse as a treatment avenue for Alzheimer's Disease. Mol Psychiatry. 2022;27:2940‐2949. - PubMed
    1. Zhang Y, Chen H, Li R, Sterling K, Song W. Amyloid beta‐based therapy for Alzheimer's disease: challenges, successes and future. Signal Transduct Target Ther. 2023;8:248. - PMC - PubMed
    1. Love S, Miners JS. Cerebrovascular disease in ageing and Alzheimer's disease. Acta Neuropathol. 2016;131:645‐658. - PMC - PubMed
    1. van de Haar HJ, Jansen JFA, van Osch MJP, et al. Neurovascular unit impairment in early Alzheimer's disease measured with magnetic resonance imaging. Neurobiol Aging. 2016;45:190‐196. - PubMed

MeSH terms